
The Tweeting Tulip Tree at The Morton Arboretum shares its life experiences, scientific data, and tree care advice!
Joined March 2020
- Tweets 515
- Following 629
- Followers 608
- Likes 9,830
264 Photos and videos


2 May 2023
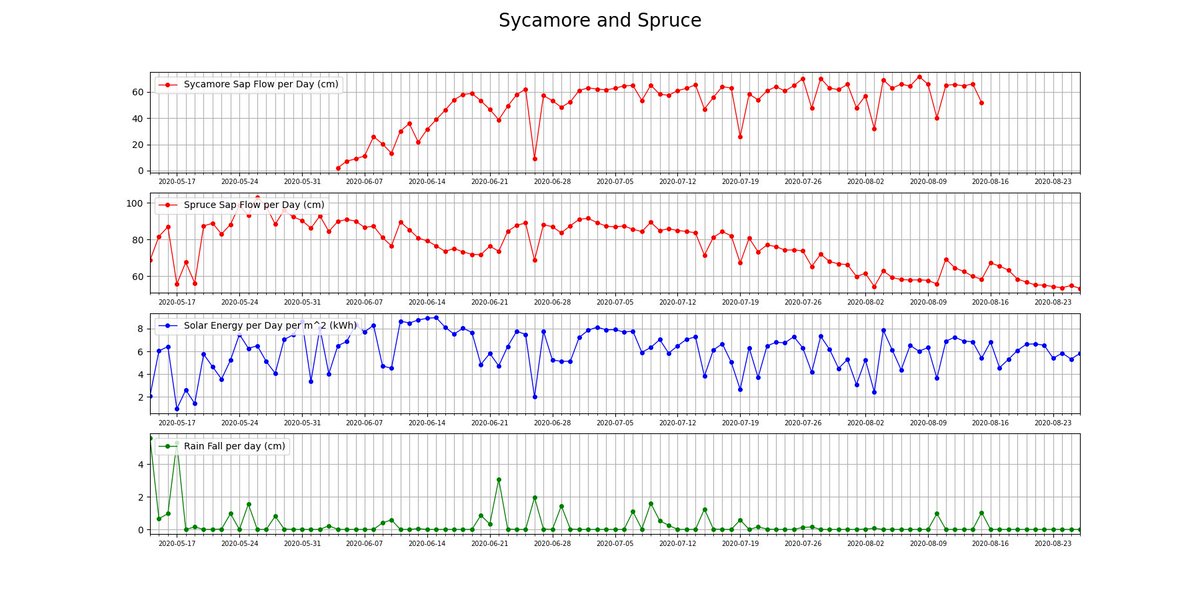
Solar radiation and precipitation are key drivers of sap flow in trees. In this composite graph you can see the Spruce and Sycamore trees reacting to changes in solar radiation and precipitation during the 2020 growing season☀️☔️ #DataAnalytics #DataScience #nature
2
249
24 Apr 2023
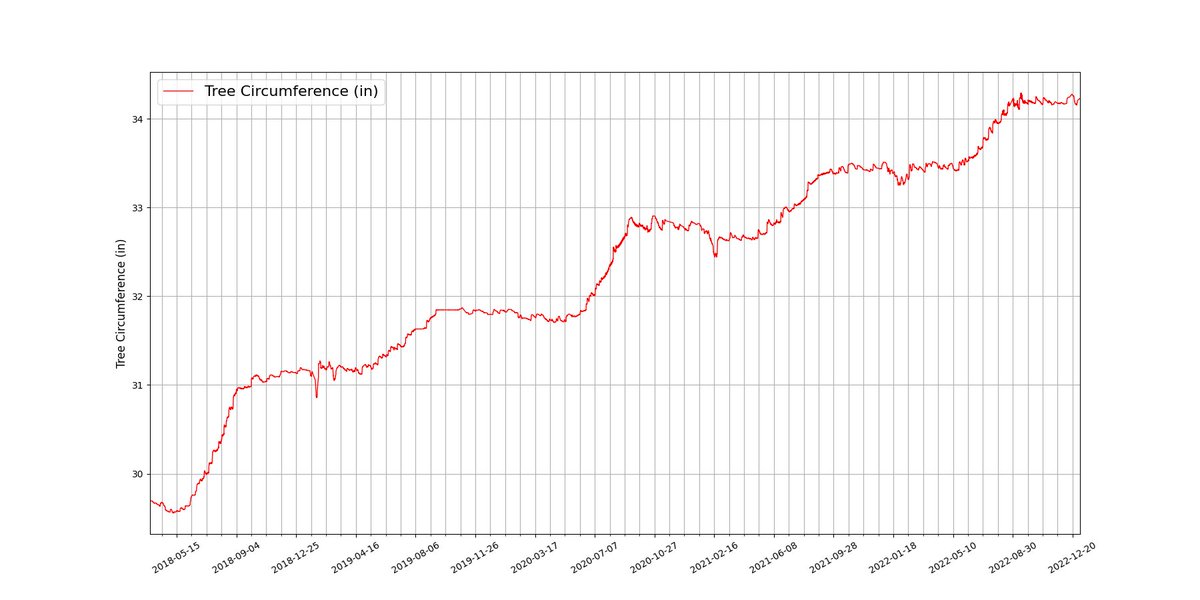
Scientists can measure tree trunk expansion using a dendrometer. This graph shows Sycamore dendrometer data over several years. It grows about an inch every year with small fluctuations throughout in response to weather conditions.📈🌳 #DataScience #DataAnalytics #nature #spring
4
235
18 Apr 2023
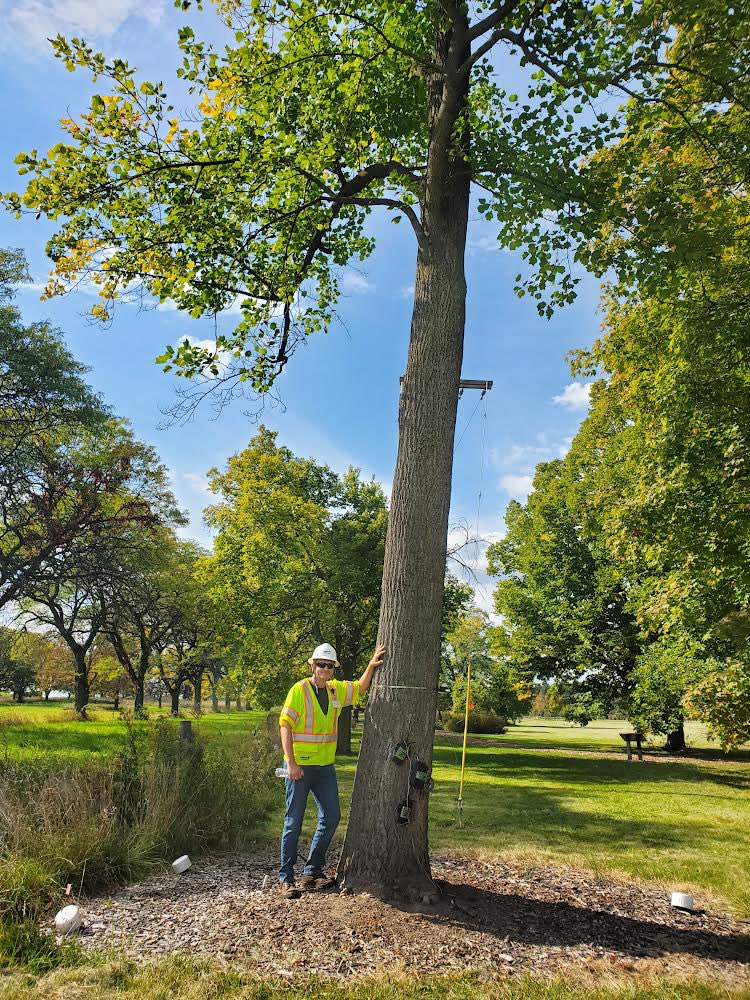
Hello Twitter! I am slowly waking up from my winter slumber ☀️ Click on the link below to hear from an @MortonArboretum scientist talking about the sensors that will monitor my physiological status this growing season🌳 m.youtube.com/watch?v=t5dhKY…
2
7
221
31 Jan 2023
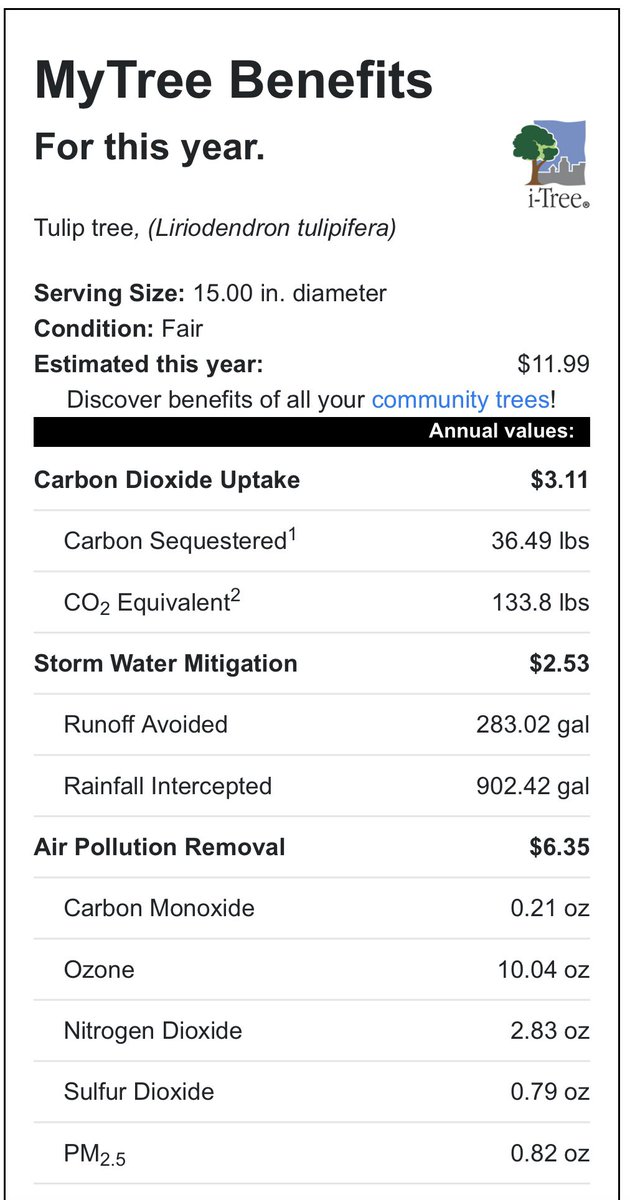
It’s goal setting season! My goals for 2023 are to mitigate storm water, provide cleaner air, and store carbon! What are your 2023 goals? #iTREE @iTreeTools #nature #2023goals #2023NewYear #trees #Science #DataScience
6
365
26 Jan 2023
❄️Some tree species are vulnerable to injury during the winter. Read more about winter injury to trees and how you can help protect your trees❄️: mortonarb.org/plant-and-prot…
#winter #weather #snow #WinterStorm #nature #snowstorm
4
290
19 Jan 2023
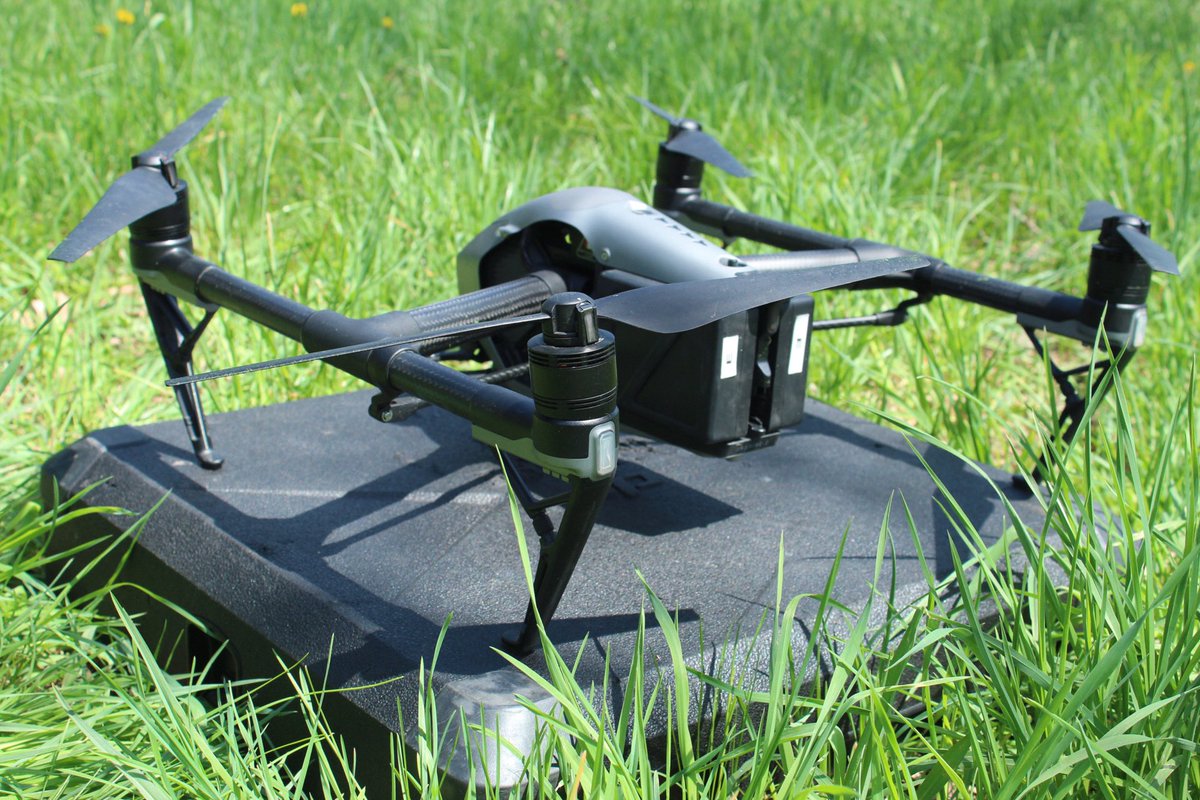
Drones play a huge role in tree science and conservation. Are you curious about the drone program at The Morton Arboretum? Ask me questions! #drone #nature #conservation #technologies #STEM @MortonArboretum
2
12
808
19 Dec 2022
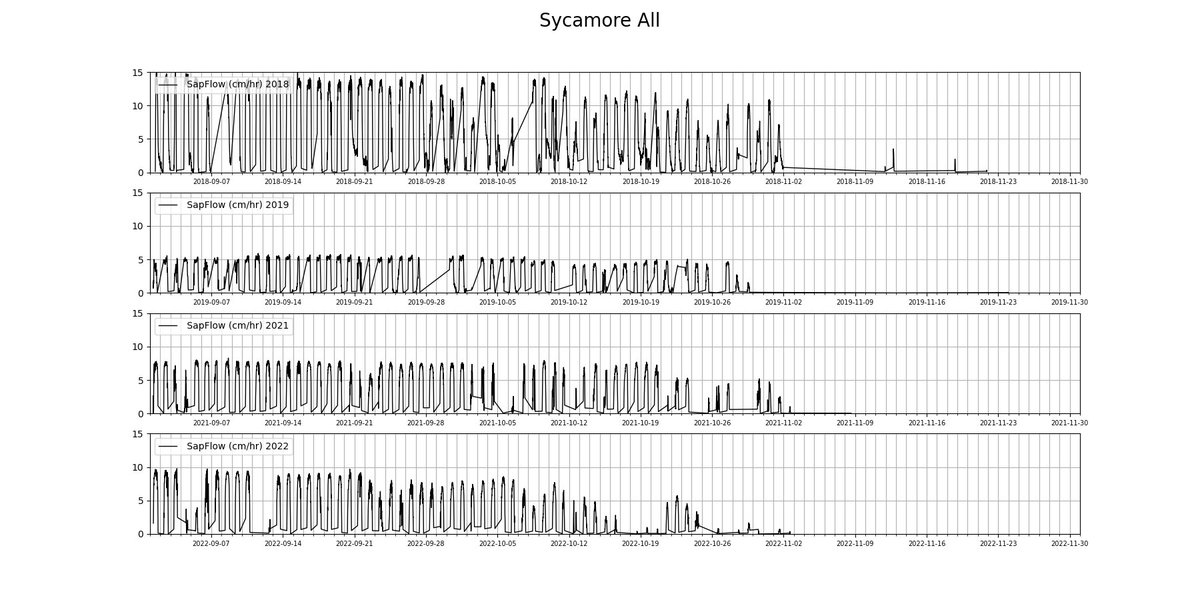
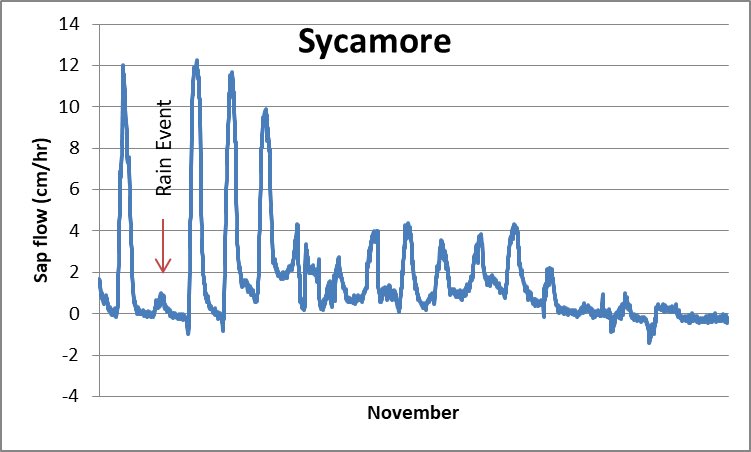
Here is sap flow data from the Sycamore last month. We can see when there was a significant rain event and when the tree began dropping its leaves (early/mid November). The Sycamore is now dormant for the winter ❄️ #data #dataScientist #phenology #winter
2
9
528
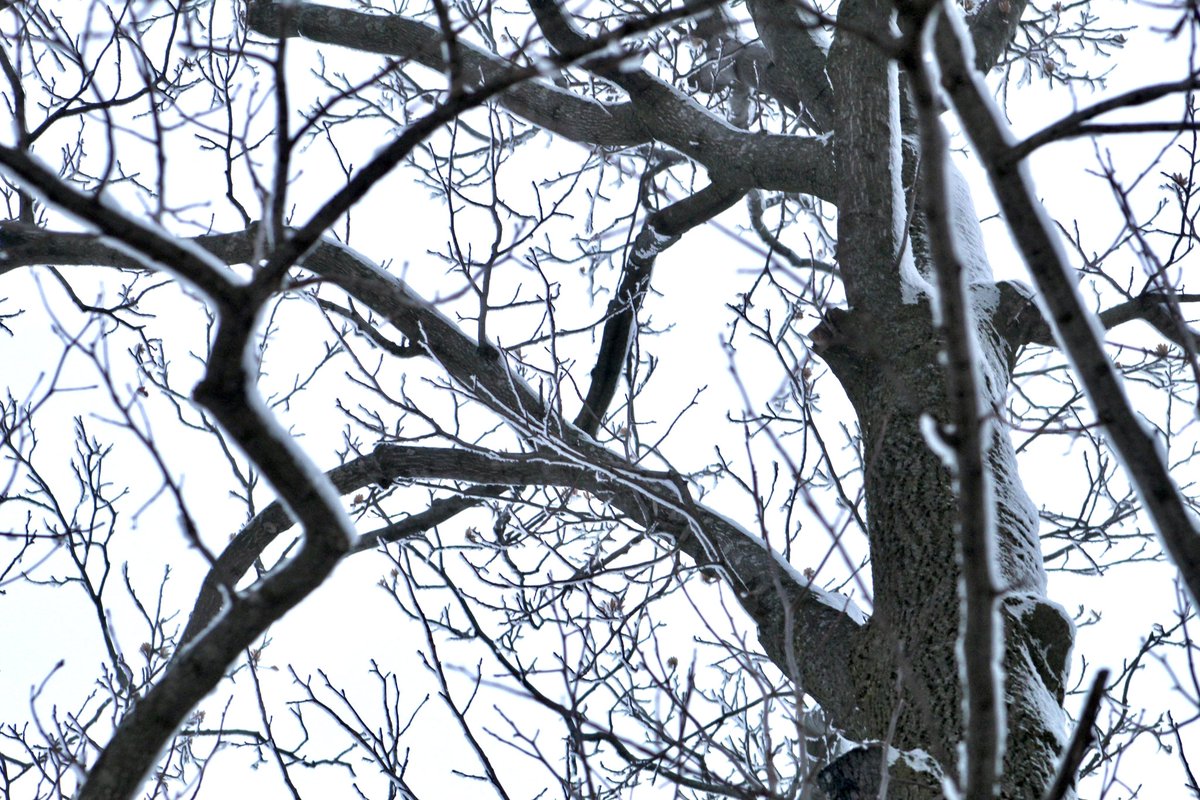
1 Dec 2022
November me vs December me
🍂➡️❄️
@AmericanForests #winter #fall #weather #phenology @USANPN @phenologists
1
3
8
2 Nov 2022
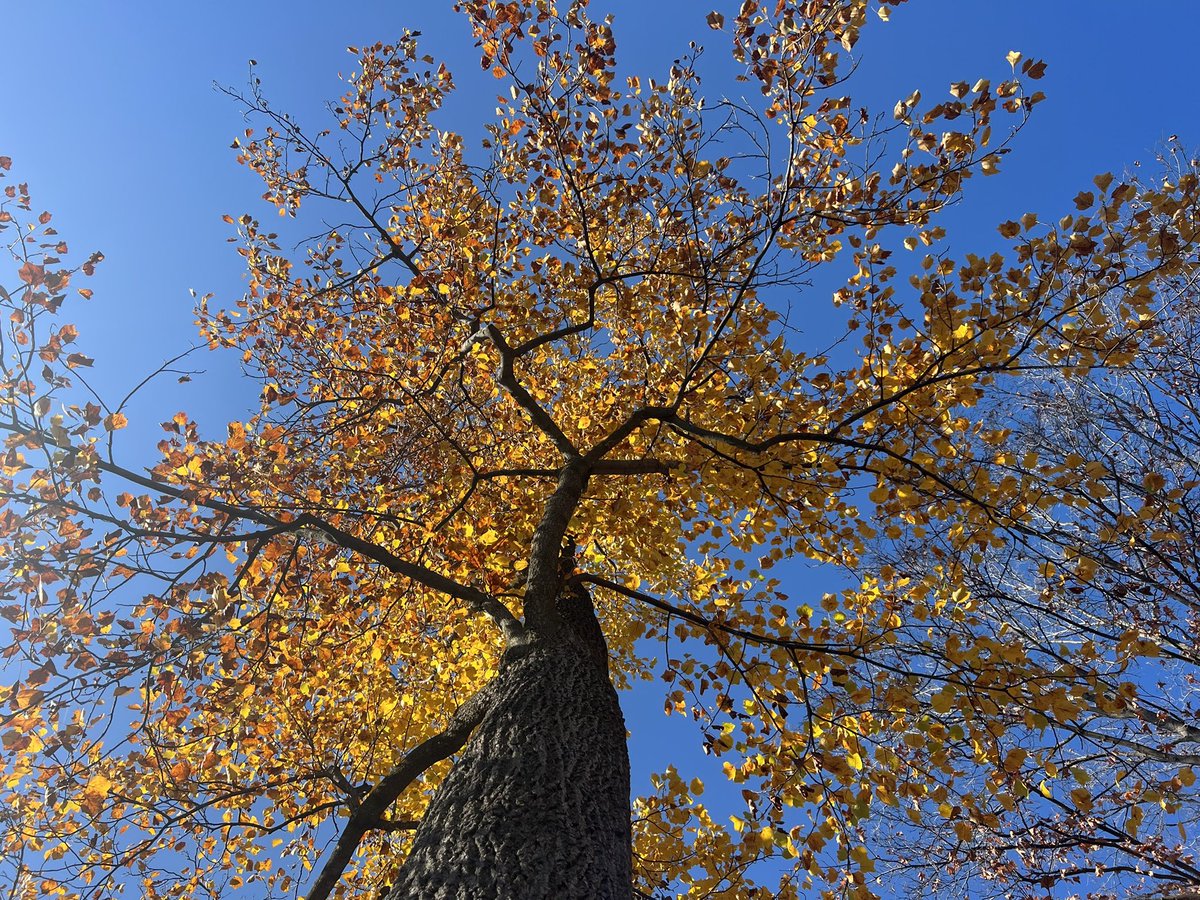
Happy November! 🍂🦃 I am showing off my fall color on this rather warm day. My weather station read 71 degrees F this afternoon. On this day last year, it was 46 degrees F. #phenology #fall #November #weather #data #DataScience #climate #trees #nature
2
8
26 Oct 2022
The Bowhall Maple’s average daily sap flow this month was ~3 cm/hr. Sap flow has dramatically slowed in the past few days as the final leaves fall and the tree goes into dormancy for the winter. 🍁❄️ #data #dataScientist #fall #weather #trees #foliage #phenology
1
4
17 Oct 2022
It has been a dry fall season 🍂 My weather station recorded 1.05 inches of rain so far this month. In October 2021, it recorded 7.05 inches of rain. #data #DataScientist #nature #phenology #fall #weather #October
1
9
10 Oct 2022
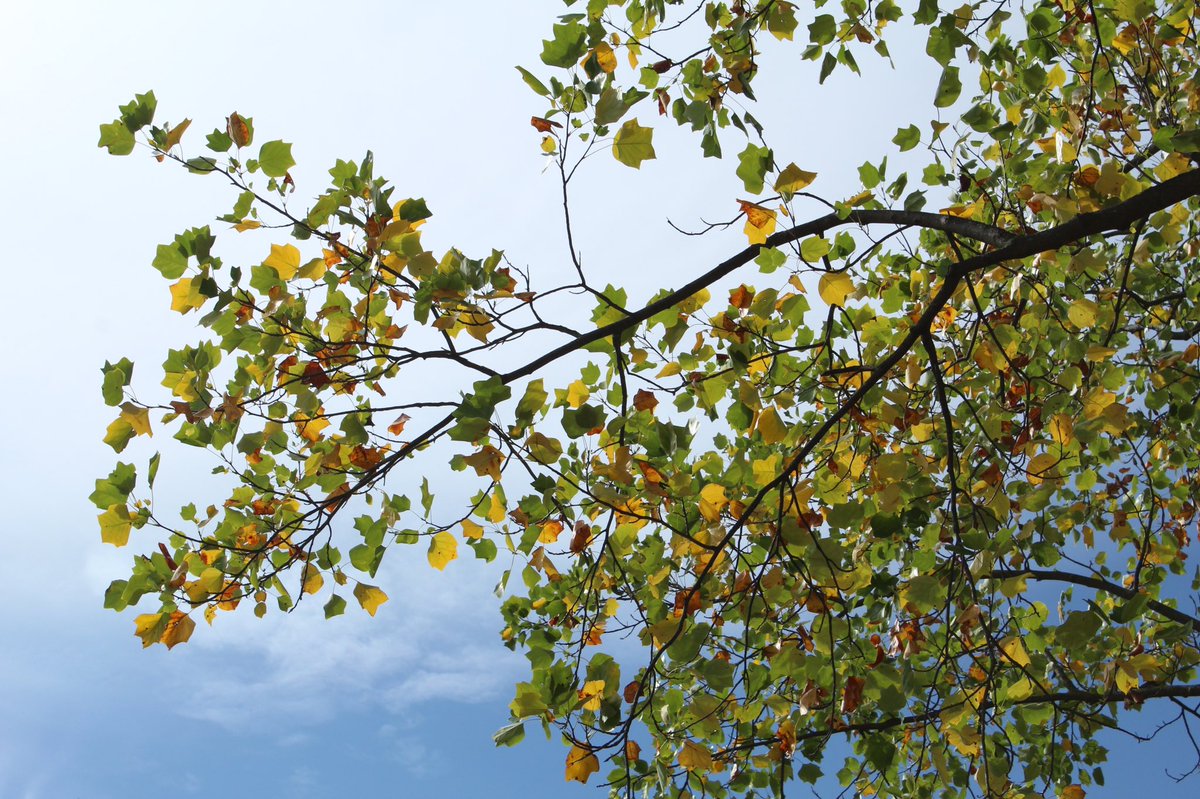
Thank you to the Davey Resource Group - Utility Vegetation Management crew for stopping by last week! @DaveyTree 🌳 My leaves are just beginning to change color 🍂 #Tree #nature #fall #phenology
1
3
7
3 Oct 2022
Happy October! 🍂 The Sycamore tree leaves are just beginning to change color, but the daily sap flow is still at a steady ~10cm/hr. #fall #trees #nature #phenology #data #DataScience #Weather #October #SpookySZN
2
9
28 Sep 2022
Even on this chilly fall day my daily sap flow is steady at about 6cm/hr., and my leaves are still green. #fall #data #fallvibes #phenology
1
6
22 Sep 2022
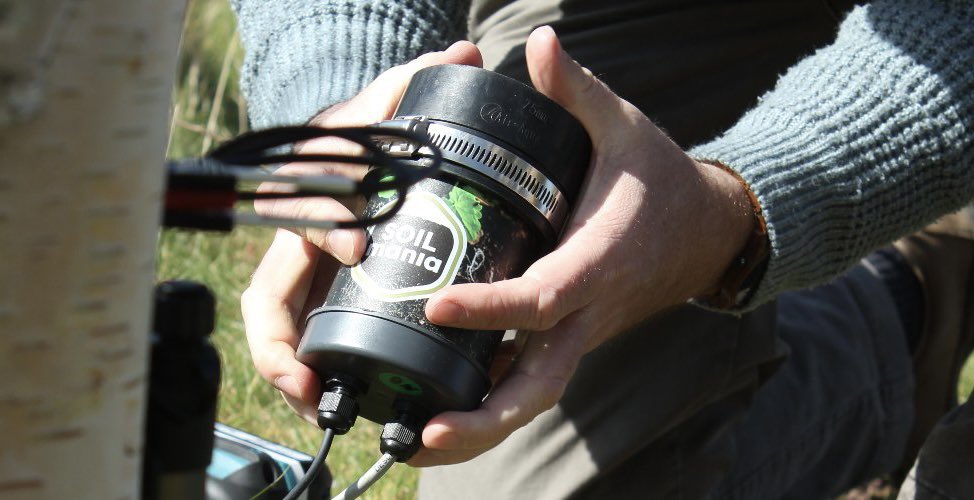
Everyone say hello to my tweeting tree friend from across the pond @bowiethebirch! 🇬🇧 Bowie tweets about soil quality how it effects the daily life of a birch tree.
#data #DataScience #nature #england #SoilHealth #soil
5
Tweeting Tulip Tree retweeted

2 Sep 2022
Good morning and happy first @MortonArboretum #PhenologyFriday of the fall cycle! Although we’re definitely still a ways away from peak fall plant-wise, now is when we amp up fall monitoring like leaf litter collection so we can really describe the temporal dynamics.
1
4
13
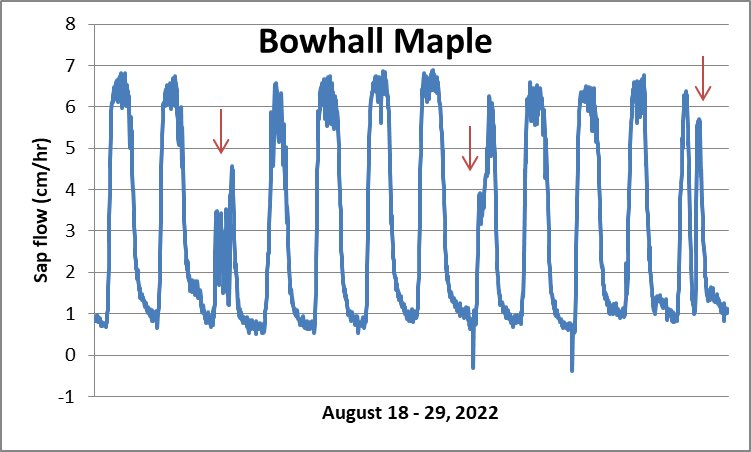
30 Aug 2022
In the last week of August, the Bowhall Maple’s average daily sap flow was about 5.3 cm/hr. The red arrows on the graph indicate a rain event. #data #DataScience #weather #phenology #fall #nature #trees
1
4