- Tweets 189
- Following 119
- Followers 548
- Likes 64


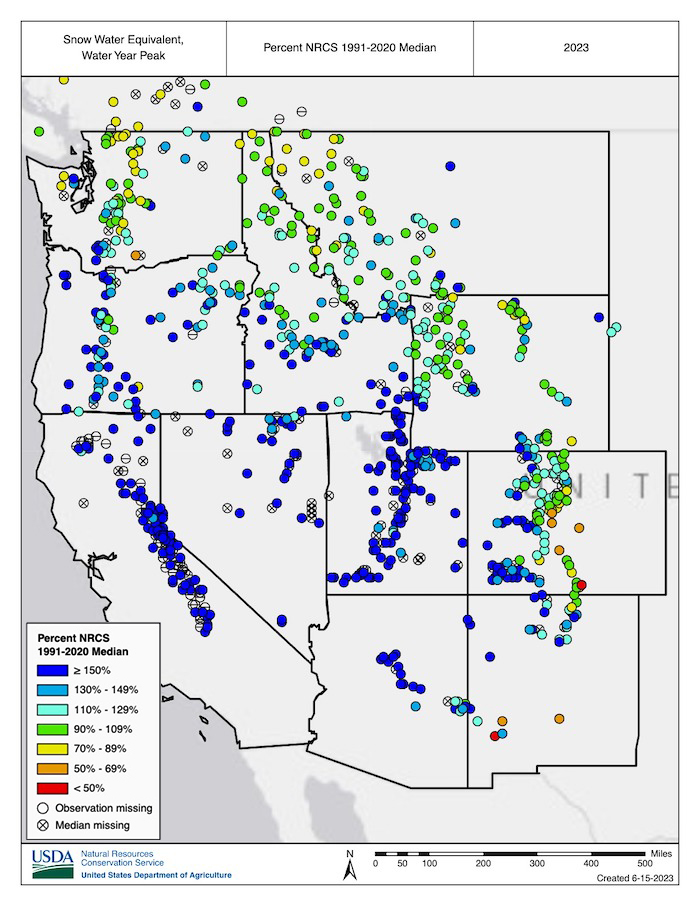
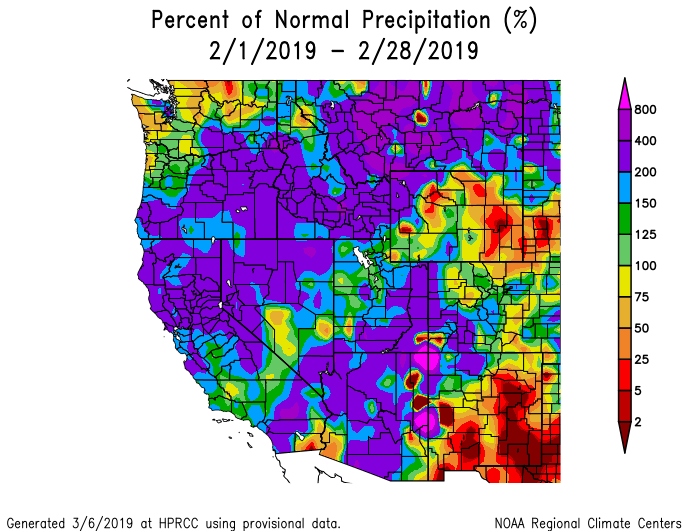
ALT A map of the Western U.S. showing SNOTEL snow water equivalent 2023 water year peak values as a percentage of the USDA Natural Resources Conservation Service 1991-2020 median. Many stations were well above values of 100%, with the exception of the Pacific Northwest and Northern Rockies.

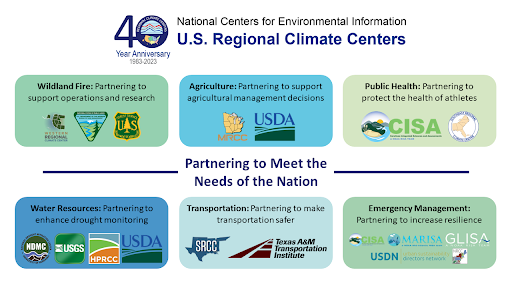
ALT Diagram showing examples of partnerships in selected sectors. There is a top row of boxes, and each box shows a sector, a short explanation of the importance of partnerships to that sector, and logos of programs corresponding to an example partnership within that sector. There is a header above the two rows of boxes and text between the two rows of boxes.


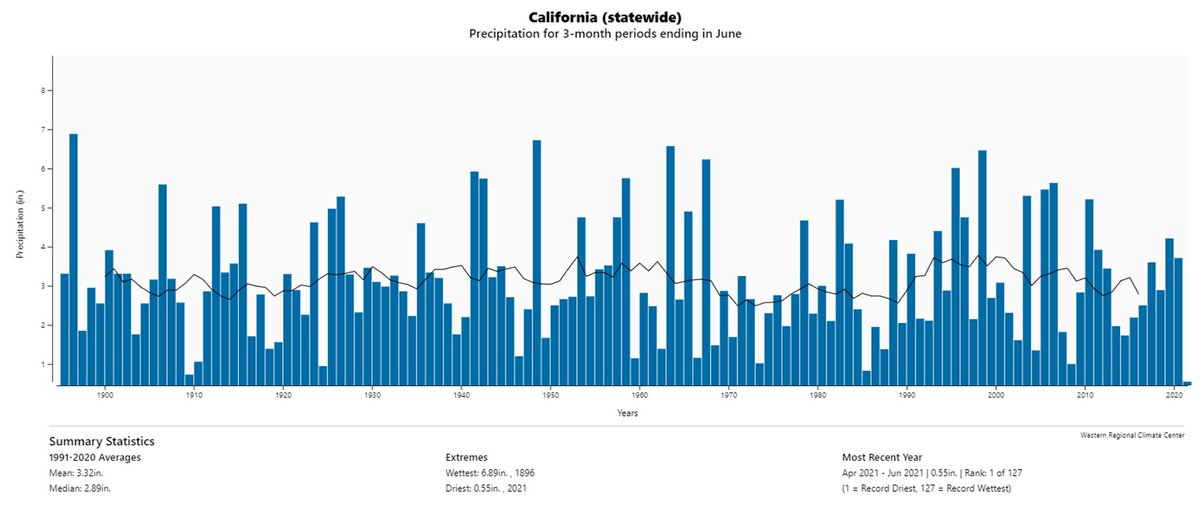
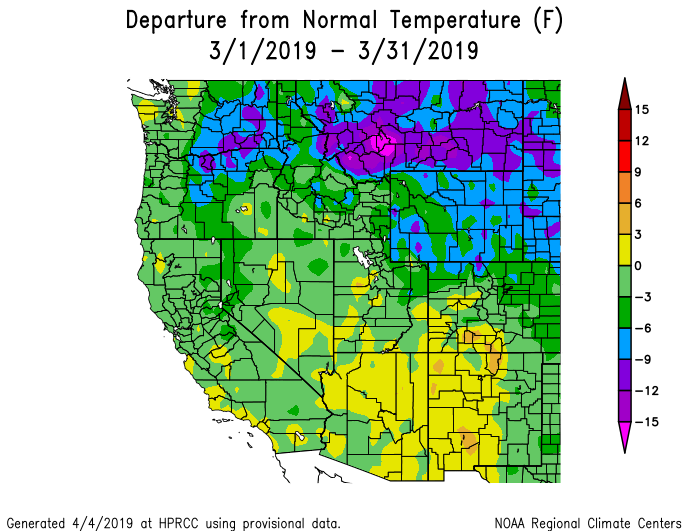
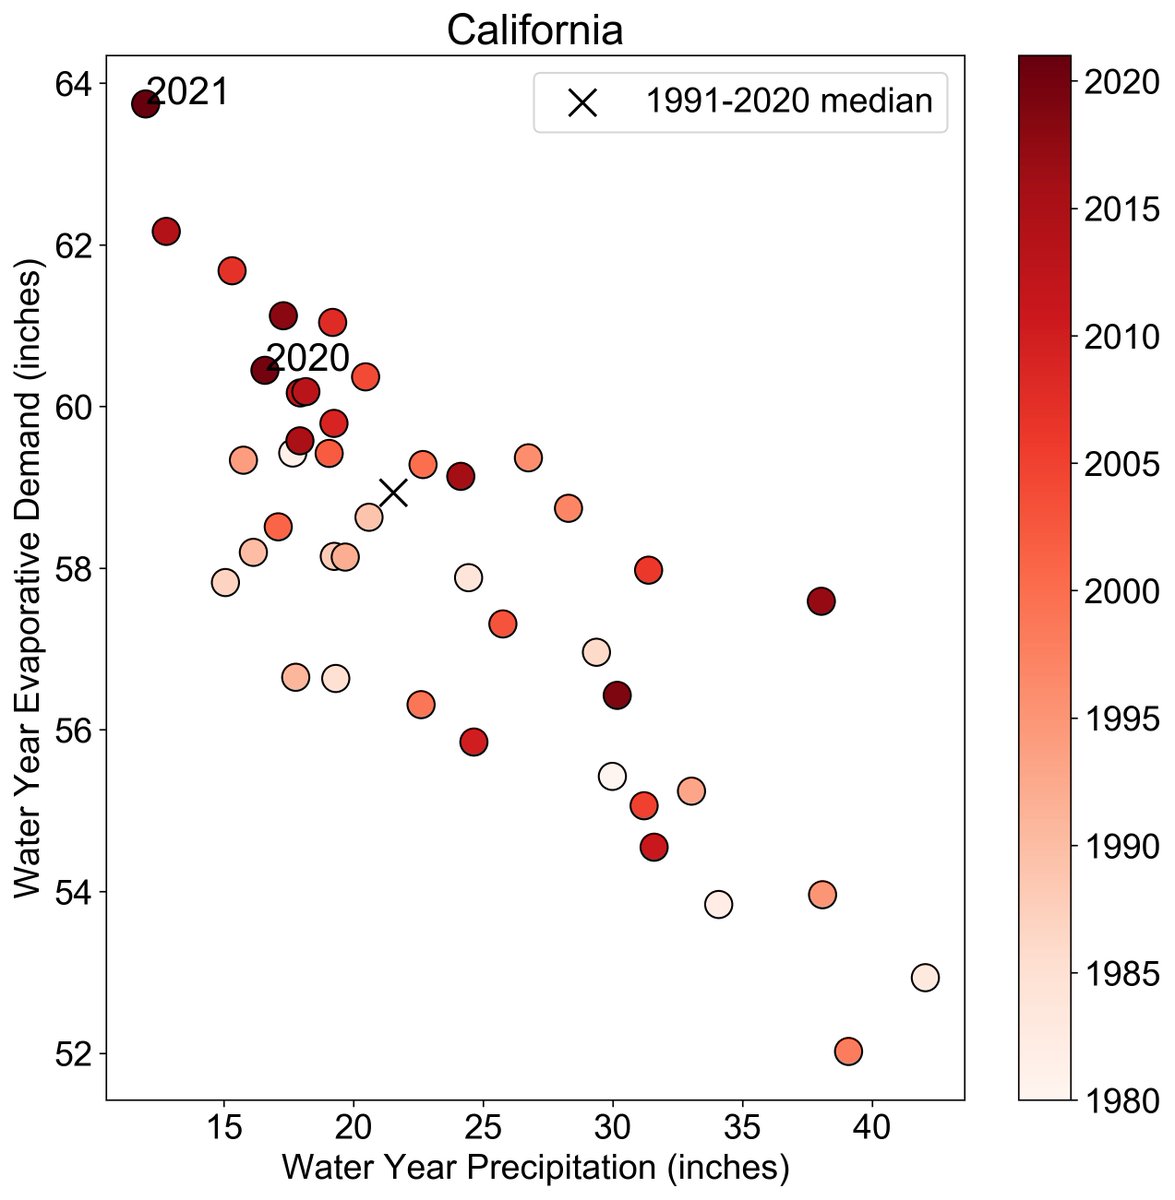
ALT California Statewide. Precipitation for 3-month periods ending in June.
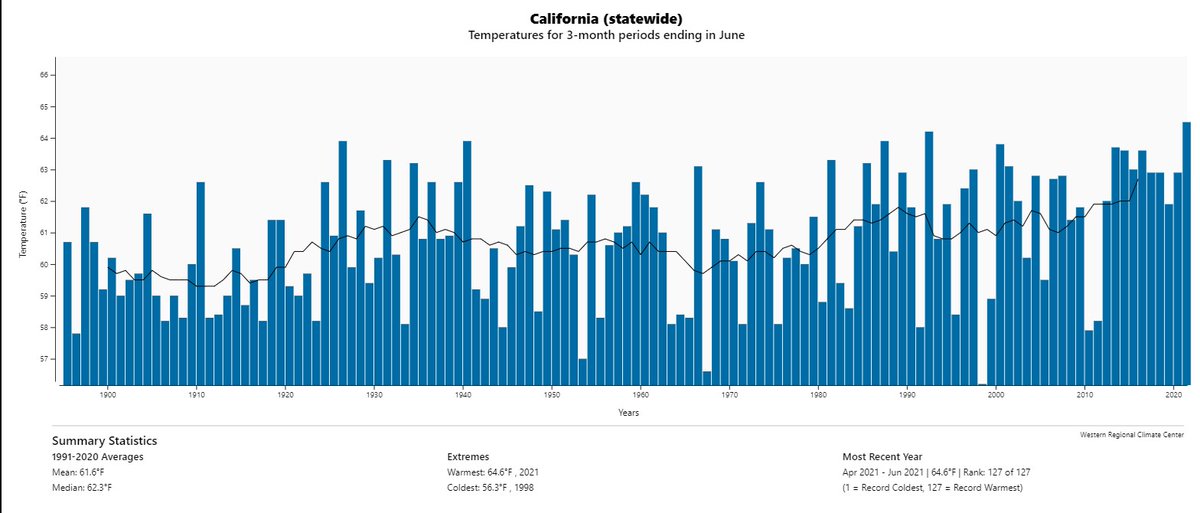
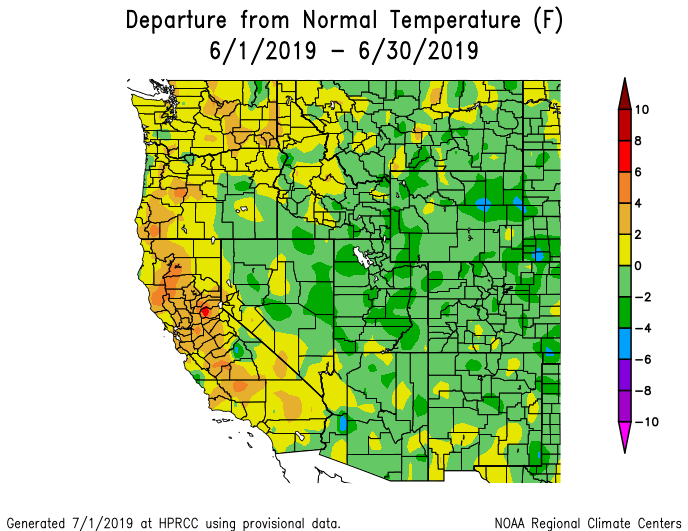
ALT California statewide. Temperature for 3 month periods ending in June.