
The Midwestern Regional Climate Center provides high-quality climate data and value-added tools for our nine-state Midwest region. Located at Purdue University.
- Tweets 2,924
- Following 341
- Followers 3,743
- Likes 2,641


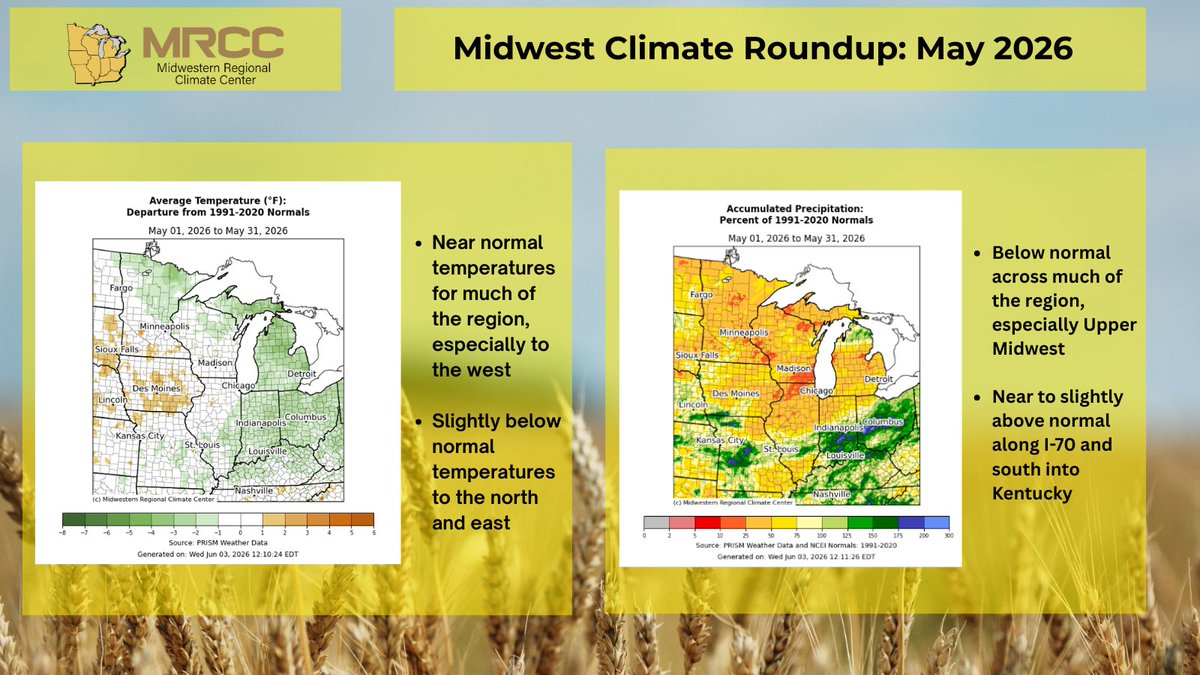


ALT Our May climate summary detailing climatological impacts for the Midwest is out now at the link above.


ALT A person peers at Echo Reservoir in Coalville, Utah. (Credit: GettyImages)

ALT Map of the global temperature percentiles for May 2026 with warmer areas in gradients of red and orange, cooler areas in gradients of blue and gray indicates that it tied with more than 10% of the record.

ALT Map of world showing locations of temperature highlights in May 2026 with text describing each event and title at top stating “Notable Weather and Climate Events: May 2026”.


ALT Extreme Heat Planning Timeline. Pre-Season - Start Planning before hot weather arrives: build an emergency kit, make a plan for power outages, become trained in first aid for heat-related emergencies and check that your air conditioner and fans are in working order. A few days out - If the forecast calls for extreme heat, be ready: gather food, water & medication; make a list of friends and family to check on and help prepare; know your local cooling stations or other cool locations; reschedule outdoor events. During and After - Remain vigilant and stay informed: stay in A/C and out of the sun if possible, check on friends, family, neighbors and pets, drink plenty of water, take breaks and use a buddy system if working outdoors.


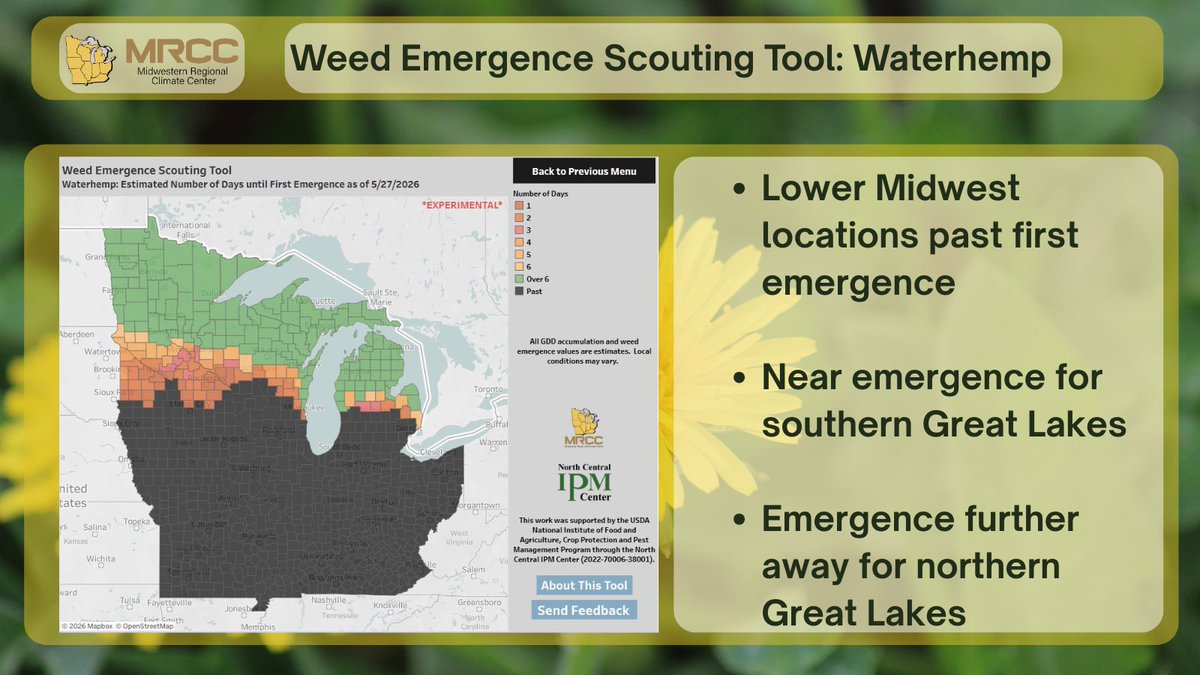
ALT First emergence of Waterhemp across the Midwest from WEST. Upper Great Lakes still over a week away from emergence, while much fo the rest fo the region, shaded in black, red, or orange, is less than a week within or past first emergence.

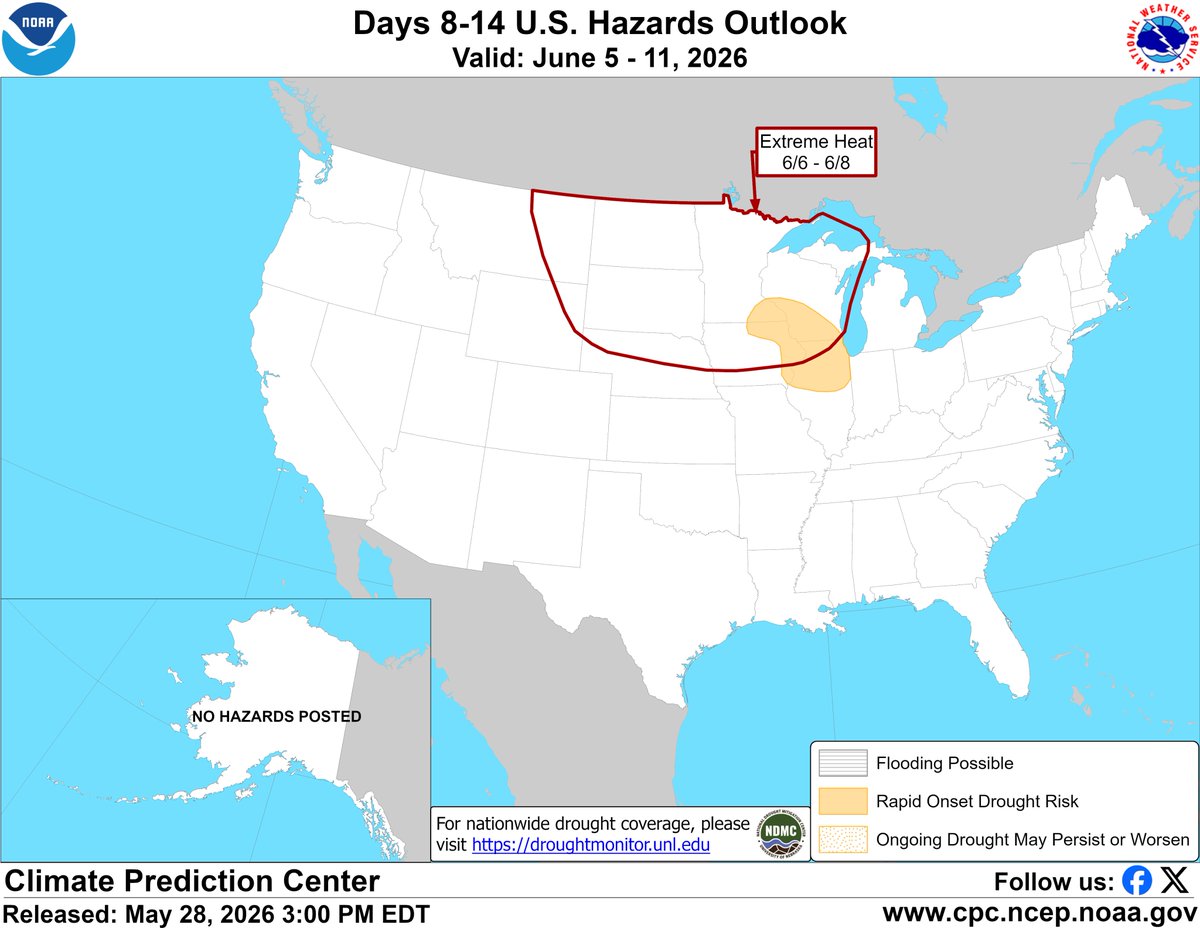
ALT A NOAA Climate Prediction Center map shows the Days 8–14 U.S. Hazards Outlook for June 5–11, 2026, highlighting a large area of "Extreme Heat" across the Northern Plains and Upper Midwest from June 6–8. A smaller, overlapping shaded region indicates a "Rapid Onset Drought Risk" across parts of Minnesota, Iowa, Illinois, and Wisconsin.
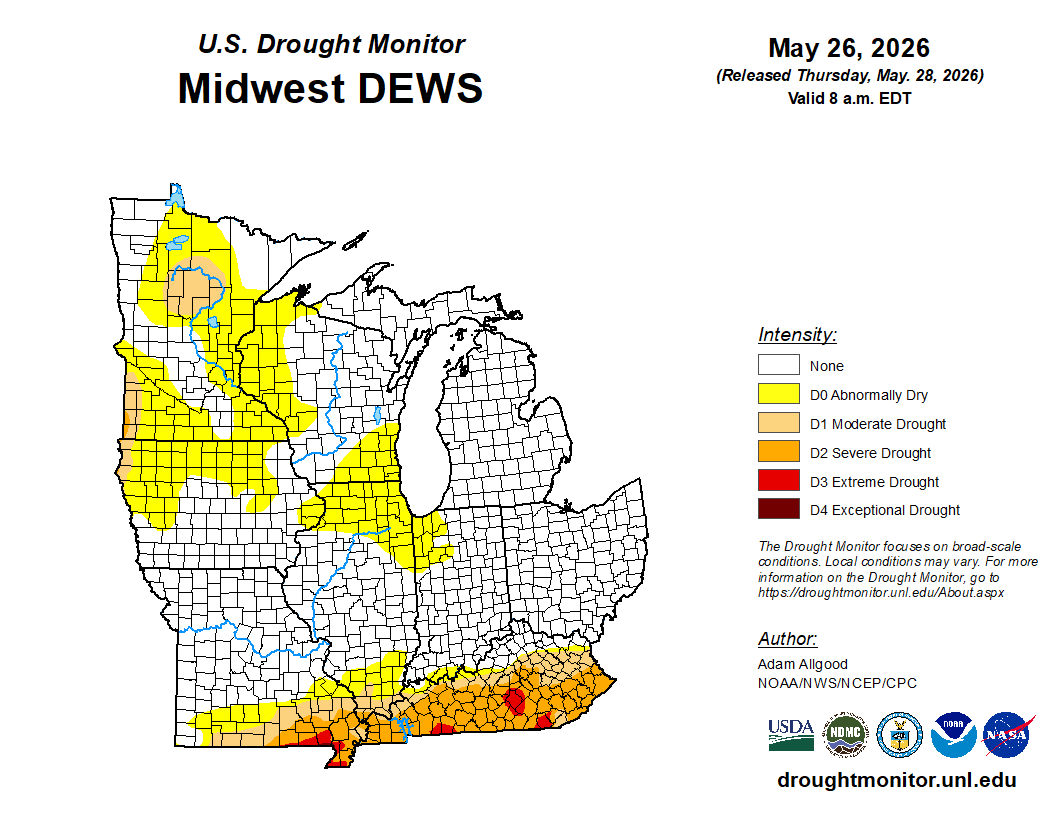
ALT A U.S. Drought Monitor map focusing on the Midwestern United States with data valid through May 26, 2026, showing little drought outside of Kentucky, southern Missouri, and a few pockets in the Upper Midwest.
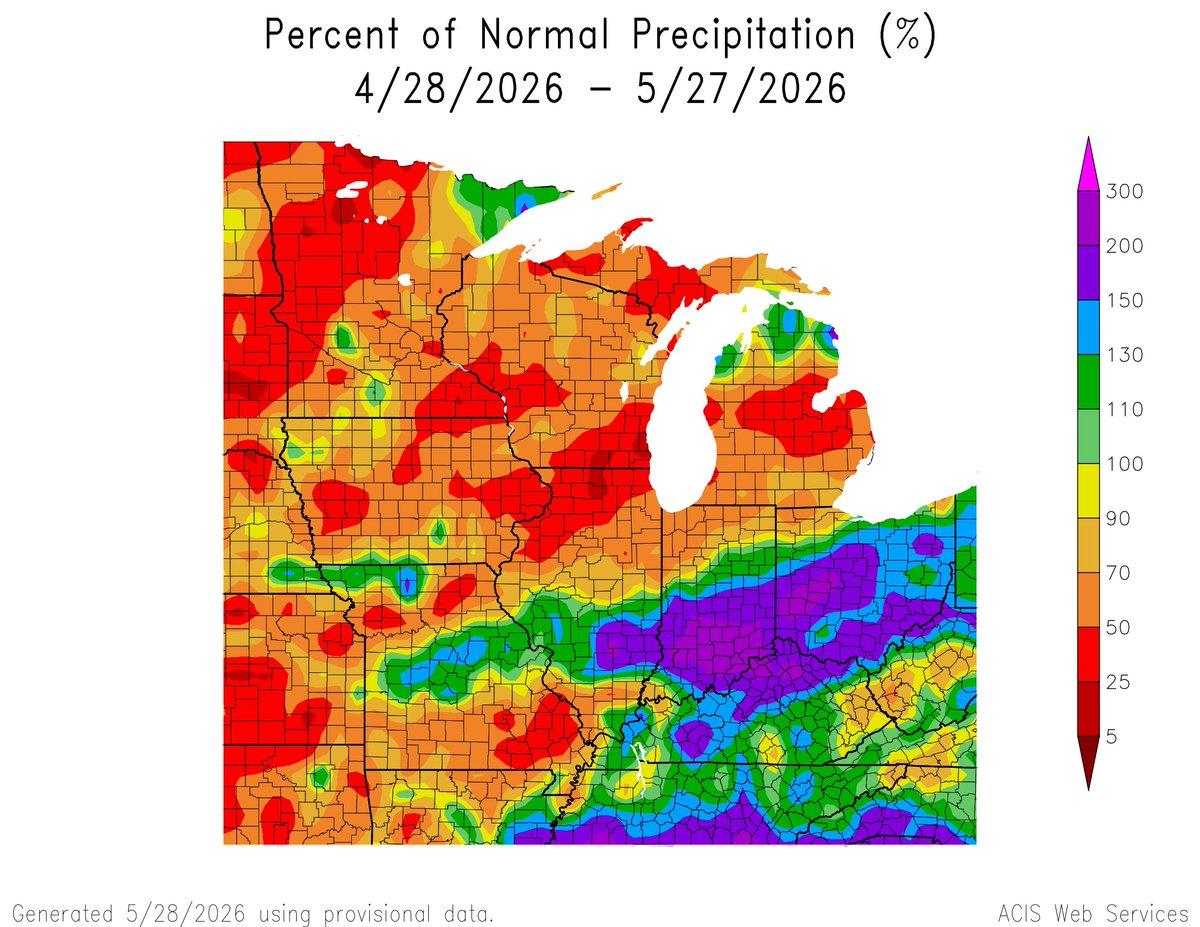
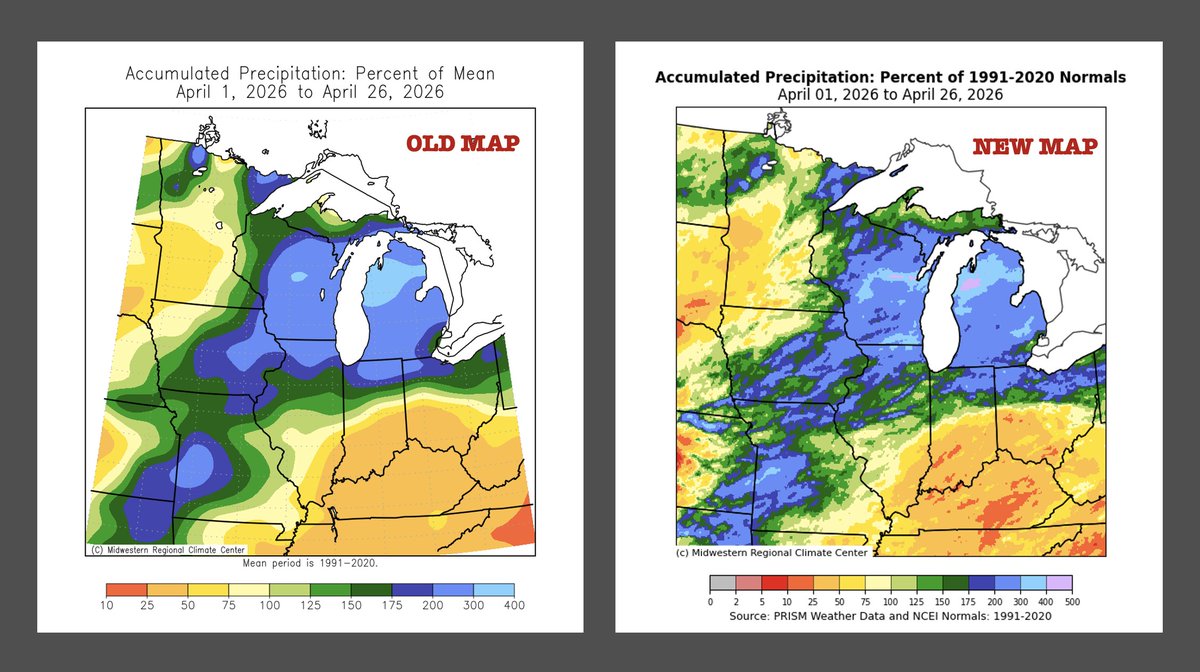
ALT A map of the Midwestern United States shows the percent of normal precipitation from April 28 to May 27, 2026, with a stark contrast between dry northern areas and wet southern regions. While areas like Wisconsin, Michigan, and northern Illinois experienced severe deficits under 50% of normal precipitation, a heavy band stretching across southern Illinois, Indiana, and Ohio received well over 150% to 300% of its normal rainfall.
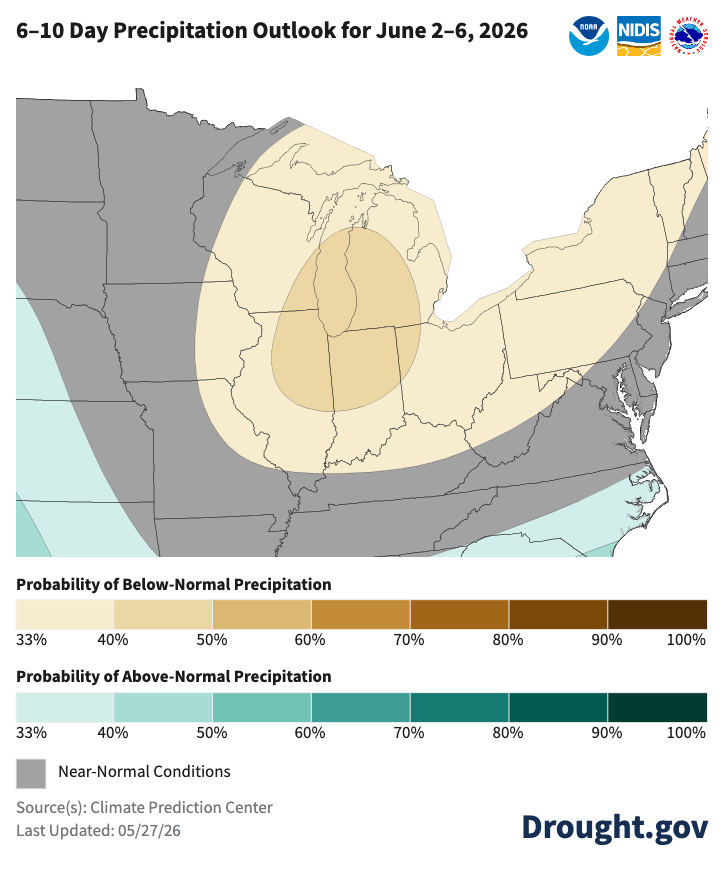
ALT A map of the Midwest showing the NOAA 6-10 Day Precipitation Outlook valid for June 2–6, 2026. Below-normal precipitation is expected for much of the Great Lakes/Midwest region.


ALT Helping Others: Extreme Heat. Never leave anyone (or pets) alone in a locked car. Monitor others exercising or playing sports, ensuring frequent breaks. Bring water to outdoor activities to keep everyone hydrated.
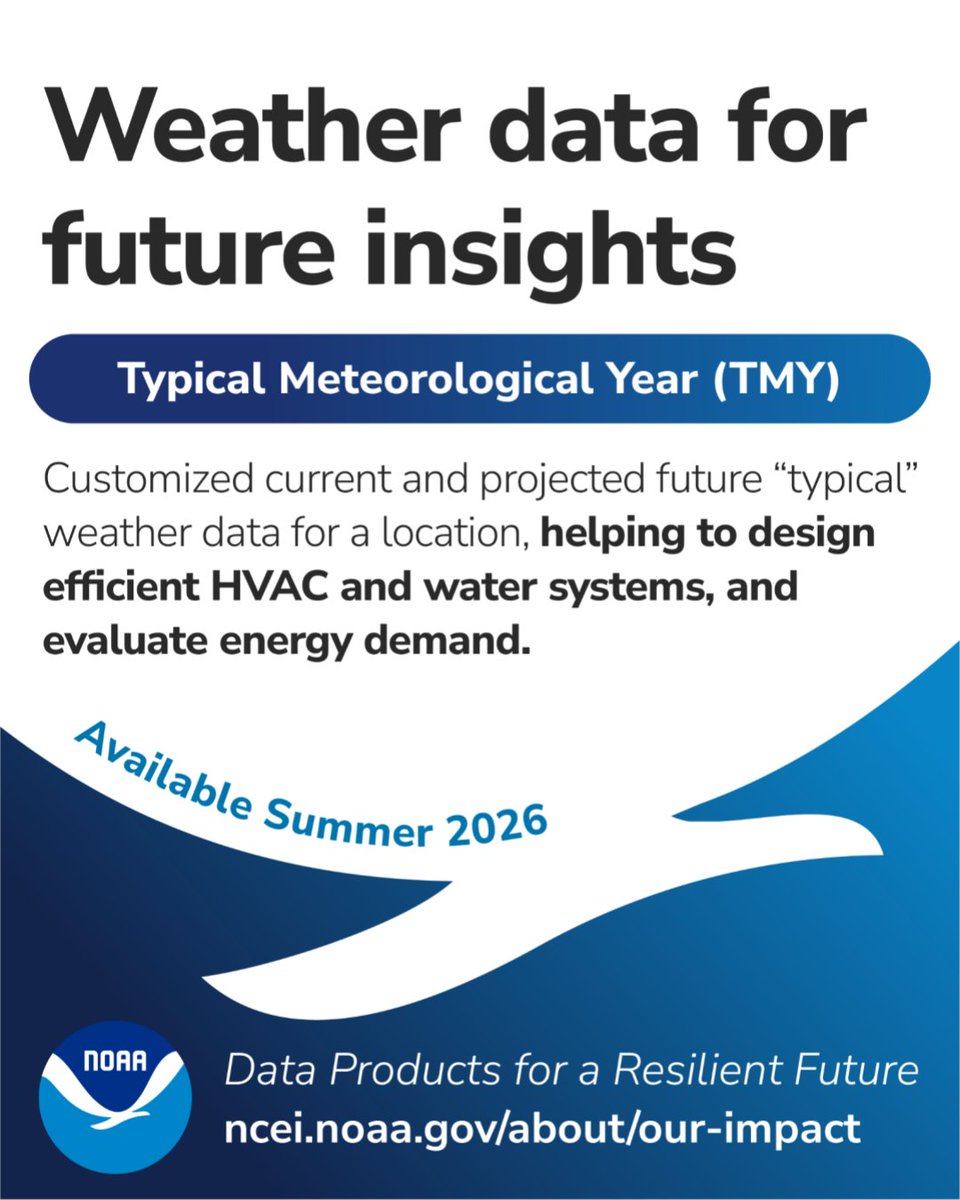
ALT Image that resembles the NOAA logo that reads “Weather data for future insights - Typical Meteorological Year (TMY) - Customized current and projected future “typical” weather data for a location, helping to design efficient HVAC and weather systems, and evaluate energy demand. - Available Summer 2026 - Data Products for a Resilient Future”. A link to NCEI’s “Our Impact” page is provided and the NOAA logo is in the left hand corner.