
Chartner analysiert. Du entscheidest. Keine Finanzberatung – nur klare Linien. Chartner analyzes. You decide. No financial advice – just clear structure
Joined April 2025
- Tweets 107
- Following 24
- Followers 25
- Likes 18
46 Photos and videos


15 Jul 2025
🇩🇪
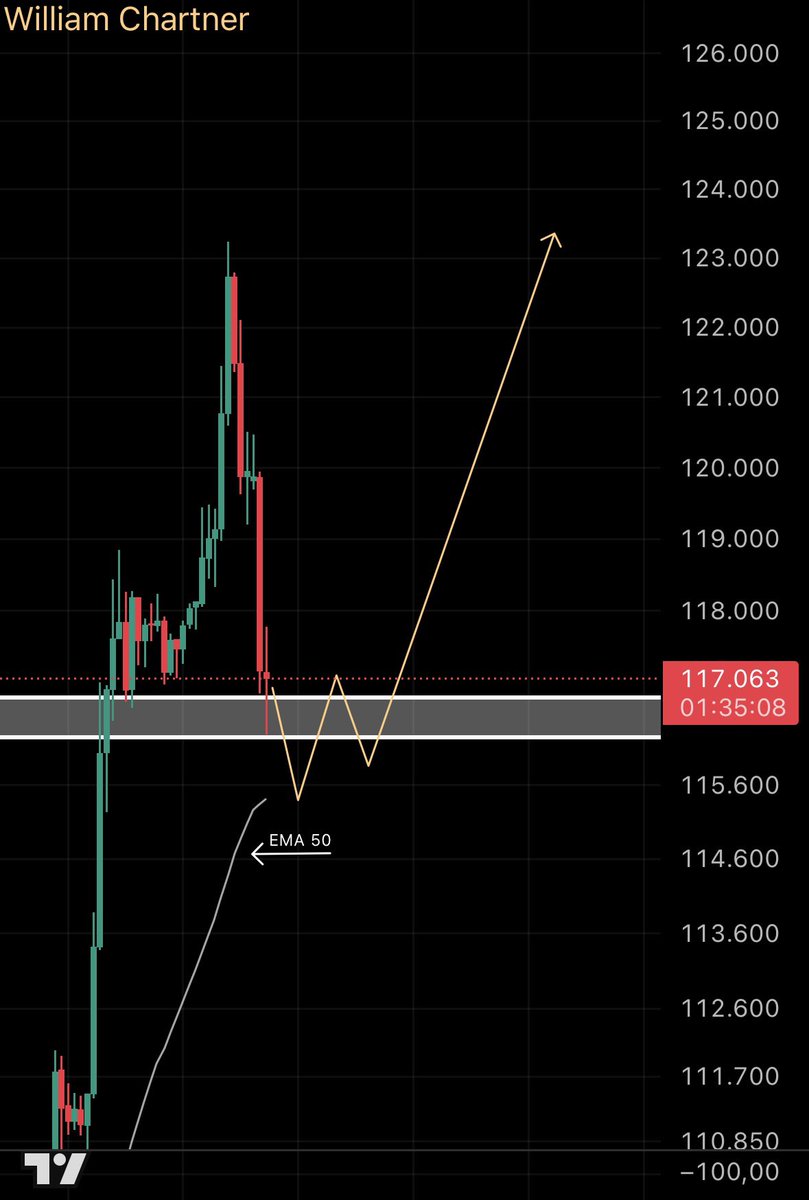
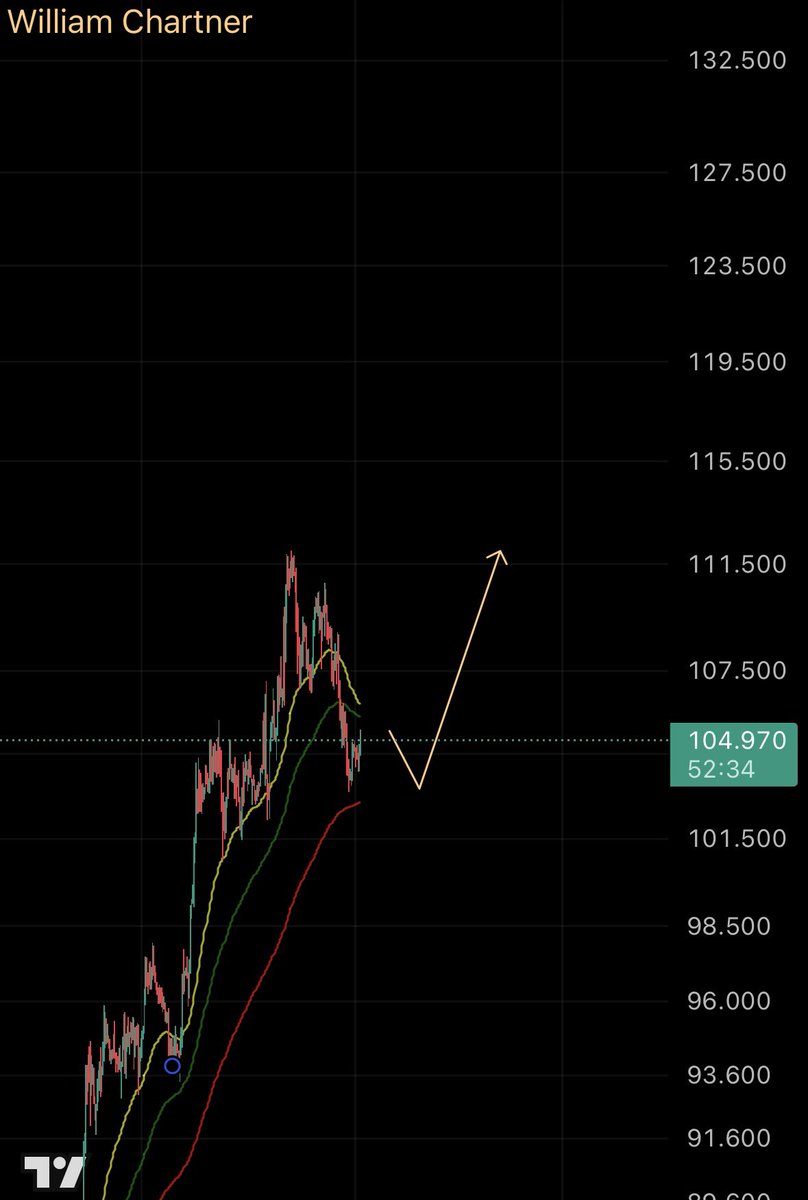
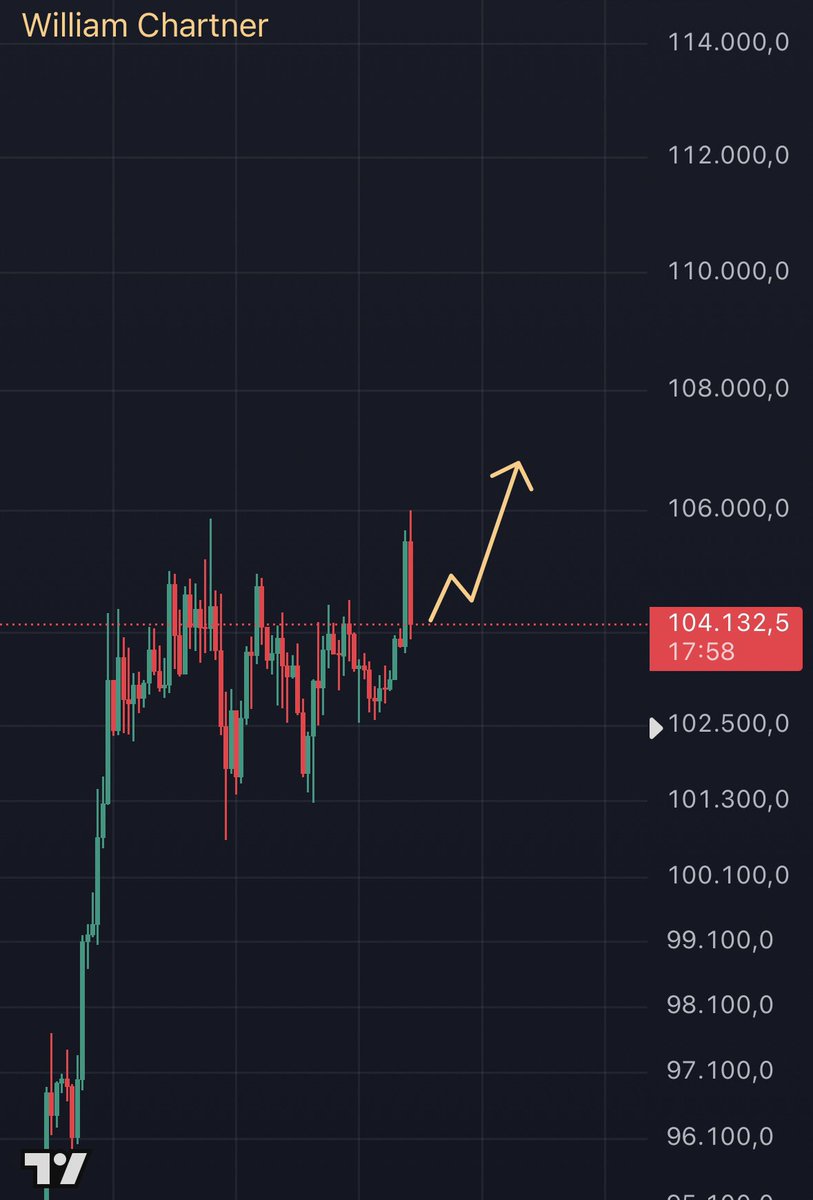
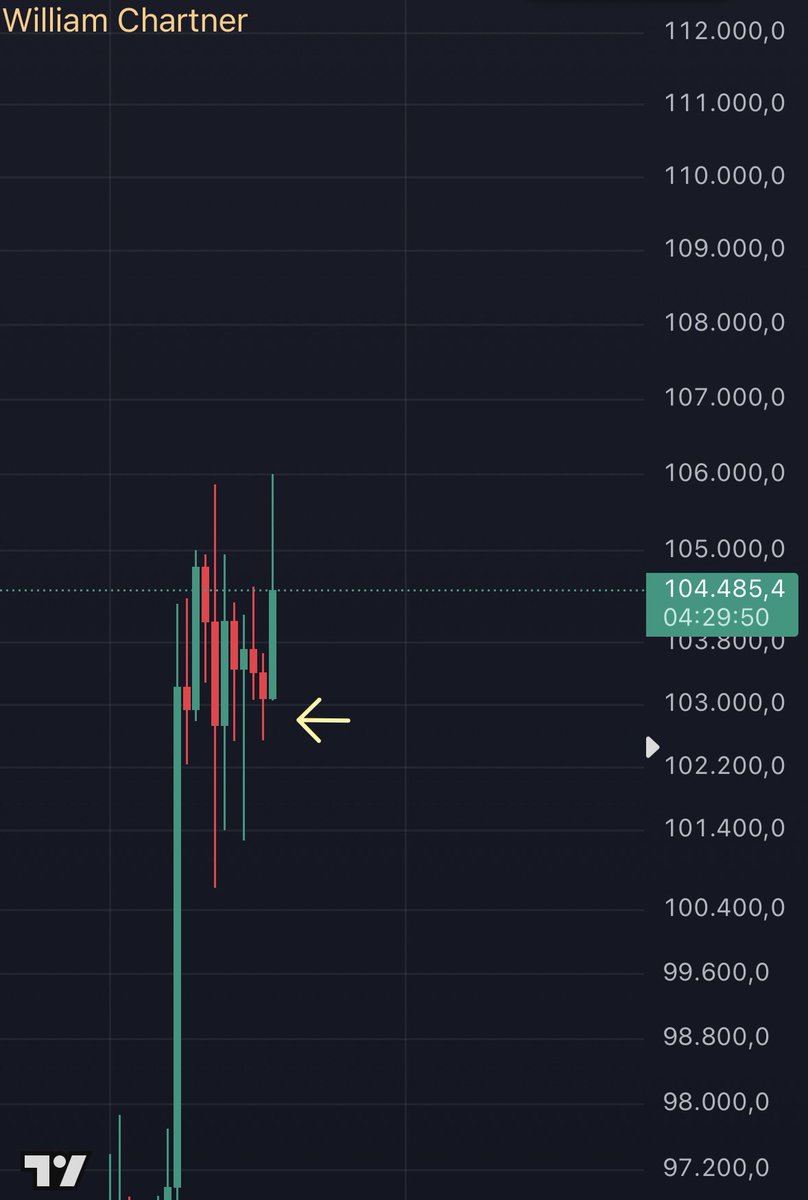
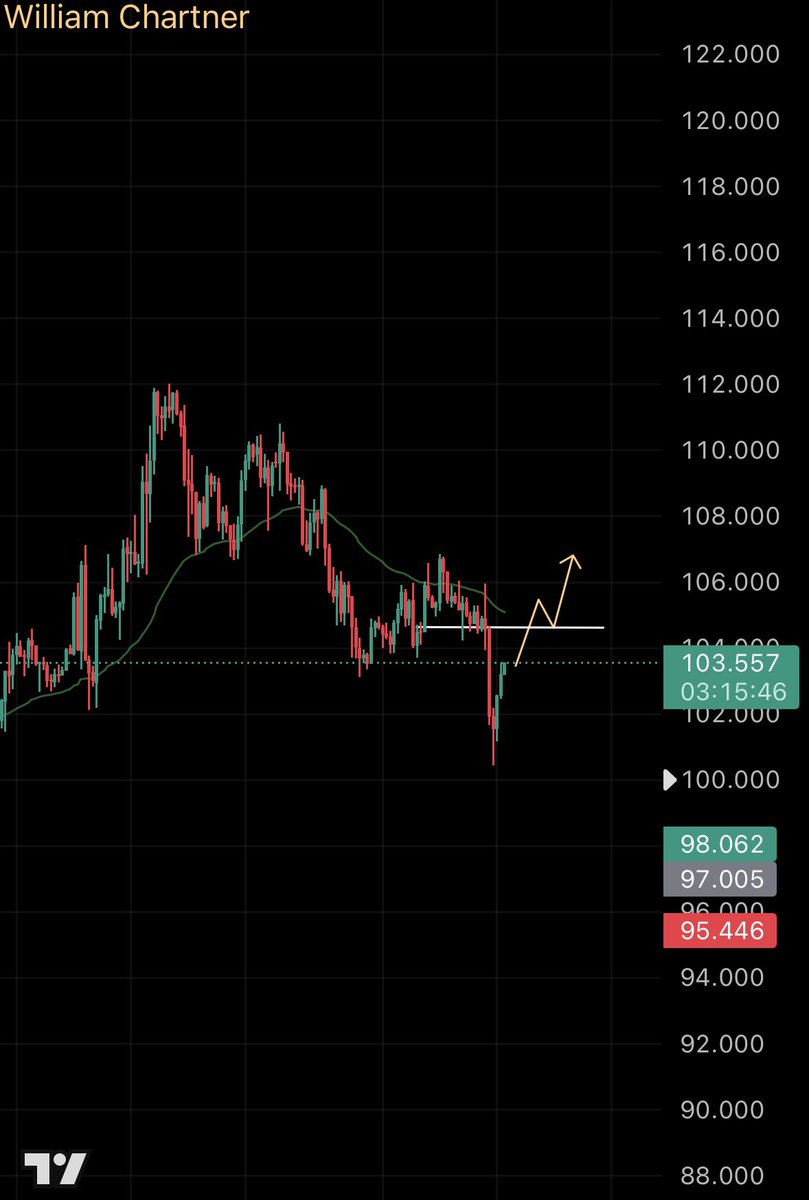
Bitcoin korrigiert nach dem Ausbruch. Aktuelles Traumszenario: Retest des grauen Bereichs, Aufbau von Struktur, dann Push auf neue Hochs.
EMA 50 im Blick.
Struktur. Kontext. Kontrolle. William Chartner liefert.
#BTC #Bitcoin #Trading #Chartanalyse #Krypto #Struktur #WilliamChartner
Keine Finanzberatung
🇬🇧
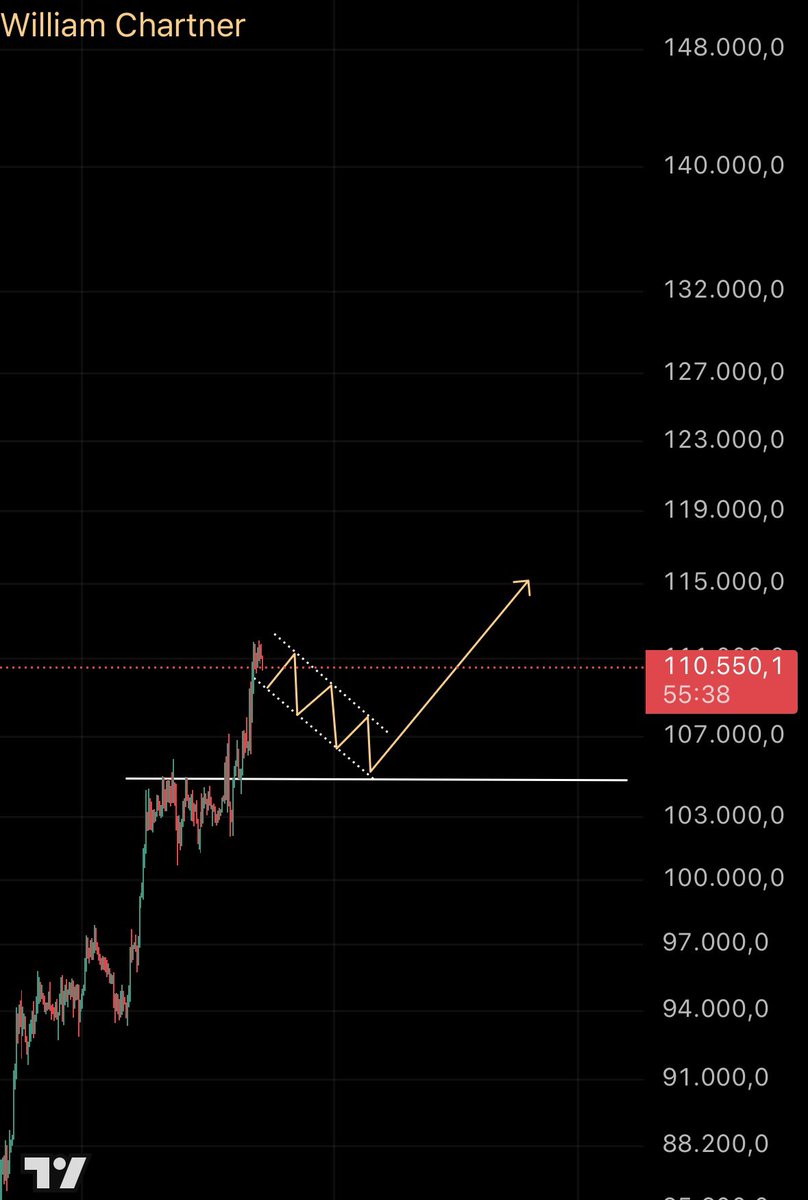
Bitcoin corrects after the breakout. Ideal scenario: retest of the grey zone, build-up of structure, then push to new highs.
EMA 50 in focus.
Structure. Context. Control. William Chartner delivers.
#BTC #Bitcoin #Crypto #Trading #TA #Structure #WilliamChartner
Not financial advice
4
164
9 Jul 2025
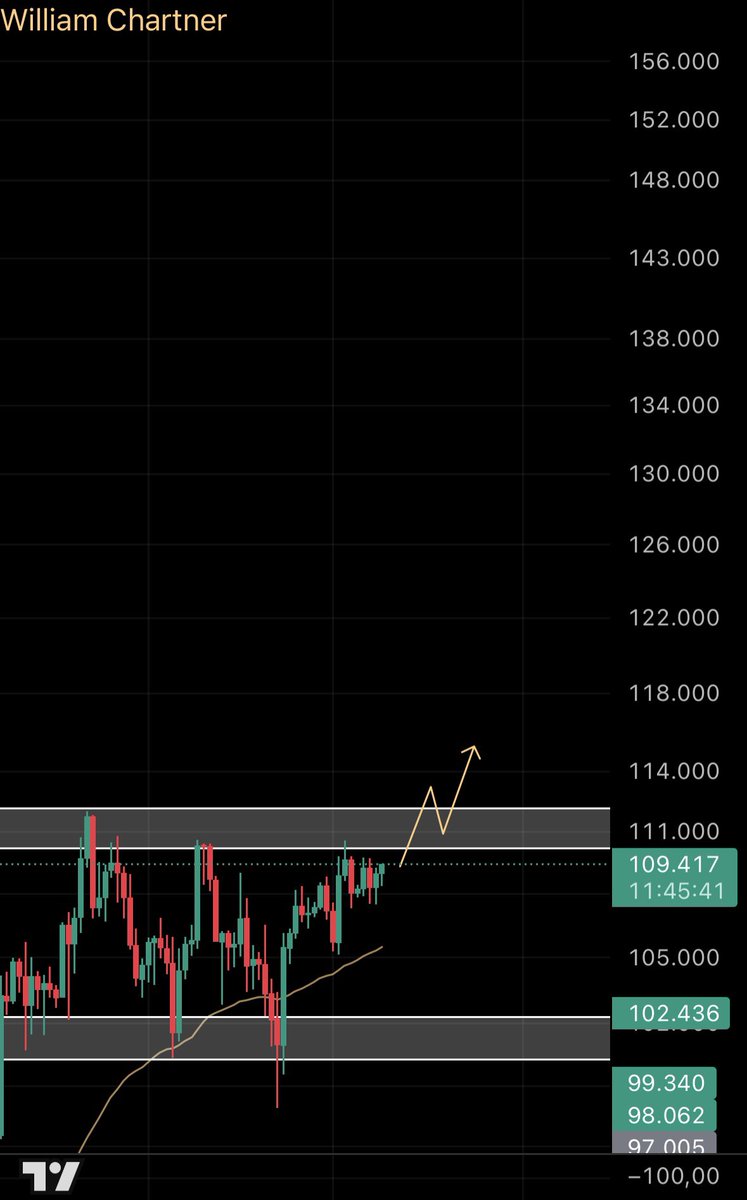
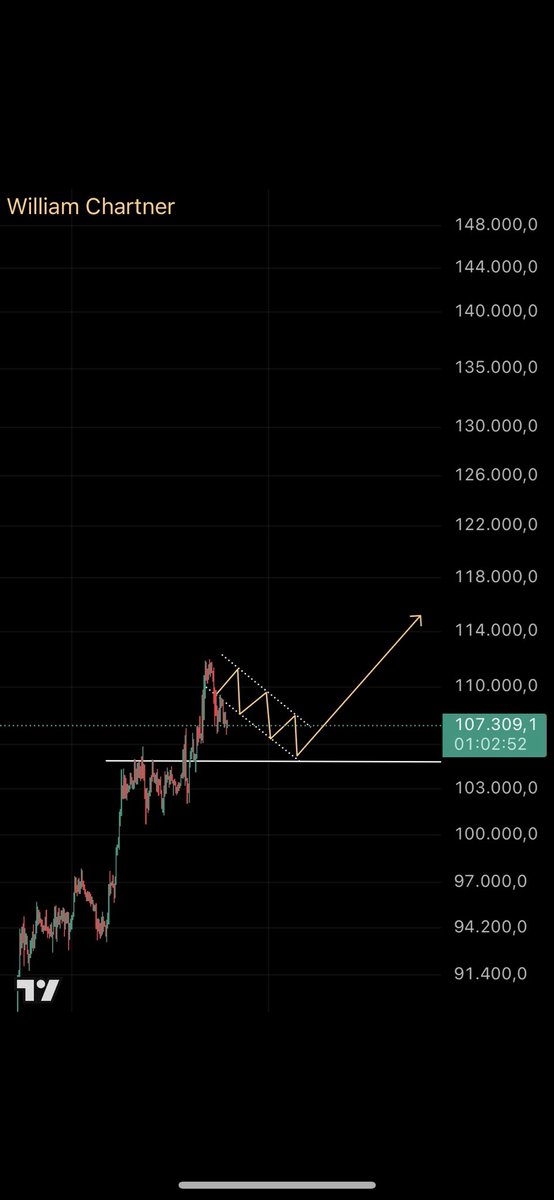
BTC drückt sich weiter an den oberen Rand der Range.
Ein Breakout mit kurzem Pullback könnte den Weg in Richtung 114–115k freimachen.
Das wäre das ideale Bullenszenario.
Struktur. Kontext. Kontrolle. William Chartner liefert.
BTC continues to push toward the top of the range.
A breakout with a short pullback could open the door toward 114–115k.
That would be the ideal bullish scenario.
Structure. Context. Control. William Chartner delivers.
Hashtags:
#Bitcoin #BTC #Crypto #Trading #Breakout #TechnicalAnalysis #WilliamChartner #BTCUSD
3
101
22 Jun 2025
📌Chartner-Sonntagsupdate📌
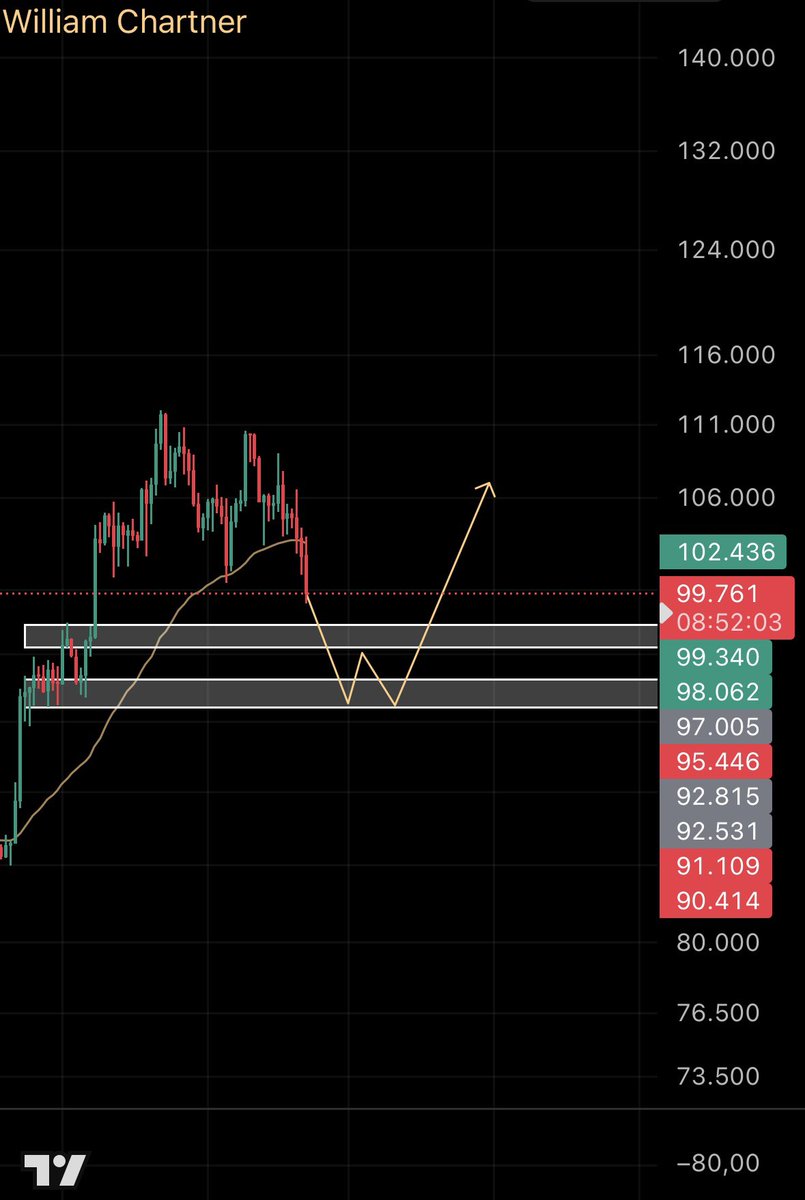
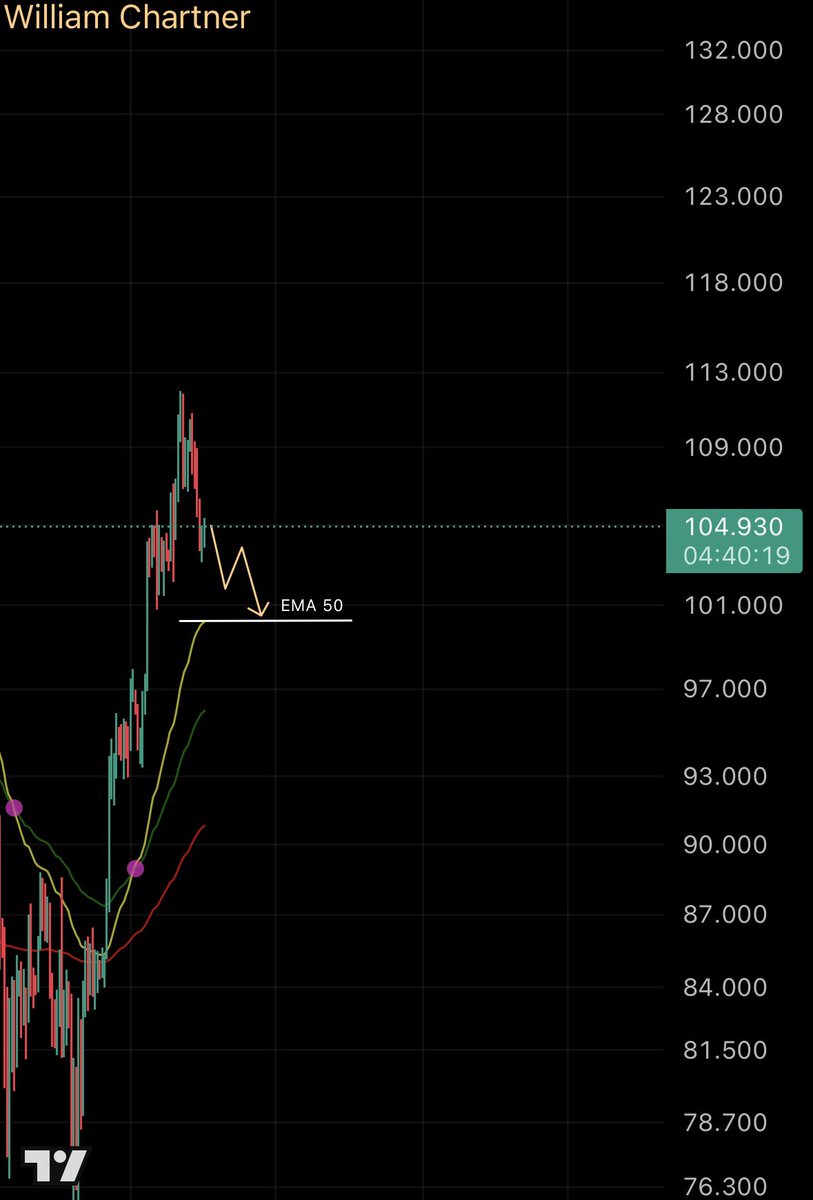
Bitcoin fällt unter die EMA50 im Tageschart.
Zwischen 96.000 und 98.000 liegt eine wichtige strukturelle Zone.
Dort beobachten wir den Preis auf mögliche Reaktionen für Long-Einstiege.
Bleibt der Druck bestehen, rückt ein tieferes Level um 92.000 in den Fokus.
#btc #bitcoin #chartner #trading #preiszone #struktur #sonntagsupdate
📌Chartner Sunday Update📌
Bitcoin has dropped below the daily EMA50.
A key structural zone lies between 96,000 and 98,000.
We are watching for reactions here to consider long entries.
If pressure continues, the 92,000 level may come into focus.
#btc #bitcoin #chartner #trading #pricezone #structure #sundayupdate
1
2
130
15 Jun 2025
📌 Chartner Sonntagsupdate
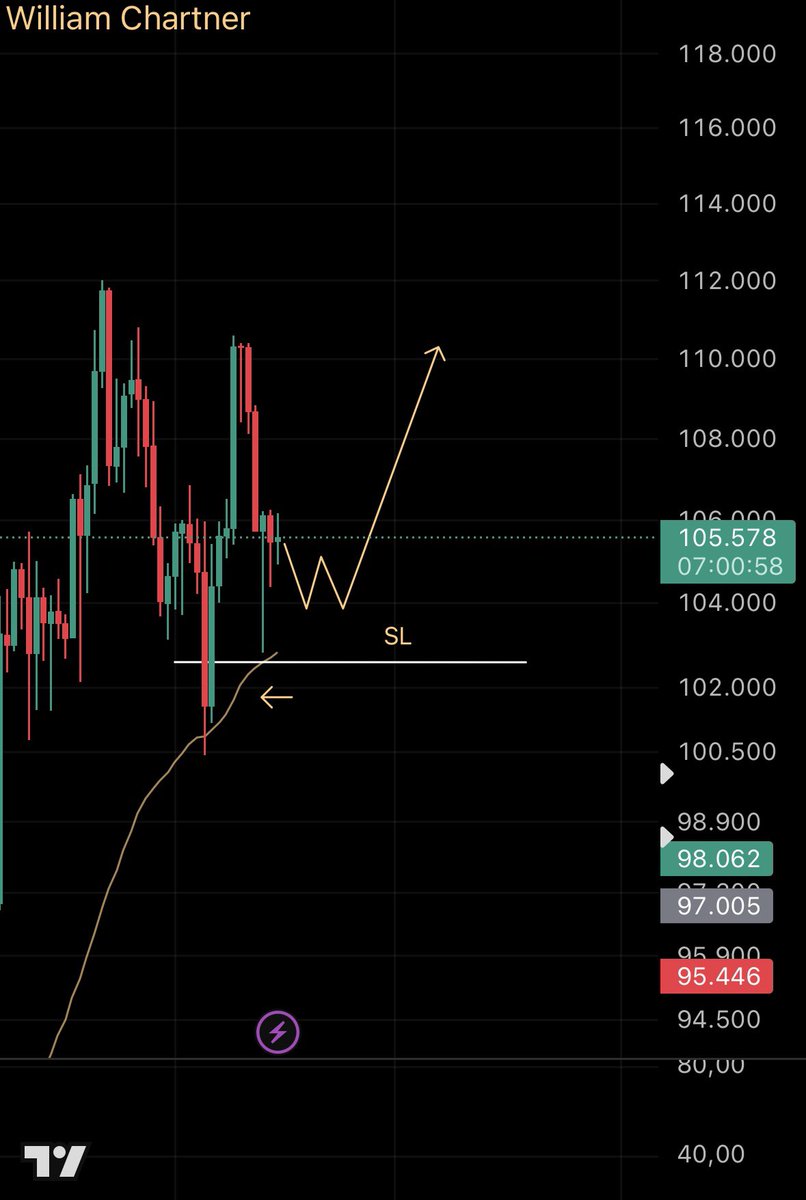
BTC testete die EMA 50 auf dem Tageschart und hält sich stabil.
Noch ist alles offen, aber technisch spricht aktuell nichts gegen ein Long-Szenario.
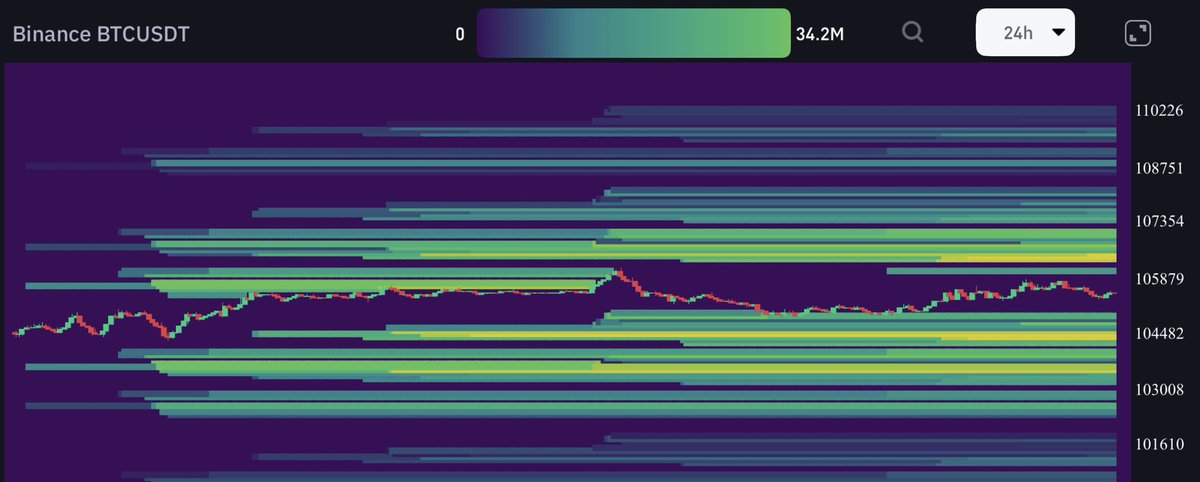
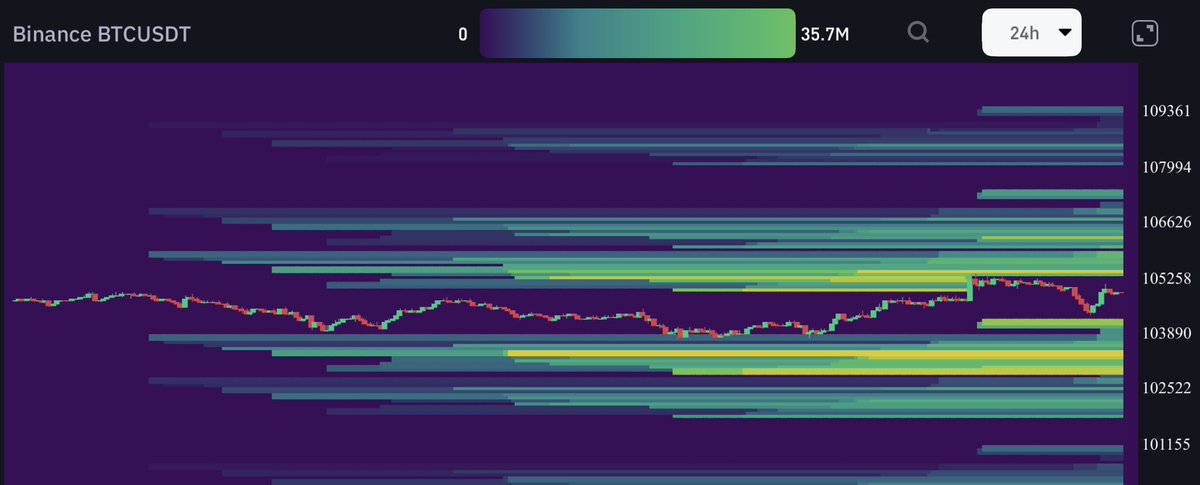
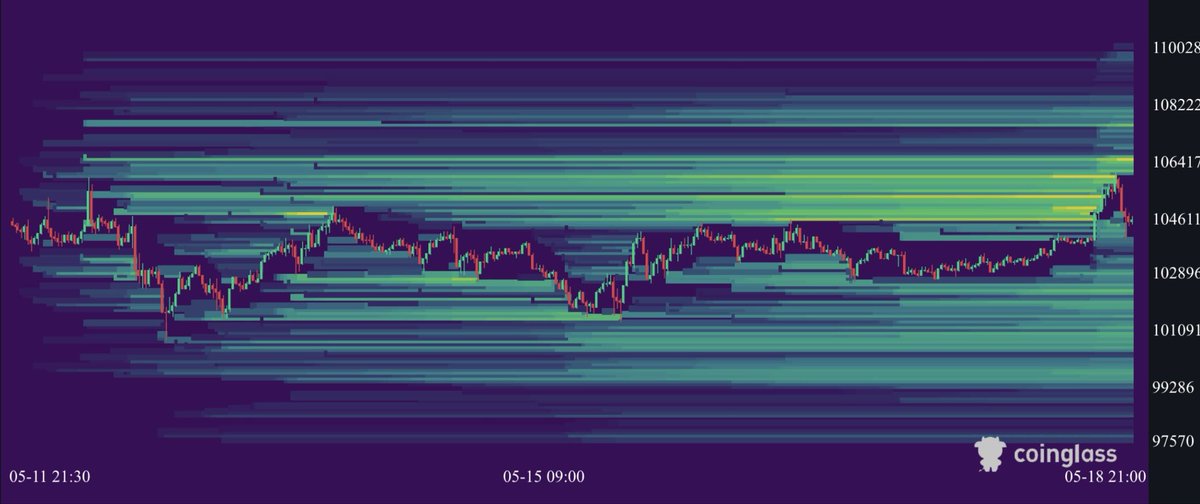
Die 24h Heatmap zeigt unterhalb eine Zone bei 103400, die vor dem Ausbruch noch abgeholt werden könnte.
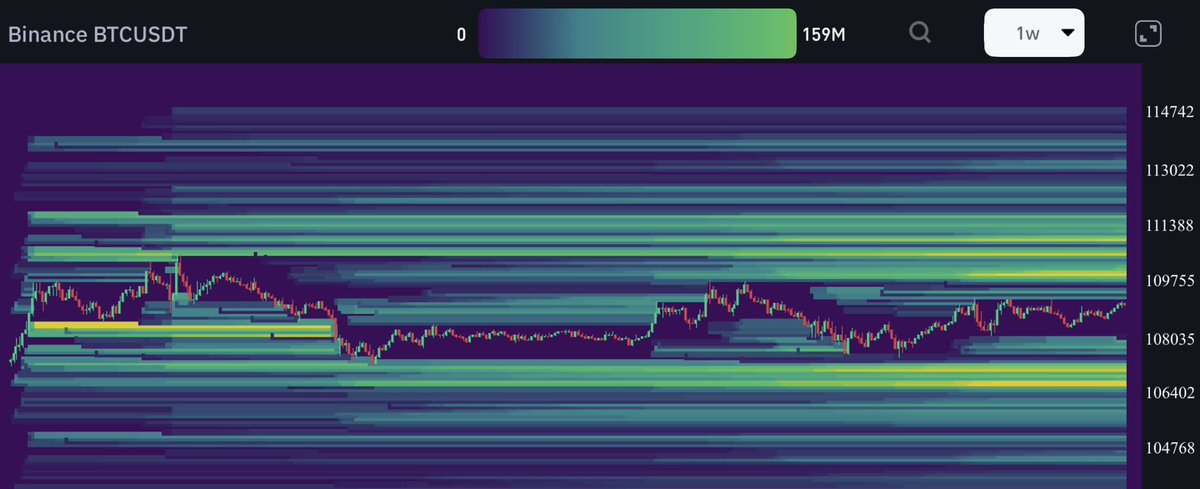
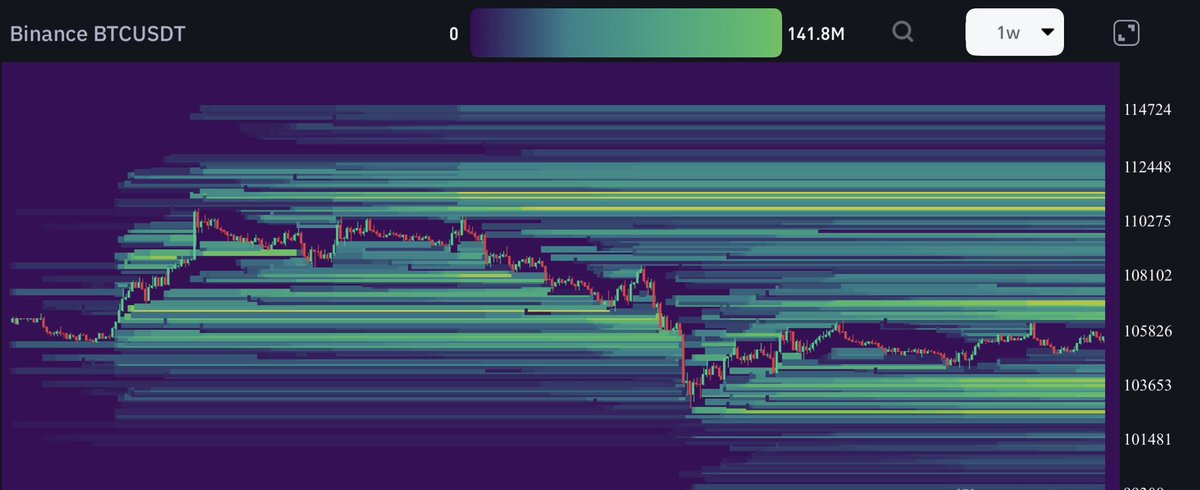
Auf der 1W Heatmap bleibt die Zone um 110000 das übergeordnete Ziel.
Ein Stop unter dem letzten Tief bleibt dabei sinnvoll.
📌 Chartner Sunday Update
BTC tested the EMA 50 on the daily chart and is holding steady.
Technically, there is no reason to fade the long idea just yet.
The 24h heatmap shows liquidity below around 103400 that could get swept first.
The 1W heatmap still shows a clear target zone around 110000.
A stop below the recent low makes sense in this setup.
Struktur. Kontext. Kontrolle. William Chartner liefert.
Keine Finanzberatung. Not financial advice.
#williamchartner #btcupdate #chartnerblick #heatmapanalysis #tradingstrategie #btcsetup #SundayUpdate
1
4
143
8 Jun 2025
Chartner Sonntagsupdate
Der Plan bleibt klar. BTC steht knapp unter 106.800. Dort liegt laut Heatmap frische Liquidität.
Ein kurzer Squeeze darüber bleibt möglich. Wird die Zone mit Volumen überschritten, wären 108.800 bis 110.000 erreichbar.
Scheitert der Ausbruch, bleibt 100.500 die erste Zielzone für Shorts.
Chartner Sunday Update
No major change. BTC sits just below 106800. Fresh liquidity is visible on the heatmap.
A quick squeeze is possible. If the level breaks with momentum, targets around 108800 to 110000 become realistic.
If rejected, 100500 remains a key short target.
Struktur. Kontext. Kontrolle. William Chartner liefert.
Keine Finanzberatung. Not financial advice.
#williamchartner #btcupdate #chartnerblick #heatmapanalysis #tradingstrategie
2
121
6 Jun 2025
1/3
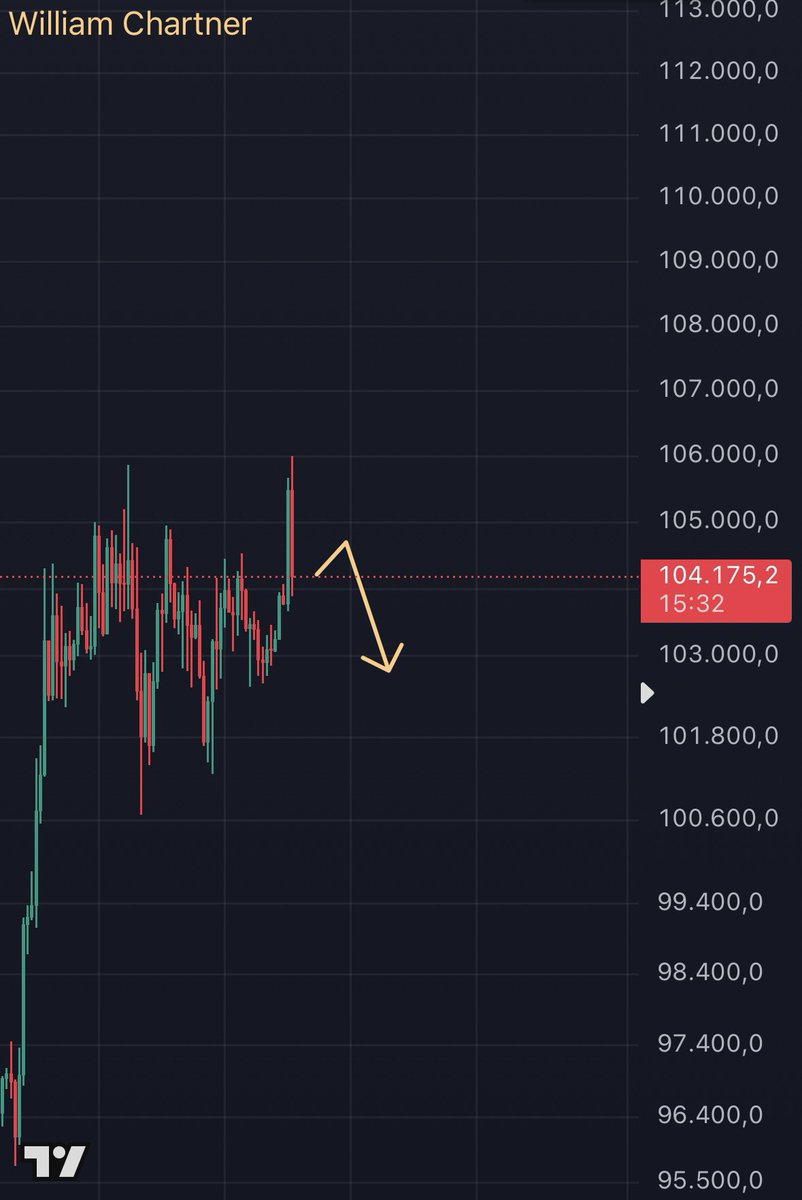
BTC steht aktuell an einer entscheidenden Zone zwischen 103.800 und 104.500.
Wird sie abgelehnt, droht ein Rücksetzer unter 100k mit Zielrichtung 98.600 bis 96.600.
Kommt der Ausbruch, ist ein Anlauf auf 106.000 bis 106.800 denkbar. Doch genau dort lauert technischer Widerstand.
Erst ein klarer Durchbruch über 106.800 würde den Weg in Richtung 110k freimachen.
BTC is currently at a critical zone between 103,800 and 104,500.
If rejected, a drop below 100k targeting 98,600 to 96,600 becomes likely.
A breakout could lead toward 106,000 to 106,800. But this zone still acts as technical resistance.
Only a clean move above 106,800 opens up structural space toward 110k.
Keine Finanzberatung. Nur persönliche Marktbeobachtung. Eigene Recherche unerlässlich. Keine Aufforderung zum Handel.
Not financial advice. Just personal market observation. Do your own research. No trading recommendation.
#williamchartner #btcusdt #liquiditytrading #heatmapanalysis #btcupdate #tradingstrategie #chartnerblick
1
1
5
100
6 Jun 2025
2/3
Die 3d Heatmap zeigt frische Liquidität direkt über dem Kurs, besonders zwischen 104.700 und 106.800.
Unterhalb sehen wir aktuell nur vereinzelt Zonen, zum Beispiel um 100.700.
Der Bereich zwischen 98.600 und 96.600 bleibt strukturell interessant, ist aber auf der Heatmap derzeit nicht aktiv sichtbar.
Die 24h Heatmap bestätigt das Bild die Oberseite ist kurzfristig stärker geladen.
The 3d heatmap reveals fresh liquidity directly above price, especially between 104,700 and 106,800.
Below, we currently only see scattered zones, such as near 100,700
The range between 98,600 and 96,600 remains structurally relevant, but does not show up actively on the heatmap.
The 24h heatmap confirms this view the upside is more loaded in the short term.
Keine Finanzberatung. Nur persönliche Marktbeobachtung. Eigene Recherche unerlässlich. Keine Aufforderung zum Handel.
Not financial advice. Just personal market observation. Do your own research. No trading recommendation.
#williamchartner #btcusdt #liquiditytrading #heatmapanalysis #btcupdate #tradingstrategie #chartnerblick

1
4
85
6 Jun 2025
3/3
Short-Szenario: Fällt BTC unter 103.000, wäre 100.469 ein möglicher Reaktionsbereich.
Wird dieser gebrochen, rücken 98.600 bis 96.600 in den Fokus.
Long-Szenario: Ein Ausbruch über 104.500 könnte 106.800 ansteuern. Doch dieser Bereich bleibt kritisch.
Erst oberhalb von 106.800 wird der Weg in Richtung 110k technisch freier.
Short scenario: If BTC falls below 103,000, the 100,469 zone may offer a reaction.
If that breaks, 98,600 to 96,600 become the next focus.
Long scenario: A breakout above 104,500 could target 106,800. But this zone remains critical.
Only above 106,800 does the path toward 110k become structurally cleaner.
Keine Finanzberatung. Nur persönliche Marktbeobachtung. Eigene Recherche unerlässlich. Keine Aufforderung zum Handel.
Not financial advice. Just personal market observation. Do your own research. No trading recommendation.
#williamchartner #btcusdt #liquiditytrading #heatmapanalysis #btcupdate #tradingstrategie #chartnerblick
1
3
67
1 Jun 2025
1/2
Bitcoin bewegt sich weiterhin in einer breiten Range. Der Rücksetzer auf rund 103k war technisch sinnvoll und hat Liquidität abgeholt. Jetzt stellt sich die Frage, ob wir hier ein höheres Tief sehen oder ob der Markt noch einmal tiefer will.
Unter dem aktuellen Preis liegen auf der 24h Heatmap mehrere Liquiditätscluster, vor allem im Bereich zwischen 102000 und 103000. Dort könnte sich ein Long bei Bestätigung lohnen.
Über dem Markt liegt rund um 106000 Short-Liquidität. Auf der 1W Heatmap sehen wir zusätzlich markante Zonen oberhalb von 110000. Der Markt ist also nach beiden Seiten geladen.
#btc #bitcoin #trading #heatmap #chartanalyse #liquidität #williamchartner #sundayupdate
Bitcoin continues to trade within a broad range. The pullback to around 103k was technically reasonable and collected liquidity. Now the question is whether we are forming a higher low or if the market wants to dip lower again.
Below the current price we see multiple liquidity clusters on the 24h heatmap especially around the 102000 to 103000 area. A long could be considered there if confirmation appears.
Above the market there is short liquidity around 106000. The 1W heatmap also shows significant zones above 110000. The market is charged in both directions.
#btc #bitcoin #trading #heatmap #liquidity #chartanalysis #williamchartner #sundayupdate
1
2
93
1 Jun 2025
2/2
Ein Long bietet sich an wenn BTC bei 103000 Halt findet und sich dort Stärke zeigt. Auch ein Bruch über 106000 mit klarer Reaktion nach oben wäre ein mögliches Setup.
Shorts bleiben eine Option falls 103000 fällt. Dann rückt die EMA 50 im Tageschart bei rund 100000 in den Fokus. Ein Bereich den viele beobachten und der auch psychologisch eine Rolle spielt.
#btc #bitcoin #tradingstrategie #marktstruktur #liquidität #williamchartner #SundayUpdate
A long makes sense if BTC holds around 103000 and shows strength there. A breakout above 106000 with a clear reaction to the upside would also be a valid setup.
Shorts remain on the table if 103000 fails. Then the EMA 50 on the daily chart around 100000 comes into focus. A level watched by many and psychologically important.
#btc #bitcoin #tradingstrategy #marketstructure #liquidity #williamchartner #sundayupdate
3
61
25 May 2025
1/2
Chartner-Sonntagsupdate
Der Rücksetzer kam wie erwartet.
Heatmap-Liquidität bei 105 bis 106k wurde sauber abgeholt.
BTC stabilisiert sich seither innerhalb der Struktur.
Ein mögliches Higher Low entsteht, doch der klare Impuls lässt noch auf sich warten.
Das bullishe Szenario bleibt intakt, solange 106k hält.
Ein Bruch darunter könnte den Weg Richtung 102k bis 101k öffnen. Diese Zone behalten wir bewusst im Blick.
Aktuell bietet sich ein Long-Szenario mit reduzierter Positionsgröße an.
So bleibt man im Markt und kann dennoch reagieren, falls BTC noch einmal tiefer ansetzt.
Chartner Sunday Update
The pullback played out as expected.
Heatmap liquidity around 105 to 106k was tapped cleanly.
BTC is stabilizing within structure.
A potential Higher Low is forming, but strong momentum is still missing.
The bullish scenario remains valid as long as 106k holds.
A drop below may open space toward 102k to 101k. That zone stays on our radar.
A reduced-size long position may be reasonable here.
It allows for exposure while remaining flexible in case BTC dips lower again.
#Bitcoin #BTC #WilliamChartner #Heatmap #LongSetup #CryptoTrading #Marktstruktur #PriceAction #SundayUpdate
1
4
103
25 May 2025
2/2
Die Heatmap zeigt nach wie vor starke Liquidität oberhalb.
Ein erneuter Angriff auf 110k und darüber hinaus bleibt technisch realistisch.
111 bis 112k ist und bleibt der magnetische Zielbereich.
Struktur. Kontext. Kontrolle. William Chartner liefert.
Heatmap liquidity remains dense above.
A renewed push toward 110k and beyond is still technically realistic.
111 to 112k remains the magnetic upside target.
Structure. Context. Control. William Chartner delivers.
#Bitcoin #BTC #Chartner #CryptoUpdate #BTCUpdate #Heatmap #Marktanalyse #WilliamChartner #SundayUpdate
3
65
23 May 2025
BTC Update
Bitcoin hat ein neues Allzeithoch gesetzt, zeigt aber erste Schwäche im Bereich 111–112k.
Die Heatmap verrät uns, unterhalb liegt klare Liquidität. Ein Rücksetzer Richtung 105–106k wäre nicht nur gesund, sondern könnte auch den optimalen Long-Einstieg liefern.
Ein direkter Ausbruch bleibt dennoch möglich aktuell fehlt dafür jedoch der Vorteil.
Geduldige Trader warten auf den Retest.
BTC Update
Bitcoin just printed a new ATH but shows initial weakness around 111–112k.
Heatmaps reveal strong liquidity below a pullback towards 105–106k would not only be healthy but could offer the perfect long entry.
A breakout from here is still possible but entering now lacks real confluence.
Patience might pay off.
Struktur. Kontext. Kontrolle. William Chartner liefert.
#Bitcoin #BTC #Chartner #PriceAction #CryptoTrading #LongSetup #Pullback #Heatmap
#WilliamChartner
5
109
21 May 2025
1
2
108
18 May 2025
Chartner Sonntagsupdate
Sonntag, Degens, Zeit für ein Chartner-Update.
BTC zeigt Stärke, doch wichtige Zonen bleiben offen.
Der Bereich 106.417 bis 106.800 wirkt laut Weekly-Heatmap weiterhin als starker Magnet – er wurde angespielt, aber nicht überzeugend durchbrochen.
Chartner Sunday update
Sunday, Degens, let’s break it down.
BTC shows strength, but key zones remain unresolved.
The 106,417–106,800 range still acts as a strong magnet on the 1W heatmap – tapped but not clearly broken.
#Bitcoin #BTC #Crypto #Heatmap #SundayUpdate #WilliamChartner
1
3
160
18 May 2025
2/3
Unterhalb von 103.600 liegt ein deutlicher Cluster auf der 24h-Heatmap.
Technisch interessant, die Tageskerze vom 17.05. hinterließ einen Wick bis ca. 102.900 – solche Wicks werden oft zur Hälfte gefüllt, was einen Rücksetzer in diese Zone stützen würde.
Below 103,600 there’s a strong liquidity cluster on the 24h heatmap.
The daily candle from May 17 left a wick down to ~102,900. Historically, wicks like this often get filled halfway – a pullback into that zone would not surprise.
#BTCUpdate #BitcoinAnalysis #Liquidity #SmartMoney #MarketContext #WilliamChartner
1
2
102
18 May 2025
3/3
Bullisch
BTC setzt ein Higher Low zwischen 104.300 und 104.600 und greift erneut die 106.800 an.
Bärisch
Ein Bruch unter 104.300 aktiviert den Cluster bei 103.600 und eröffnet Raum bis 102.900 – dort wäre eine Reaktion interessant.
Bullish
BTC forms a higher low around 104,300–104,600 and targets 106,800 again.
Bearish
Losing 104,300 opens the door to 103,600 liquidity and possibly down to 102,900. That zone could trigger a strong reaction.
Struktur. Kontext. Kontrolle. William Chartner liefert.
Structure. Context. Control. William Chartner delivers.
#BitcoinSetup #BTCScenarios #CryptoTrading #ChartnerUpdate #CryptoAnalysis #SundayUpdate
2
66
16 May 2025
Price consolidating.
Doing the only thing that makes sense,
Waiting and sorting cards.
#Solitaire #Bitcoin #WilliamChartner #Breakout #PriceAction
3
119
16 May 2025
2
1
2
101