
Bitcoin, $MSTR, Chemical Engineer. Seeker of sun, beaches, & tropical locations.
Joined March 2021
- Tweets 5,099
- Following 697
- Followers 1,803
- Likes 13,434
113 Photos and videos


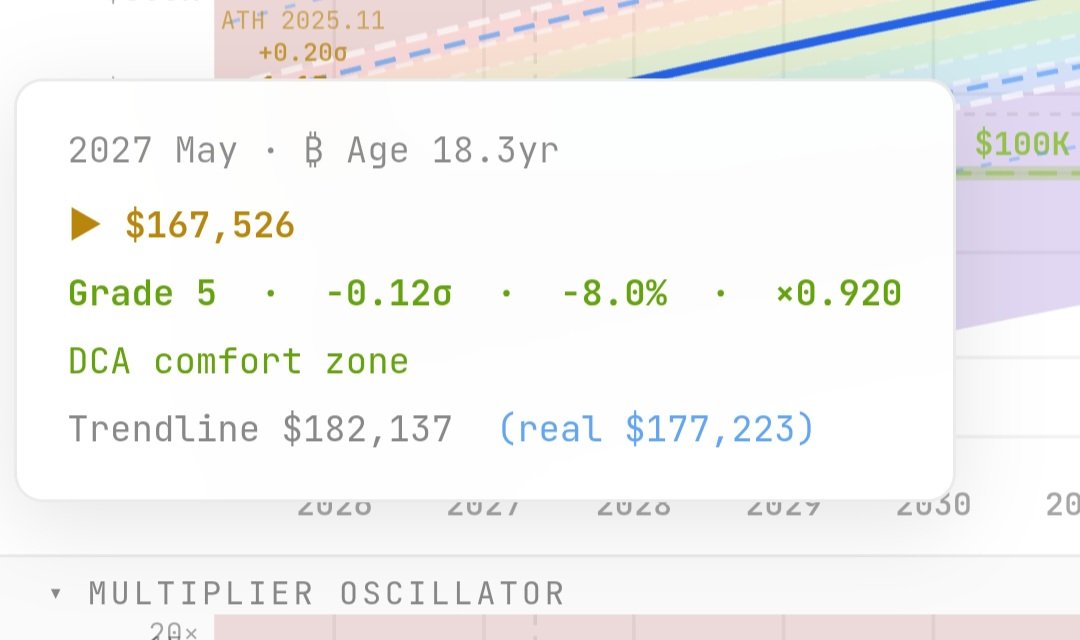
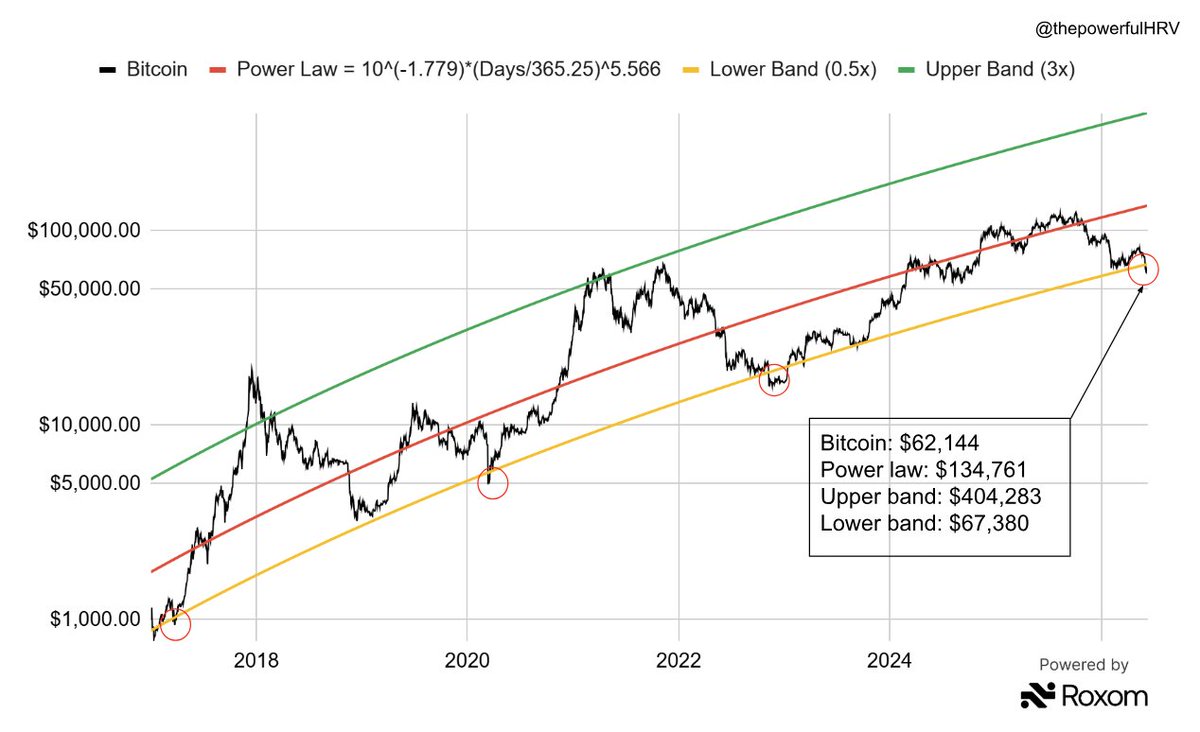
If the Bitcoin power law holds true,
With the current price at 60k,
the trend line projects 3x to 180k by May 2027.
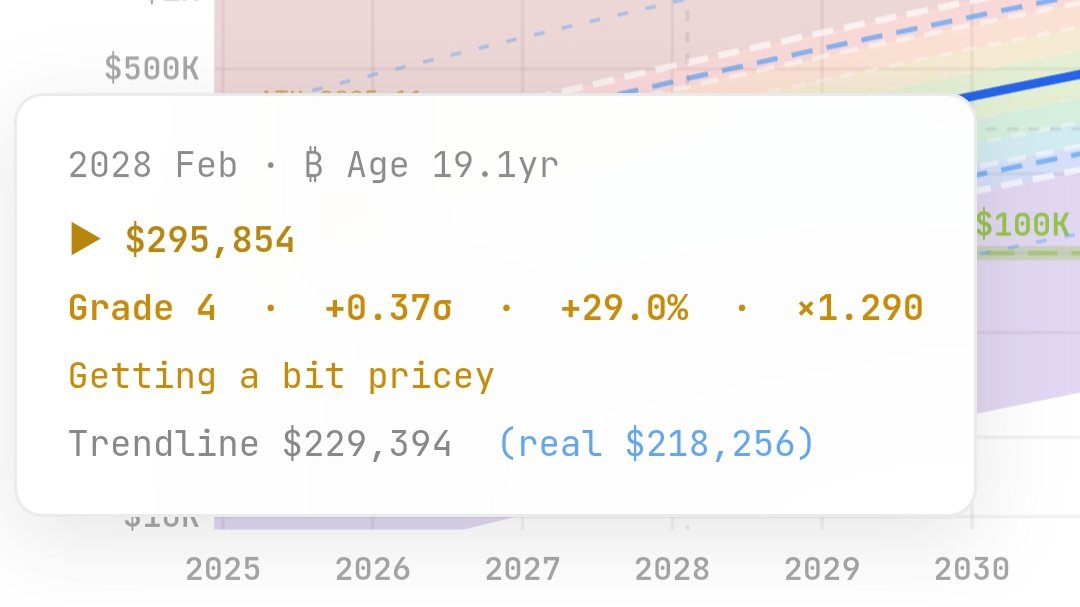
Even in early 2028 (18 months later), 300k would represent 0.37 sigma,
which is a slightly larger positive residual than the 0.25 sigma seen at the 2025 ATH of 126k.
The conclusion is that Fred Krueger's price outlook falls within a very plausible range within the power law framework.
충분히 가능한 가격
Jun 13

Bitcoin is absurdly cheap. It's likely to at least 3x in the next 18 months.
1
1
18
1,382
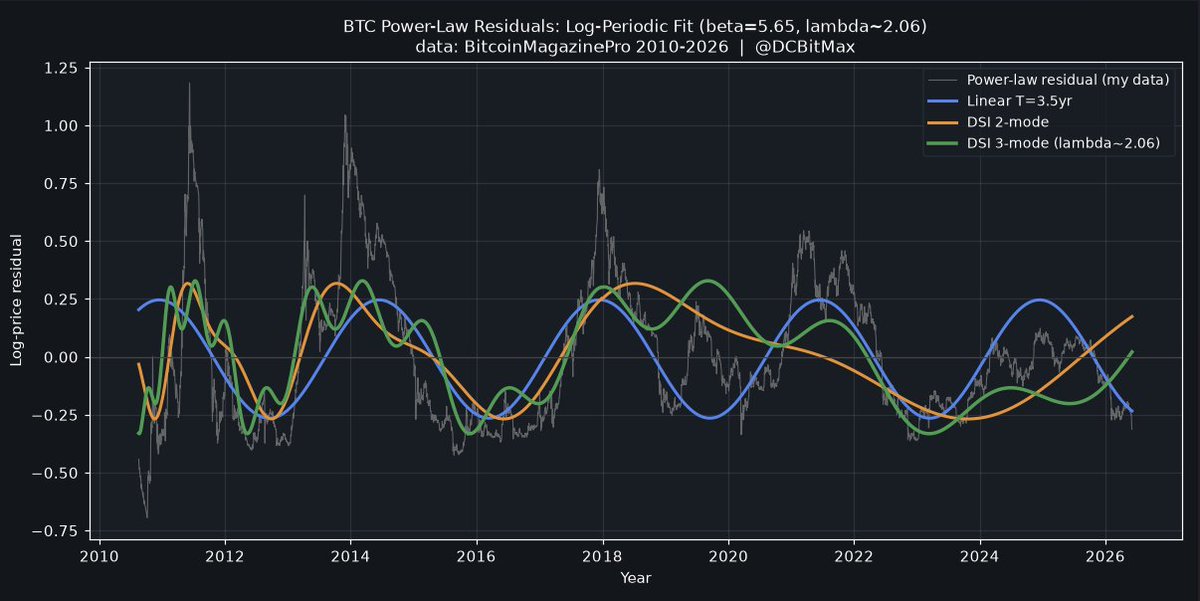
Dr. Perrenod — I reproduced your log-periodic analysis on my own data (BitcoinMagazinePro daily closes, 2010–2026) and wanted to share what I found.
My own power-law fit gives β = 5.65.
From the residuals, I recovered the log-periodic structure two independent ways:
• Lomb-Scargle → λ ≈ 2.04
• FFT / 3-mode DSI → λ ≈ 2.06
Both land right where you reported (~2.05).
The DSI 3-mode clearly tracks the residual peaks where a linear 3.5-year cycle drifts off — consistent with your finding that the structure is logarithmic, not calendar-time.
Thank you for publishing the method clearly enough that someone outside academia could replicate it.
I treat λ as "near 2," not exact — and none of this as a price predictor.
Just wanted to confirm your work holds up on independent data. 🫡
— a student of the power law, from South Korea
Jun 14

Vol is declining overall as a reciprocal plus offset. 4 year (3.5-3.8 year) linear cycle has very little explanatory power overall. The main cyclicality is log periodic with spacing λ ~ 2.05 as determined from FFTs, Lomb-Scargle and wavelet analysis.
open.substack.com/pub/stephe…

4
5
37
8,535
Strategy Dude retweeted

Net the debt prefs out and the common trades at a premium, as EV > BTC NAV.
Outright market cap trades at a discount to BTC NAV as a result of the debt prefs you’re cautioning against.
Selling common here increases USD NAV/share, while slightly decreasing BPS and leverage %
12
8
368
16,196
Strategy Dude retweeted

Jun 14
BPS measures Bitcoin per common share before senior claims. CEBE BPS measures Bitcoin per common share after senior claims. CEBE is the conservative risk metric. BPS is the common equity growth metric. BTC Yield measures BPS execution.
408
391
3,903
439,779
Strategy Dude retweeted

Jun 13
This is why Bitcoiners are attacking Saylor.
They can’t scale Bitcoin.
Saylor can.
Jun 13

The capacity of the lightning network has remained flat since ~2022.

7
2
34
4,581

Jun 13
Most cannot handle the G’s.

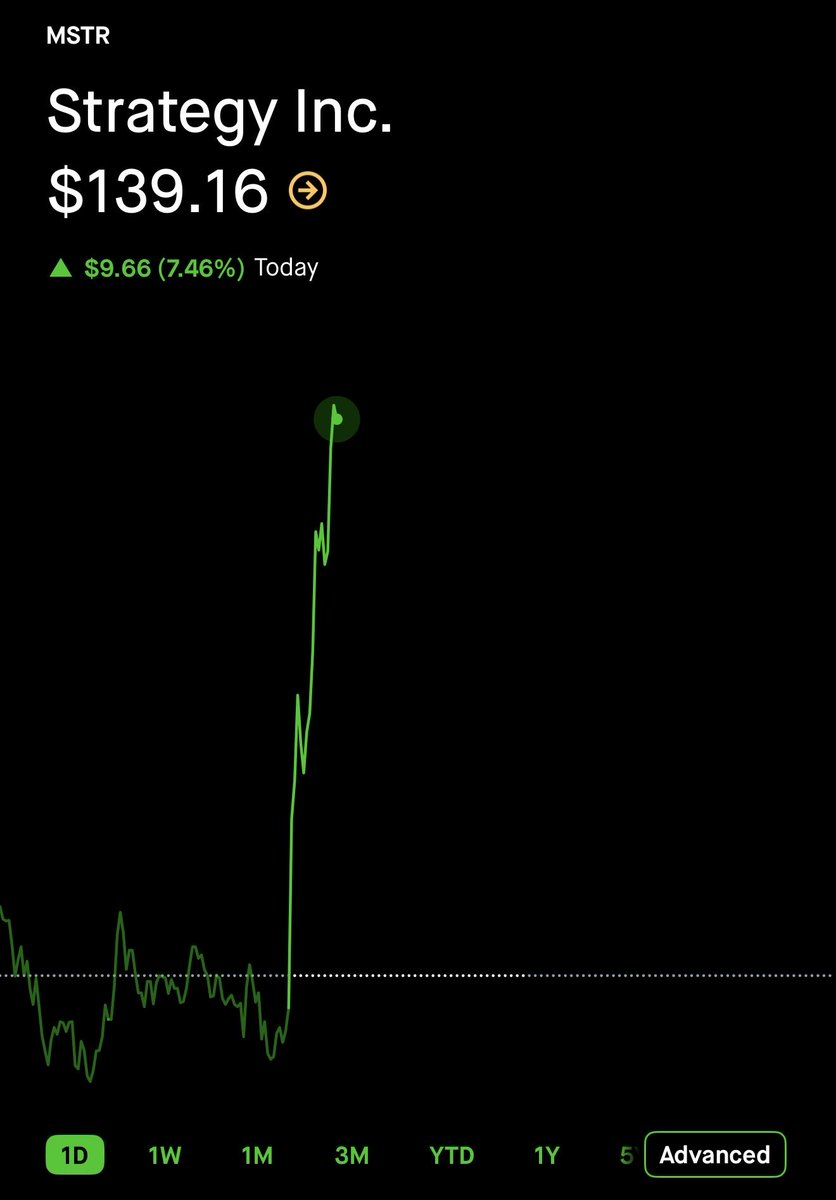
If you want to ride the jet, you’ve got to be prepared to pull the Gs. $MSTR

6
3
17
1,075
Strategy Dude retweeted

Jun 13
One has to become more and more patient with time.
This is a log-log-log chart. The y-axis price is logarithmic, the x-axis time is logarithmic.
And unlike what you have probably never seen, the time interval width of each candle is logarithmic. First candle width 0.37 years, last one 3.7 years.
That’s scale invariance, that’s the power law.
Age increase 50%, price up 10x. All along the curve. You want a 10 bagger, ask yourself what Bitcoin’s age is now, divide by two, and wait that long.

Jun 12
Anybody who doesn't understand the long term value proposition of Bitcoin is not going to make it as a Bitcoiner.
7
18
189
12,307
Strategy Dude retweeted

I have @phongle joining me at 12 PM EST on The Daily Wolf on @YahooFinance for a candid conversation about the Strategy capital stack, risk of forced selling and to unpack the good and bad takes we are seeing across Wall Street and social media.
Set your alarm.
16
8
63
8,950

"We're the largest holder of Bitcoin in the world. We're the largest purchaser of Bitcoin in the world. And we'll continue to be". Watch my conversation with @CNBC @PowerLunch below.
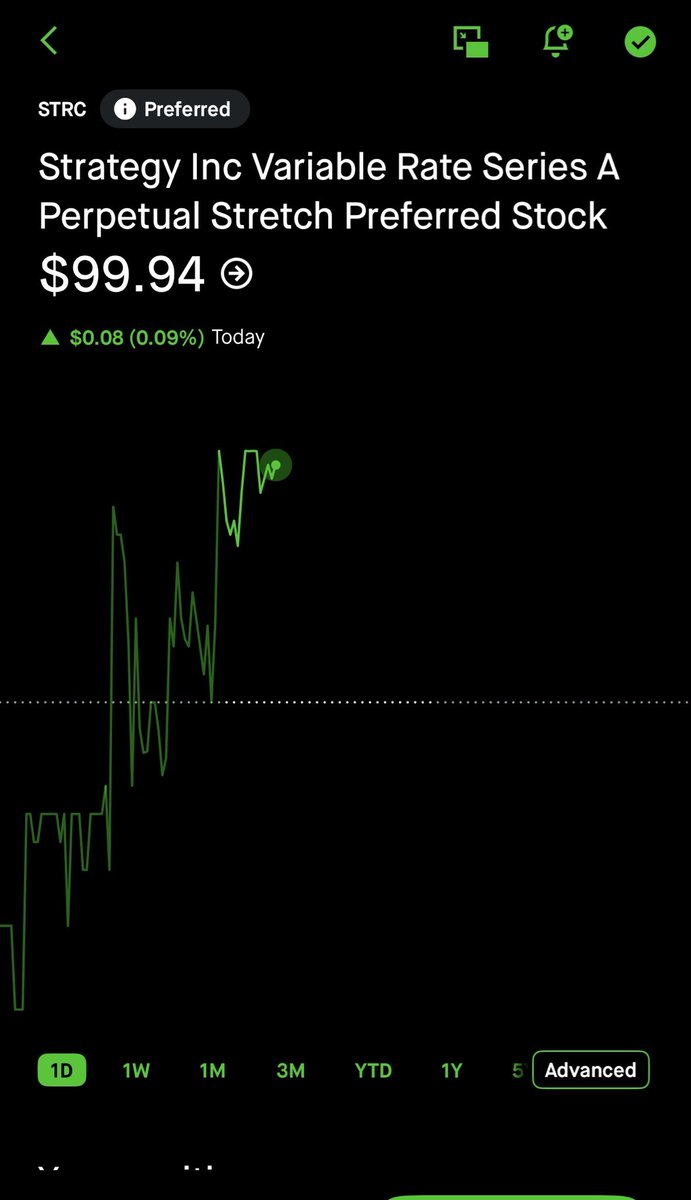
00:00 — "We're net purchasers of Bitcoin." The 32 BTC sale helped inoculate the market, test our processes, and capture tax losses over time
1:47 — We balance the needs of our constituents: $MSTR and $STRC shareholders, $BTC hodlers, and debt holders
3:07 — Four-year cycles, macro volatility, geopolitical conflict, inflation uncertainty, Fed policy, Clarity
4:15 — Bitcoin is a hedge against inflation and big government
5:32 — Capital that rotates from $BTC to AI will come back to $BTC
6:42 — With clearer rules, every major bank is going to flood into $BTC and crypto
7:27 — Expanding financial-system access is good for Bitcoin
194
566
3,186
229,730

Strategy Dude retweeted
Jun 10
Bitcoin up 1% while gold down 3%.
Having bottomed at 11 ounces in recent months now at 15 ounces, a 36% partial recovery.
BTC/Au is a ~ 5.2 index power law
“When BTC/Au turns up from a deep trough, it can be an early indication that capital is rotating back toward Bitcoin.”
We shall see …
4
4
76
4,679

Strategy Dude retweeted

Jun 10
The way $MSTR is structured, it is almost impossible for it to go bankrupt.
It holds enough BTC to pay the dividend indefinitely without raising another dime from the capital markets.
If $MSTR were ever forced to sell coins to pay the dividend, it would be a slow, controlled liquidation over many decades, something the market could easily absorb.
Images of an FTX/Enron-style collapse in $MSTR are largely bear fantasies, not scenarios grounded in reality.
79
33
466
27,076
This is the most rigorous Bitcoin paper
I've read. I've been studying —
and testing — it for 20 days.
scientificbitcoininstitute.o…
Dr. Santostasi and Dr. Perrenod gave us the ruler —
and the imagination to see the oscillator.
Together: the most falsifiable framework
in crypto economics.
The Power Law isn't just a model —
it's the most precise ruler we have
for measuring where Bitcoin stands.
Most models describe the past.
The Power Law keeps passing tests
it was never designed for.
"Isn't β=5.69 just curve-fitting?"
Fair question.
So I ran a test the paper didn't.
━━━━━━━━━━━━━━━━━━━━━━
Materials & Methods
━━━━━━━━━━━━━━━━━━━━━━
Data: Daily closing price and non-zero balance
address count (BitcoinMagazinePro,
2010-08-17 to 2026-06-04, n=5,771).
Model: log₁₀P(t) = log₁₀A β·log₁₀(t)
where t = days since Genesis Block (2009-01-03).
Out-of-sample design:
The power law was fitted exclusively on data
up to the freeze date, with zero observations
from the test period used in estimation.
Two freeze points were tested:
① Freeze at 2016-07-08 (2nd halving)
Training: n=2,153 | Test: n=3,617 (10 years)
② Freeze at 2020-05-10 (3rd halving)
Training: n=3,555 | Test: n=2,215 (6 years)
Residuals computed as:
ε = log₁₀(P_observed / P_predicted)
normalized by in-sample σ.
Mean residual and area integrals
(trapezoidal rule) applied to test period only.
The out-of-sample test was my idea.
Computation and analysis executed with
Claude Opus 4.8 (Anthropic).
━━━━━━━━━━━━━━━━━━━━━━
Froze the power law using data up to 2016 only (β=5.717).
Then measured the following 10 years it had never seen.
Result: mean residual −0.05σ. Effectively zero.
Frozen at 2020 instead → next 6 years, −0.13σ.
Same story.
The line drawn in 2016 ran straight through the next decade.
That's not fitting. That's forecasting.
The Power Law: powerful because it can be broken —
and hasn't been.
Knowing where we are won't tell us when things will happen — but it tells us exactly what to do now.
Buy Bitcoin Now.
@Giovann35084111 @moneyordebt @ScientificBTC
@saylor @natbrunell
#Bitcoin #PowerLaw


If you didn't read it yet. 10 k downloads. zenodo.org/records/19387099
21
99
671
124,105
Strategy Dude retweeted
Jun 10
The power law suggests Bitcoin is up only from here.
BTC has rarely deviated this far from the power law.
A rally to the upper band would put BTC well over $400K, something it has done multiple times in the past.
33
39
382
20,392
Strategy Dude retweeted

Everyone’s just mad it’s a bear market bro.
1
1
102
5,024
Strategy Dude retweeted
Jun 10
We believe in you Mike.
And we endorse this message.
1
24
1,104
Strategy Dude retweeted

Jun 9
A point on timeframes:
Berkshire Hathaway doesn’t even do quarterly conference calls.
They meet once a year and spend all weekend talking and answering questions in a stadium sized arena.
Sure, the $MSTR price action has been less than ideal in the AI melt up overlay.
But there’s a vision here in which @Strategy owns half the bitcoin, and then, owns energy companies outright as a FCF machine. ROC dividends go away, and we buyback the Prefs in the open market. And then, we become the largest holder of $QQQ in the world, actively monetizing this position with selling CCs, and running an in house venture capital firm since there is no need for a short term payback in a infinite time duration equity.
But wait, there’s more. If the opportunity arises in which there are no better investment opportunities, we will buy the stock back. There is no theoretical limit to how high Bitcoin per share goes in that scenario.
The long term shareholder view:
MSTR is not about owning Bitcoin.
MSTR is about owning everything.
PS a prediction. The @Strategy World conference will one day be held in an arena larger than Berkshire today, with all the shareholders and stakeholders who have a professional relationship with Strategy.
12
7
95
10,540
Strategy Dude retweeted
Jun 9
Retweets are notifications, not endorsements. When I endorse something, I say so.
Bitcoin-backed credit instruments compete with fiat and crypto yield products, not with Bitcoin. When capital moves from fiat/crypto collateral into BTC-backed instruments, it strengthens the Bitcoin network.
112
144
1,985
75,433