
Useful cross-browser DevTools tips
Joined June 2021
- Tweets 524
- Following 149
- Followers 985
- Likes 98
108 Photos and videos


DevTools Tips @devtoolstips@front-end.social retweeted

9 Feb 2024
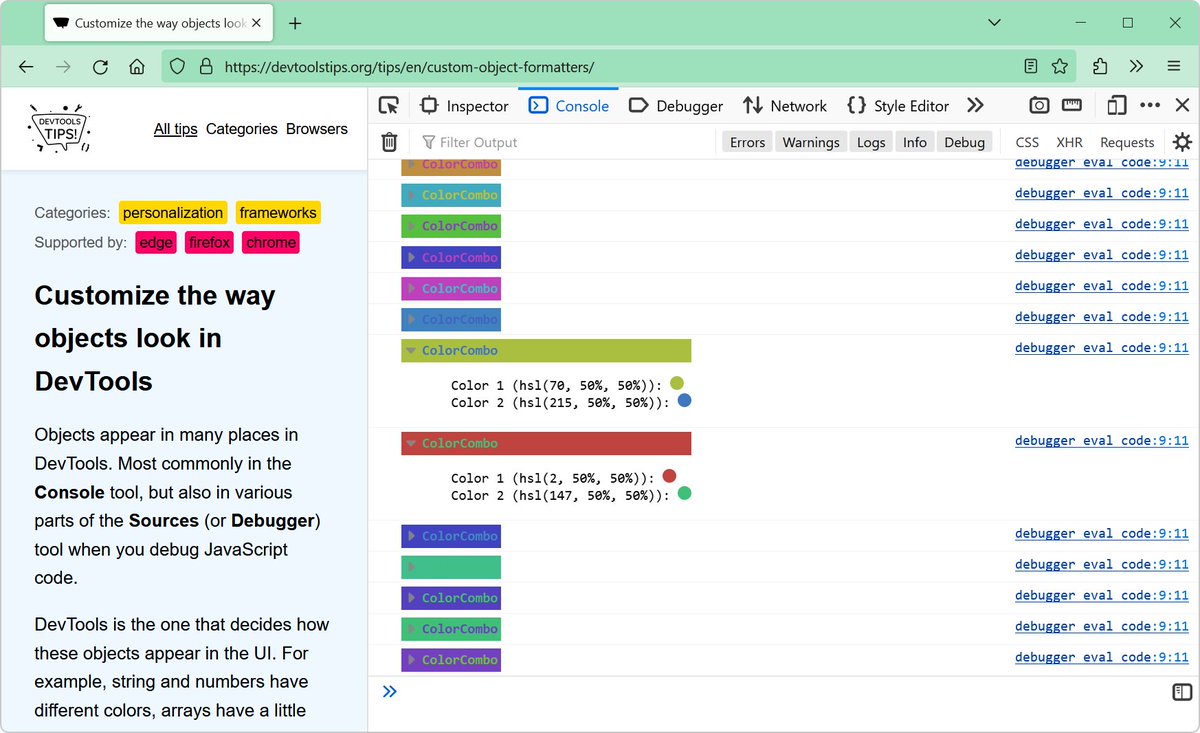
✂️Paper cuts fixed! #ChromeDevTools now format & pretty print all JSON data & its sub types everywhere. developer.chrome.com/blog/ne…
#webdevelopment #debugging #json
1
15
1,038
DevTools Tips @devtoolstips@front-end.social retweeted

20 Feb 2023
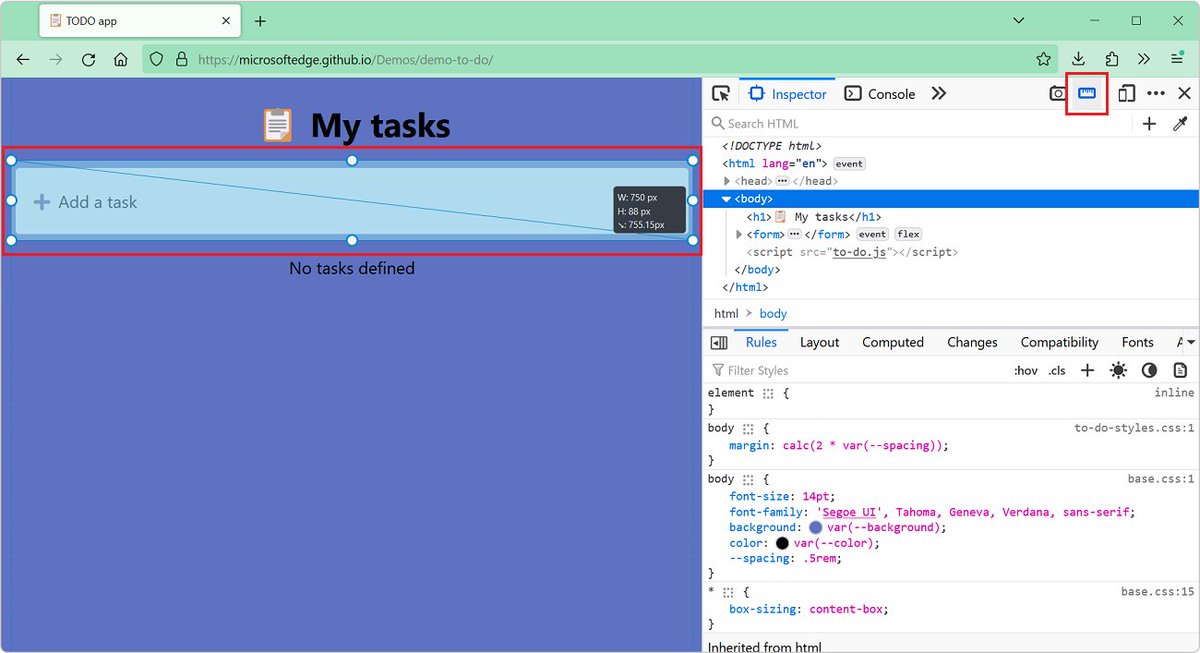
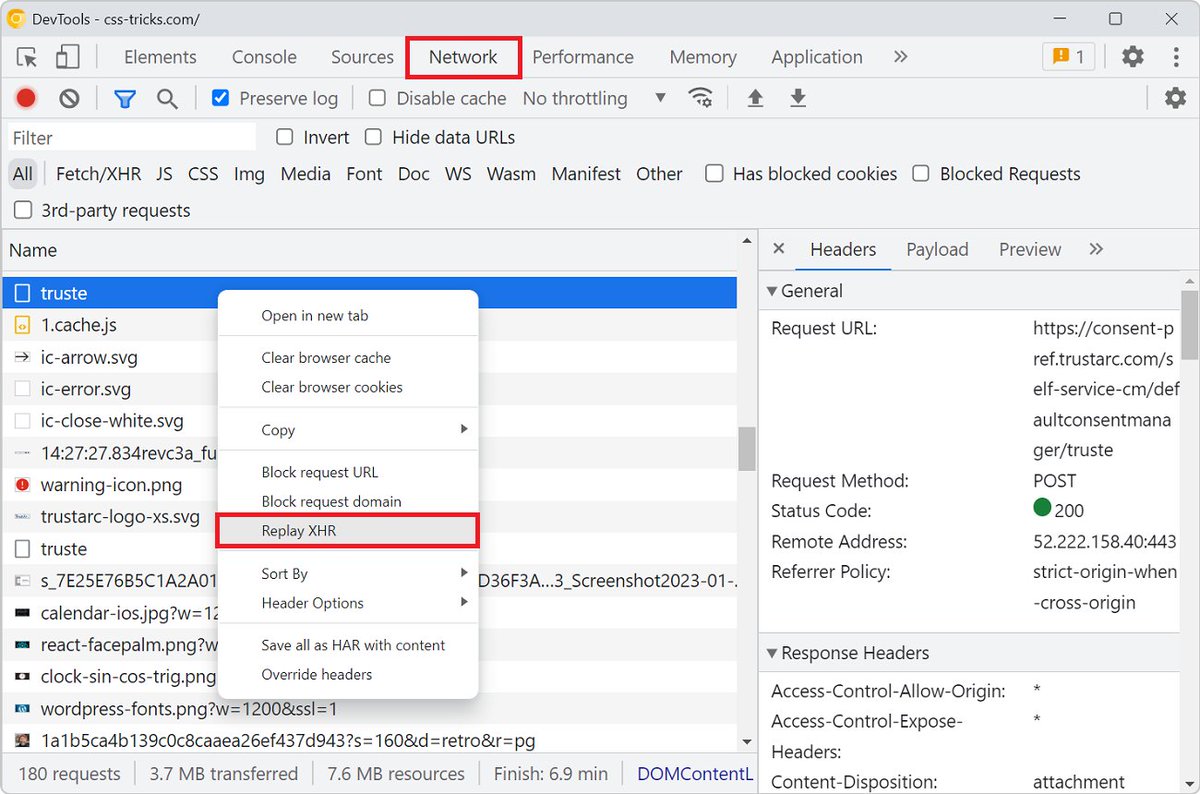
Here's a tip for you, different ways of taking browser screenshots in DevTools 📸️
What do you think of this sort of 1 minute web development video? Would you like to see more of these?
4
16
60
13,294

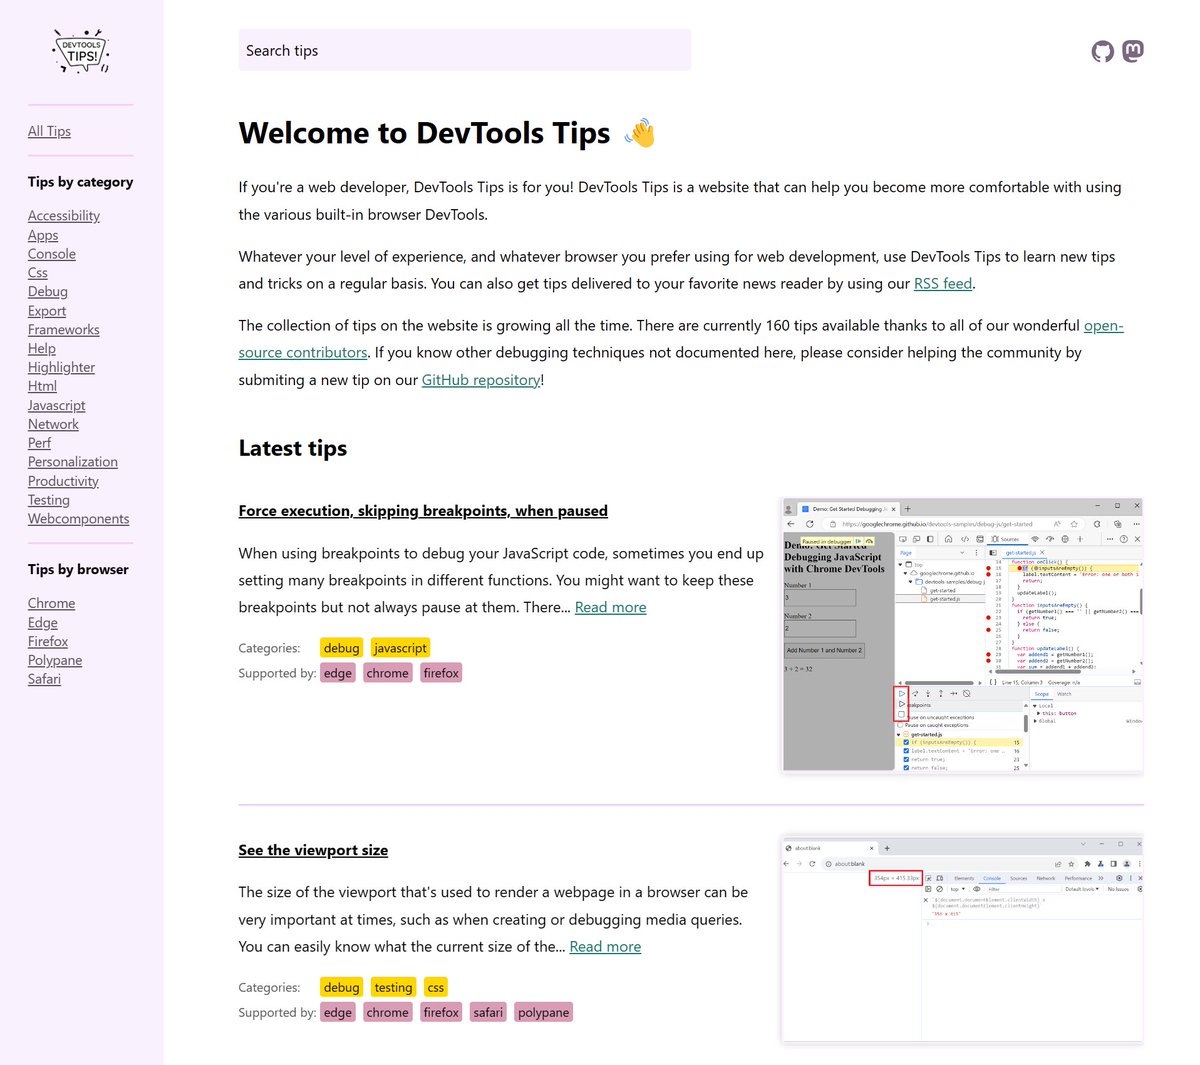
devtoolstips.org just got a face lift!
Now with:
✅ A home page that actually says what the site is about 
✅ A persistent sidebar to quickly access collections of tips.
✅ A persistent search field to find other tips.
ALT The new home page
7
30
2,867
DevTools Tips @devtoolstips@front-end.social retweeted

17 Nov 2023
Simulate color blindness
↳ @FirefoxDevTools
◆ In the "Accessibility" panel, from the toolbar open the "Simulate" menu and select the type of deficiency to simulate the page for the users with that deficiency.
→ canidev.tools/simulate-color…
1
4
296
DevTools Tips @devtoolstips@front-end.social retweeted

8 Nov 2023
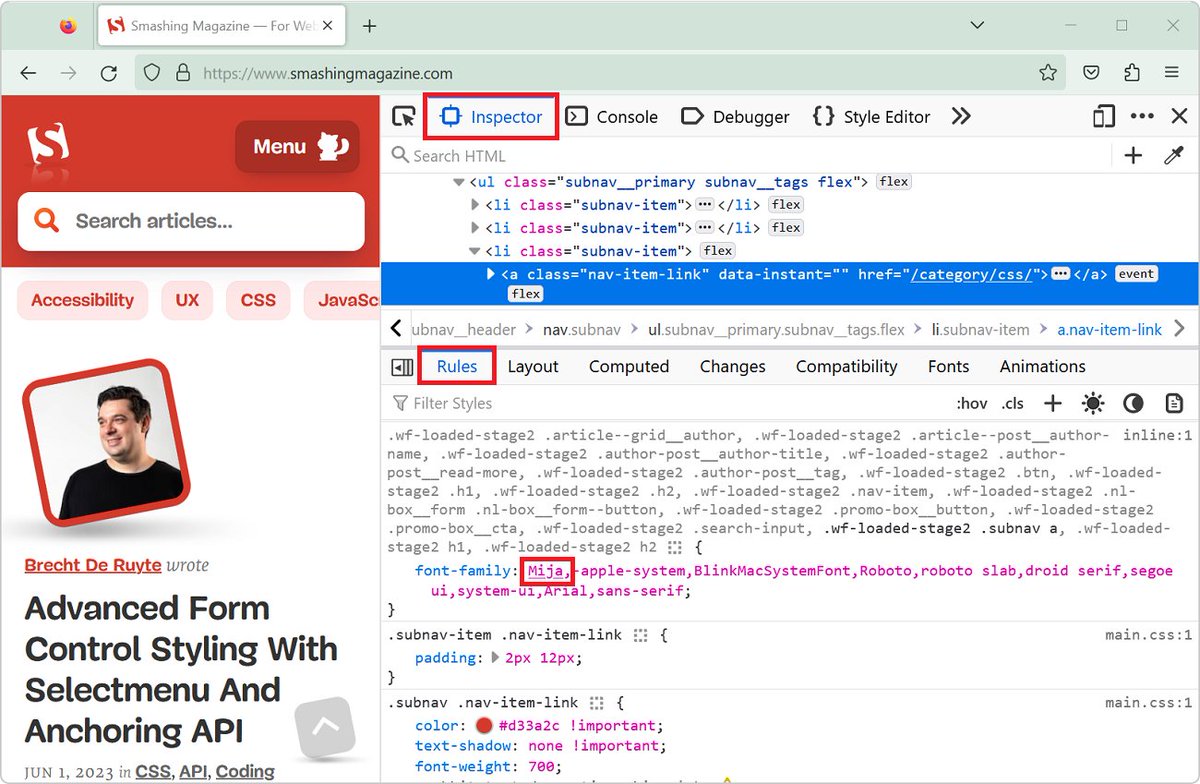
Having access to a free reporting tool like Lighthouse in DevTools is a great start for diagnosing performance issues by identifying bottlenecks on the main thread.
↬ Check out how @SpeedCurve can help you and your team dig deeper into the data: smashingmagazine.com/2023/10…
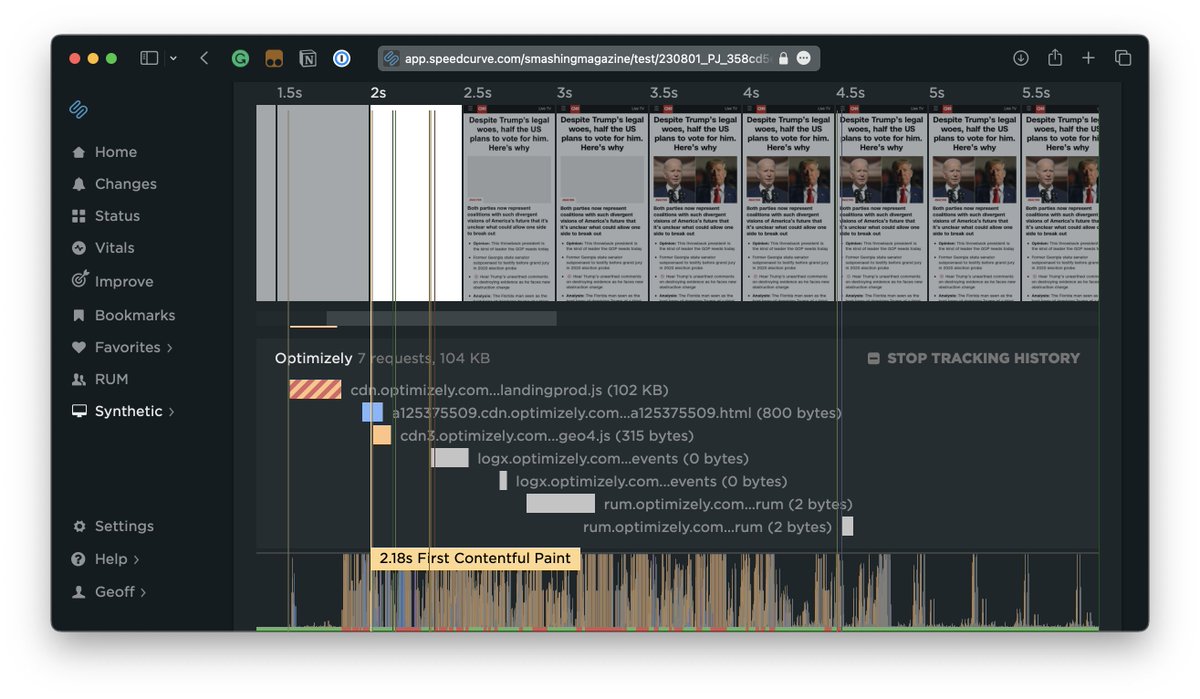
ALT Browser Waterfall: SpeedCurve can go even deeper than Optimizely simply by distinguishing between first- and third-party scripts.
8
18
8,542
DevTools Tips @devtoolstips@front-end.social retweeted

4 Nov 2023
The new Injector Tree inspector is sooo cooool !
@alexbodurri is doing a wonderful job with the #Angular devTools !
In v17 we'll be able to inspect the injector hierarchy, check the available provider values.
It's great for debugging, great for learning 💪

3
20
130
14,229
DevTools Tips @devtoolstips@front-end.social retweeted
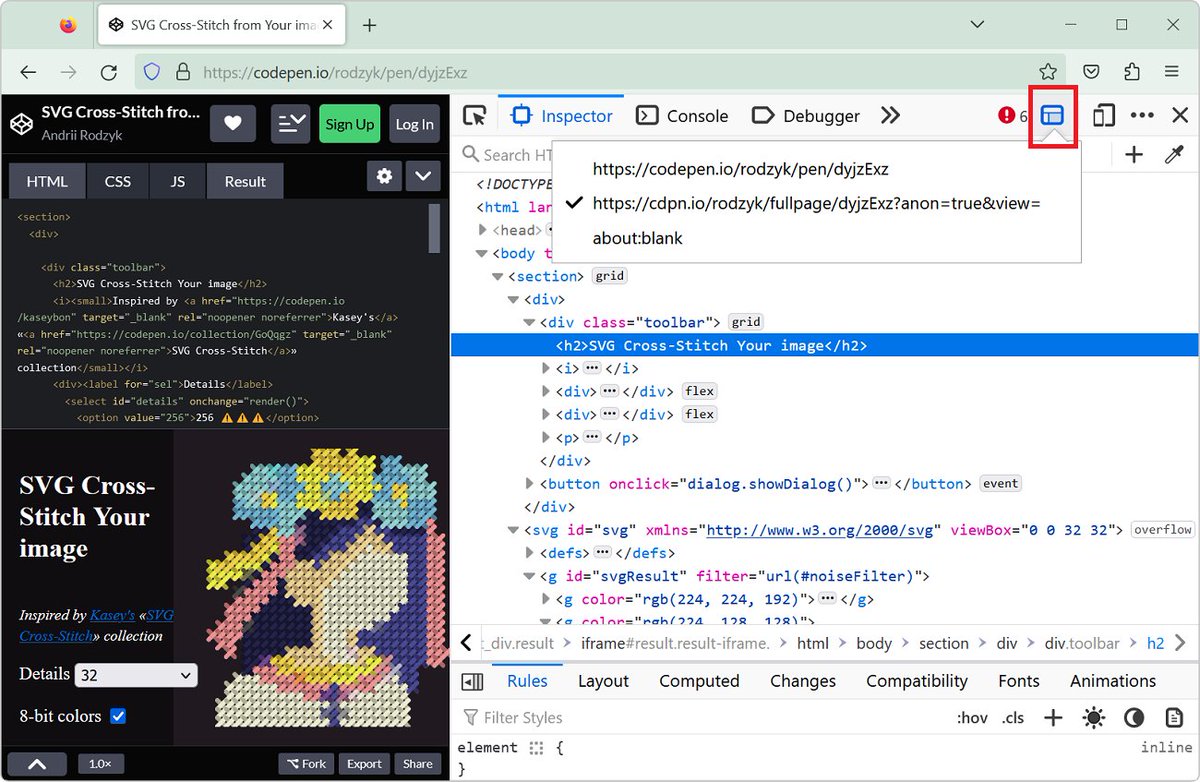
4 Nov 2023
Preview social media cards
↳ @polypane
◆ Open Info > Meta & scroll to Social media previews section. Works with localhost & you can overwrite domain with a click.
◆ Toggle light/dark buttons to preview the card in light and dark mode respectively.
🌐canidev.tools/preview-social…
5
6
831
DevTools Tips @devtoolstips@front-end.social retweeted

2 Nov 2023
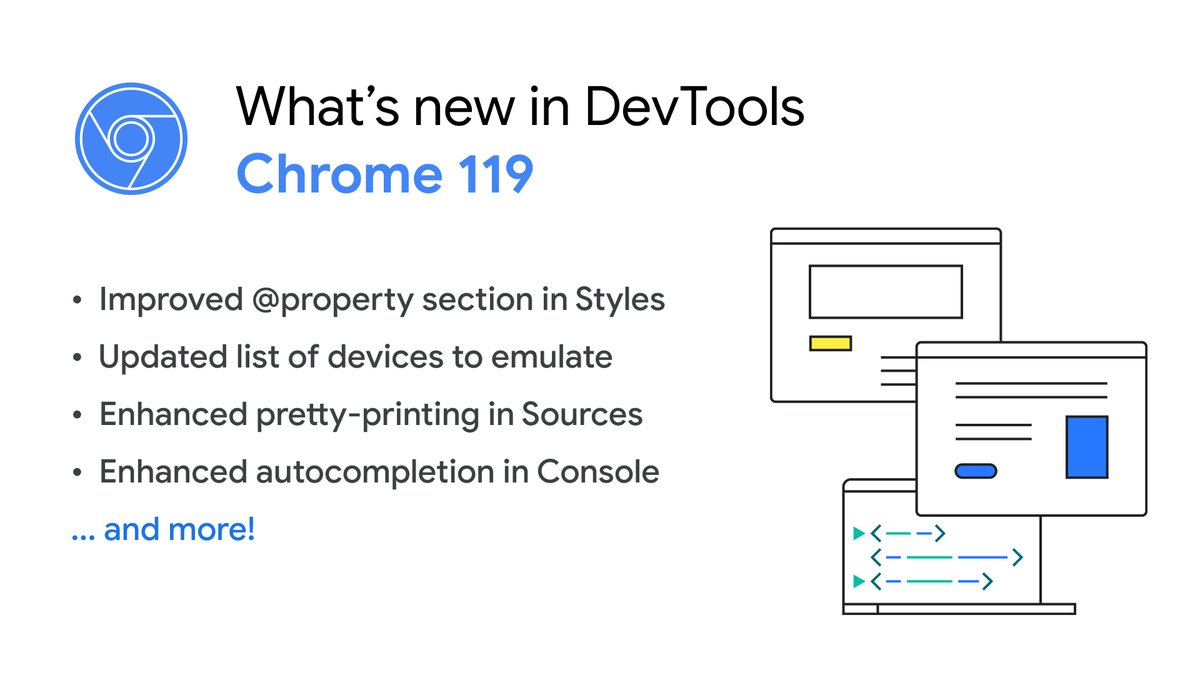
✨ Chrome 119 is here! What's New in DevTools?
- View CSS @property in the Styles pane
- Refresh the emulate devices
- Better pretty-print and autocompletion
...and more! 👇🏽
developer.chrome.com/blog/ne…
2
12
48
13,675
DevTools Tips @devtoolstips@front-end.social retweeted

1 Nov 2023
Polypane 16 is here! 🥳
- Cool new CSS tools/emulation: @scope, prefers-reduced-transparency, scripting
- Updated X/Twitter preview cards, with domain overwriting
- A11y workflow improvements
- Chromium 118
Find all the details here: polypane.app/blog/polypane-1…
8
17
1,452
DevTools Tips @devtoolstips@front-end.social retweeted

14 Apr 2022
Spent hours debugging unwanted horizontal scrollbars?
@FirefoxDevTools shows directly in the inspector, which is the element with scrollbar and what are the overflowing elements 🤯
11
119
687
DevTools Tips @devtoolstips@front-end.social retweeted
16 Oct 2023
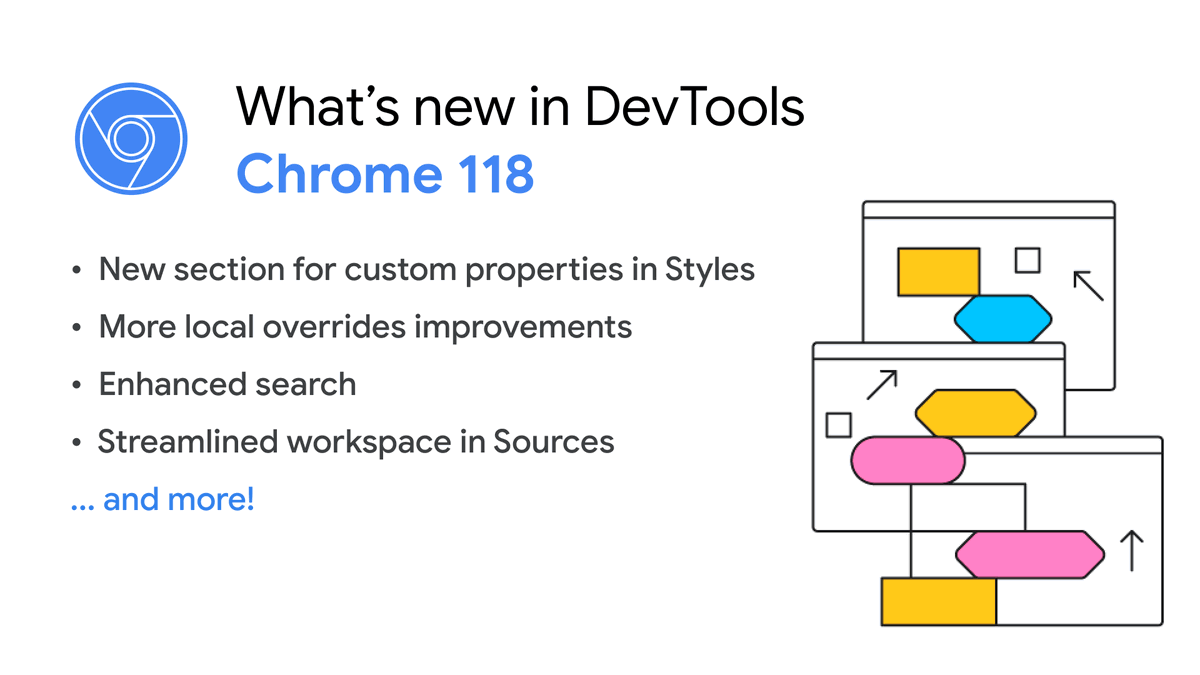
It's here! What's new in DevTools (Chrome 118)
🍋 Styles pane support CSS @property
😏 More local overrides improvements
🔎 Enhanced and faster search
📹 youtu.be/-dOYxJnRhxQ?si=v54S…
📜 developer.chrome.com/blog/ne…
4
14
56
14,610
DevTools Tips @devtoolstips@front-end.social retweeted

12 Oct 2023
Lighthouse v11.2 includes an overhaul to the performance category that focuses audit prioritization on estimated impact to the performance metrics. Also included is an upgraded score gauge. On hover, it visualizes how each performance metric affects the overall performance score.
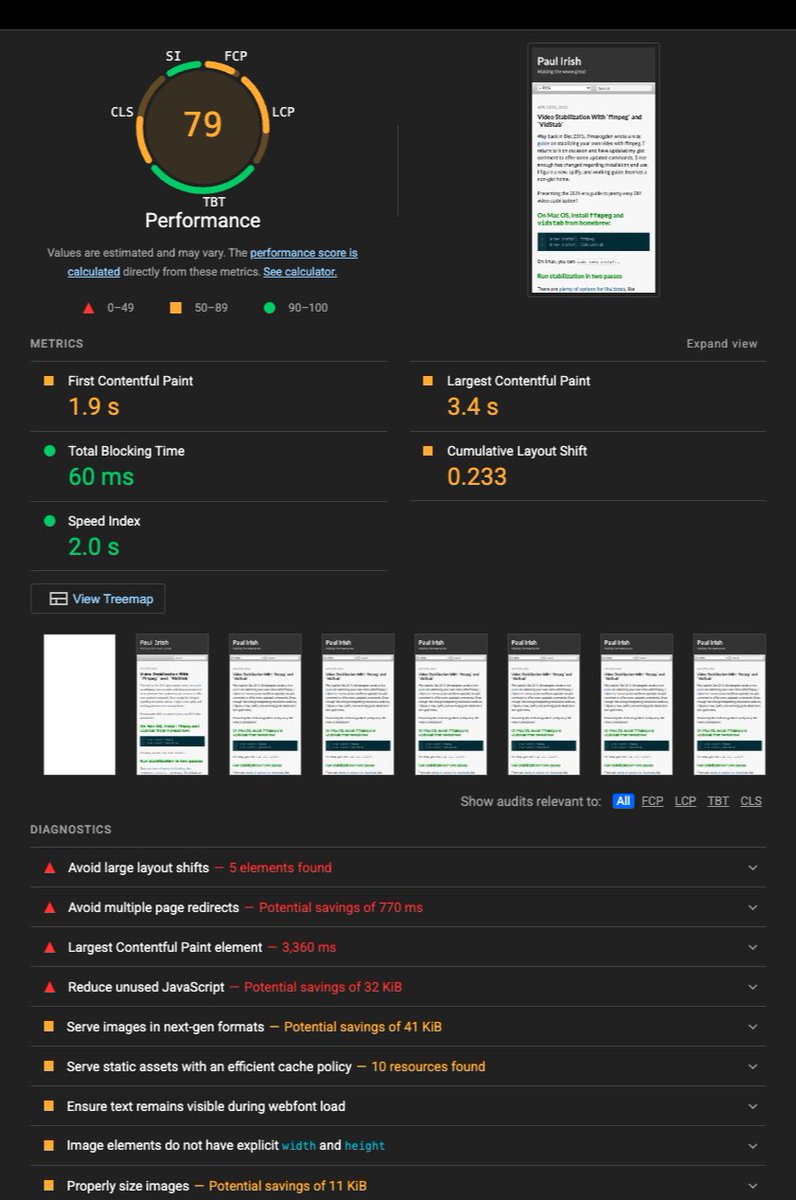
ALT A Lighthouse report, with the score gauge at the top subdivided into multiple arcs, each corresponding to one of the performance metrics.
6
87
359
41,772
DevTools Tips @devtoolstips@front-end.social retweeted

10 Oct 2023
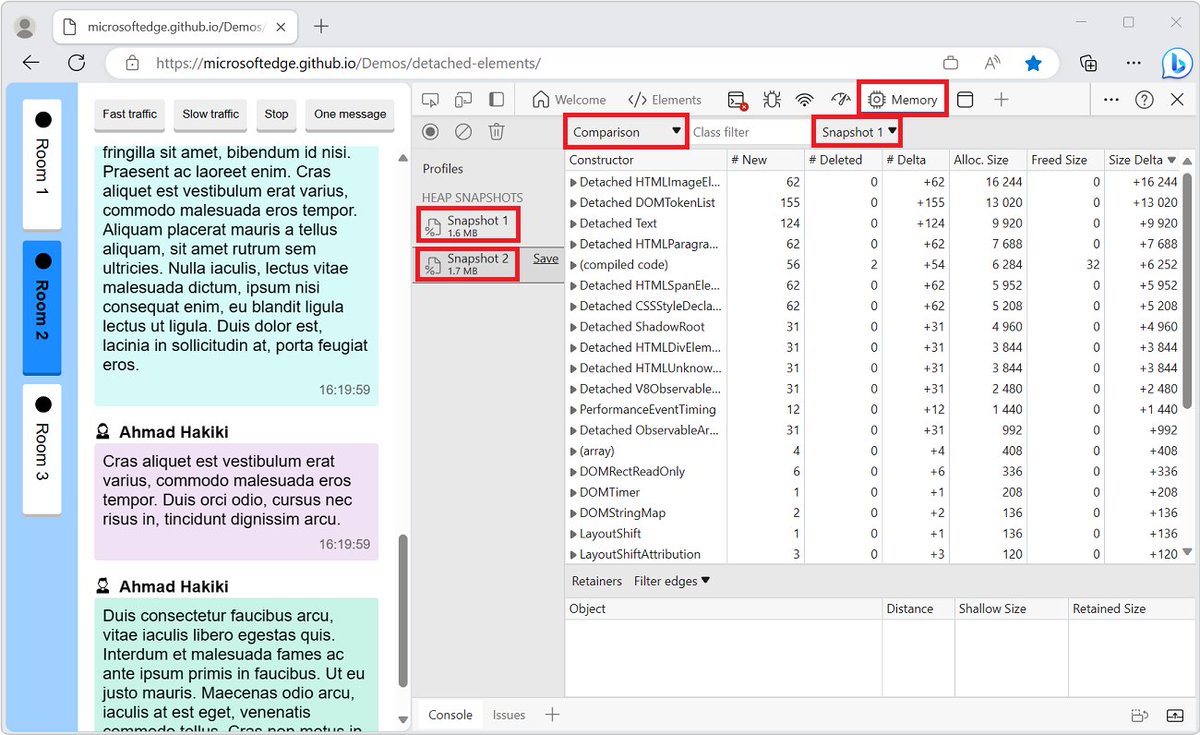
Introducing the Crash Analyzer tool, improvements to the memory tool, and accessibility improvements in Microsoft Edge for Business🧠
Learn more about what else is new in DevTools 113 and 114: msft.it/60139sr8J
3
7
22
5,070
DevTools Tips @devtoolstips@front-end.social retweeted

10 Oct 2023
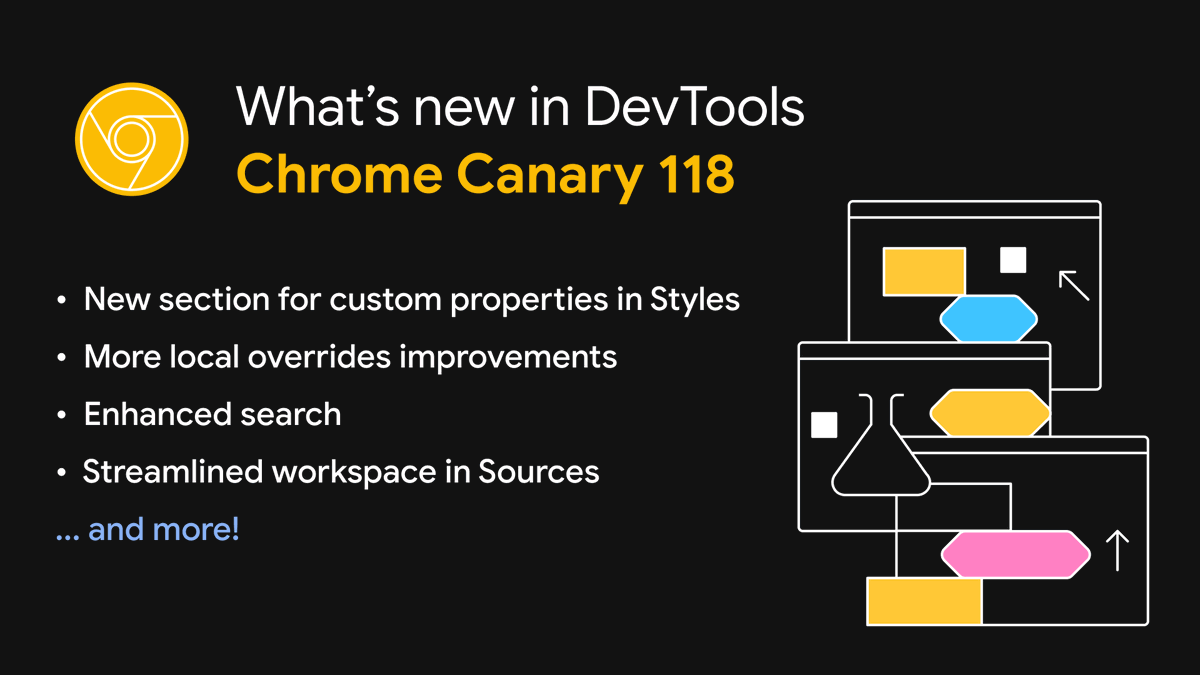
DevTools implemented improvements to the Sources panel! 🛠️
Dive in and see what’s new for developers in Chrome 118. → goo.gle/46E2ium

ALT New in Chrome 118
1
10
46
10,850

I’m extremely pleased to announce the release of Scroll-Driven Animations Debugger, a Chrome DevTools extension to visualize and debug Scroll-Driven Animations.
🔗 brm.us/scroll-driven-animati…
Get the extension from the Chrome Web Store and start inspecting scroll-driven-animations.sty…
8
80
405
40,933
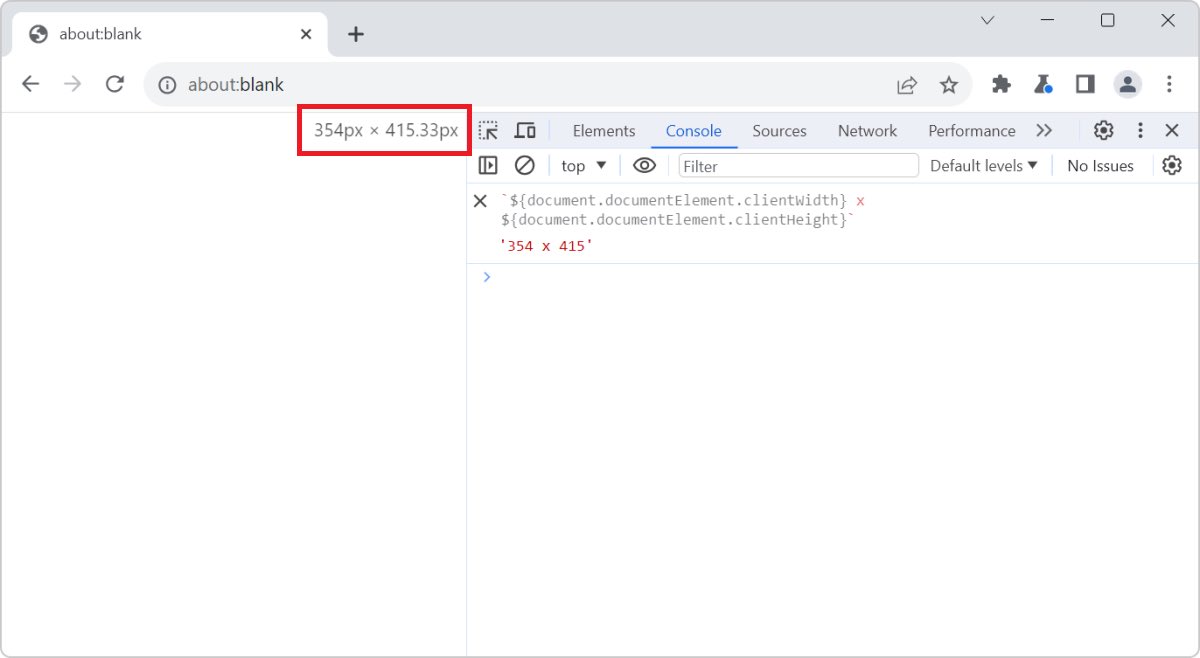
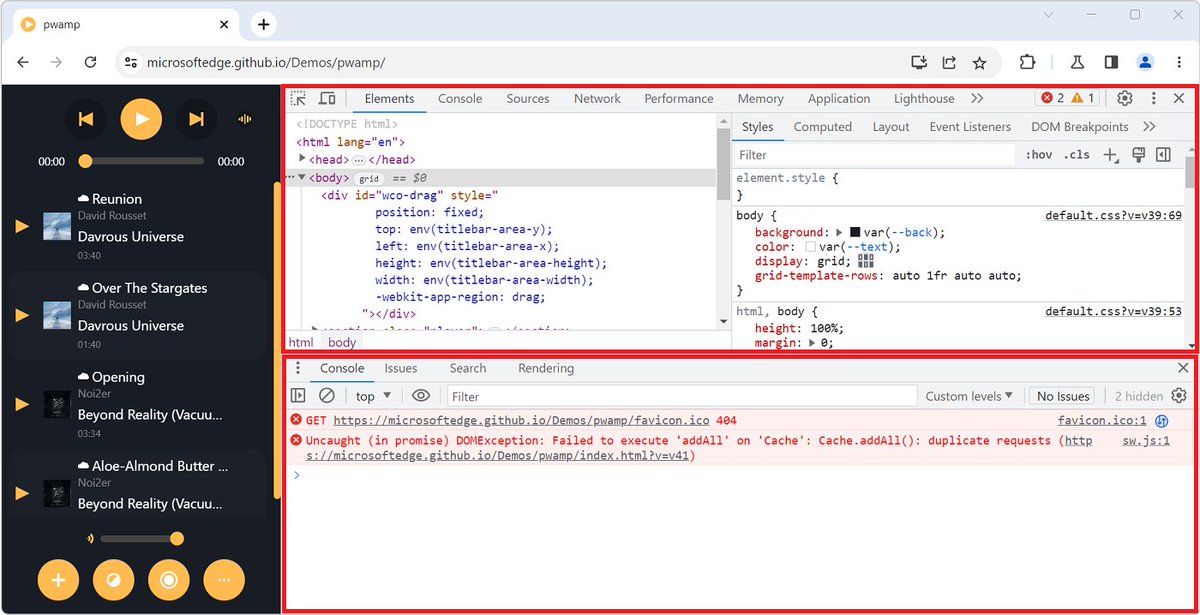
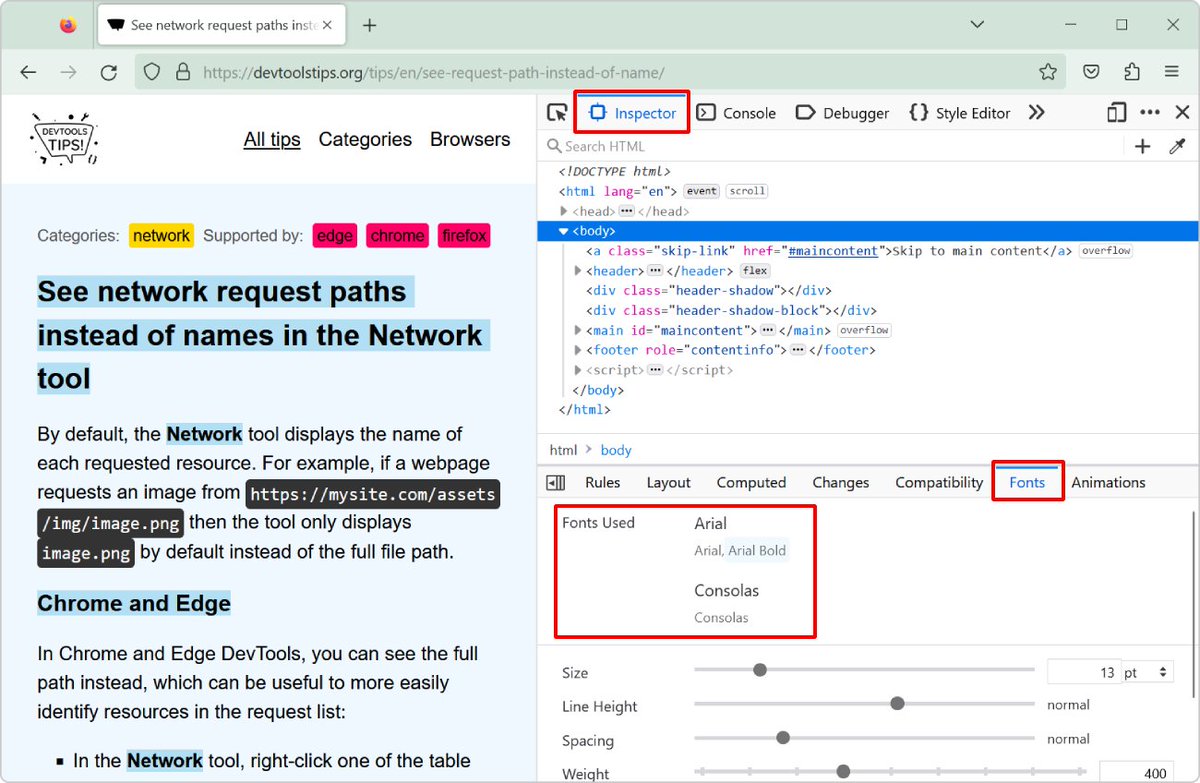
📏 The current size of the viewport is kind of important to know about when debugging certain issues, or working on media queries.
💡With DevTools, you can easily see the viewport size!
devtoolstips.org/tips/en/see…
ALT Chrome, with DevTools opened, the viewport size overlay appears in the rendered webpage
1
334
DevTools Tips @devtoolstips@front-end.social retweeted
2 Oct 2023
New #DevToolsTip! "It works on my machine!" 😆 Let's see how @oliverdunk_ and @jecfish debug and fix their Chrome extension.
Watch 📹: youtu.be/Ta-YTDhiBIQ?si=ZZaI…
1
2
13
8,420
DevTools Tips @devtoolstips@front-end.social retweeted
26 Sep 2023
By default, any changes you make in DevTools are not saved because they disappear after the page is reloaded. 💥
But Workspace can change that!
@jecfish has all the tips on setting up a workspace to ensure your changes are saved in your source code.
3
30
160
17,305
DevTools Tips @devtoolstips@front-end.social retweeted
26 Sep 2023
My face when I saw the new #ChromeDevTools 117 features. 🤯 Watch the highlight to learn more: youtu.be/oMRpODeXzho
Mock API responses? 🙀 Hide Chrome extension requests? 🥷🏼 Debugging fetch priority? 📊
This update is so good it's got me feeling like 👇🏽

2
11
51
7,082
DevTools Tips @devtoolstips@front-end.social retweeted
21 Sep 2023
What's next in DevTools (Chrome 118)?
🪮 View CSS @ property
🎬 Filter overridden network requests
🔎 Enhanced search
... and more! Try them first in Chrome Canary.
developer.chrome.com/blog/ne…
5
34
6,920