
Joined April 2022
- Tweets 1,444
- Following 35
- Followers 622
- Likes 2,599
486 Photos and videos


Pinned Tweet

May 17
Bitcoin is already mined at 95%!
Only less than a million BTC left… forever.
This is the last great opportunity of your life to be part of the greatest scarcity in history. Don’t look back! 🔥
#Bitcoin #BTC #Crypto #BitcoinScarcity #HODL #LastChance #DigitalGold
3
1
7
1,834
19h
🧨 What if the biggest stock market spectacle in history wasn’t just innovation… but a master move before the storm?
Picture this:
While the world is mesmerized watching Elon Musk’s rockets landing like magic, something much bigger is happening behind the scenes.
SpaceX, Musk’s crown jewel, could one day pull off the largest IPO in history. Billions flowing in, astronomical valuations, Musk approaching or surpassing trillion-dollar wealth on paper… and the stock market “exploding” with euphoria.
But what if this isn’t just a technological triumph? What if it’s a perfectly timed financial and geopolitical operation hiding in plain sight?
Here’s a hypothesis worth considering:
The biggest players may not simply be cashing in on their empires. They could be injecting massive liquidity, attracting capital from retail investors and large funds, and positioning themselves ahead of a potential geopolitical cataclysm. Tensions in the Middle East, the possibility of a broader conflict involving China, temporary truces that few fully trust… the global chessboard is heating up.
The market rises—or at least stays buoyant for a while longer—allowing major stakeholders to sell or value their holdings in an environment of optimism. Meanwhile, some of the world’s wealthiest investors may be accumulating hard assets: land, energy, commodities, and strategic resources through complex structures. Stock market euphoria could be the perfect distraction.
It’s like throwing a big party on the deck of the Titanic while some are already boarding the lifeboats.
Manipulation? Strategic genius? Both? The debate is open. What seems undeniable is that timing matters. SpaceX may not just be launching rockets into space… it may also be at the center of a financial event capable of reshaping the rules of the game.
What should ordinary people do?
• Don’t fall for blind euphoria.
• Remember that paper wealth is only real when it’s realized.
• Gain knowledge, diversify intelligently, and never lose sight of the geopolitical picture.
Do you think this is just a great tech business story… or is there something deeper happening beneath the surface?
#SpaceX #ElonMusk #StockMarket #Geopolitics #Investing #RealEconomy
4
3
8
2,936
Jun 8
Bitcoin: The Floor That Might Be a Trap
Lately, I've been watching Bitcoin with a mixture of caution and fascination.
After a deep correction, the market appears to have found a temporary floor. Selling pressure has eased, ETF outflows have slowed, and price action has settled into a range that, at first glance, invites optimism.
But that optimism is exactly what concerns me.
The most dangerous phase of any cycle is often not the crash itself.
It's the recovery that convinces everyone the worst is over.
A true bull trap is more than a technical bounce. It's a psychological event.
Price rises just enough to revive confidence. The media starts talking about recovery. FOMO returns. Sentiment shifts from fear to excitement.
And just when the majority begins to believe again, liquidity vanishes.
I've seen this pattern before, and some of the similarities to the current environment are difficult to ignore.
What we still lack is clear evidence of a significant wave of fresh institutional capital entering the market. Smart money appears selective and patient, while retail investors—exhausted after months of volatility—seem particularly vulnerable to any sustained upward move.
Meanwhile, macroeconomic risks haven't disappeared.
Monetary policy, geopolitical uncertainty, and Bitcoin's correlation with risk assets remain important variables that many seem eager to overlook.
Could Bitcoin rally from here?
Absolutely.
In fact, I think a meaningful rebound is not only possible, but likely.
What I question is the assumption that every rally must be the beginning of a new bull market.
Sometimes the market's strongest move is designed to attract the maximum number of participants before revealing its true direction.
My position remains unchanged:
Long-term #bullish. Short-term cautious.
I continue to hold core positions because I believe Bitcoin's long-term adoption story remains intact. But I have reduced tactical exposure, avoid leverage, and prefer to accumulate only when risk-reward becomes genuinely attractive.
#Markets have always had a way of inflicting the greatest pain on the greatest number of participants before the real move begins.
This cycle may prove no different.
For now, I watch. I wait. And I remain patient until the market reveals whether this floor is the foundation of the next advance—or merely the setup for the biggest trap of the cycle.
Do you think #Bitcoin has already found its bottom, or is the real test still ahead?
1
6
1,411
Jun 7
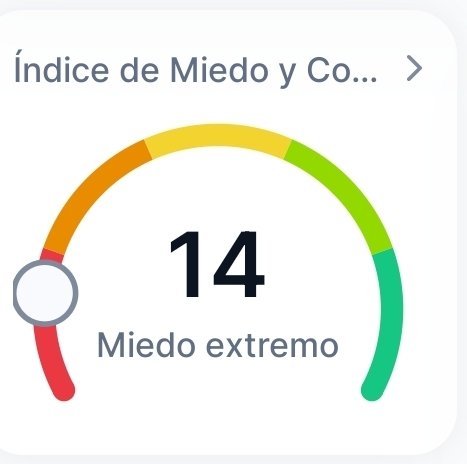
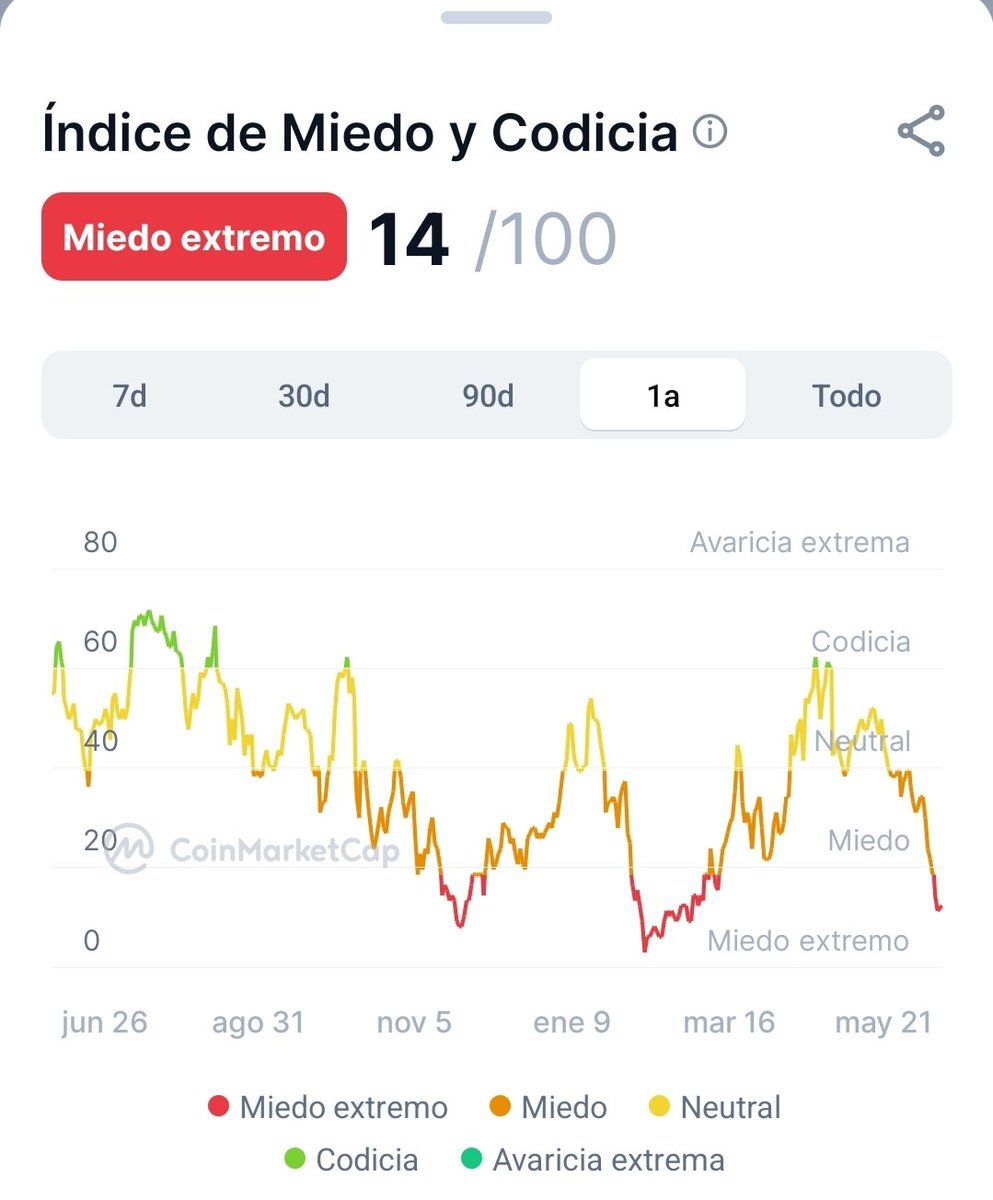
🚨 The Fear & Greed Index has just dropped back to 14: Extreme Fear.
One of the lowest readings seen in 2026 so far, and a level only reached a handful of times this year.
History shows markets tend to test investors’ conviction precisely when sentiment hits panic territory.
📉 Most people sell in fear.
📈 Patient investors start paying attention.
This doesn’t confirm a bottom, but it does show that pessimism is once again dominating the market.
Is this a buying opportunity… or is there more downside ahead?
👇 What do you think?
#Bitcoin #BTC #Crypto #FearAndGreed #Investing #Markets
2
5
185
Jun 7
A Crash This Summer. A Boom in 2027.
I’ve been spending some time looking at what’s happening in the markets, and these are the points that stood out to me the most and that I think are worth sharing.
What struck me the hardest is the view that after a summer of euphoria, we could see a pretty sharp drop in August. Valuations are stretched in several areas, and there’s a real risk of a meaningful correction once the seasonal tailwind fades. The main takeaway for me is to prepare in advance — stay disciplined, but don’t be fully exposed if things turn.
I’ve also been looking closely at the SpaceX IPO. While the company has enormous long-term potential, the current valuation looks excessive and it doesn’t appear to be a good entry point right now. On top of that, the deal could pull a significant amount of liquidity out of the system and create ripple effects across the broader market. It’s a reminder that even great business stories aren’t always great trades at the wrong price.
The most constructive part for me was the longer-term outlook: 2027 could be a historically strong year for markets, driven by the real productivity gains that Artificial Intelligence is starting to deliver. This isn’t just narrative — AI is beginning to create measurable efficiency improvements that could shift the macro landscape. The US is clearly ahead in this transition, while Europe continues to lag.
A few key ideas have stuck with me:
- Liquidity and investor sentiment are still the dominant forces — often more important than traditional fundamentals.
- The fiat system is under structural pressure from deficits, which is pushing capital toward harder assets.
- We’ll likely continue to see inflation data managed in ways that support rate cuts and keep short-term bullish momentum alive.
- In this environment, developing real skill in the markets is becoming almost essential for protecting and growing wealth — especially for younger investors. It’s not something you pick up overnight.
My personal takeaway is that we’re in a bipolar setup: there’s genuine risk of a correction this summer, but there’s also a powerful structural bull cycle building underneath, powered by technology and productivity. The challenge is to manage risk carefully in the near term while staying positioned for the longer-term drivers that actually matter.
#Investing #StockMarket #ArtificialIntelligence #AI #Markets #MacroEconomics #WealthBuilding #Finance
ALT The market may correct this summer. The AI revolution is only just beginning. 🚀📉
1
6
284
Jun 5
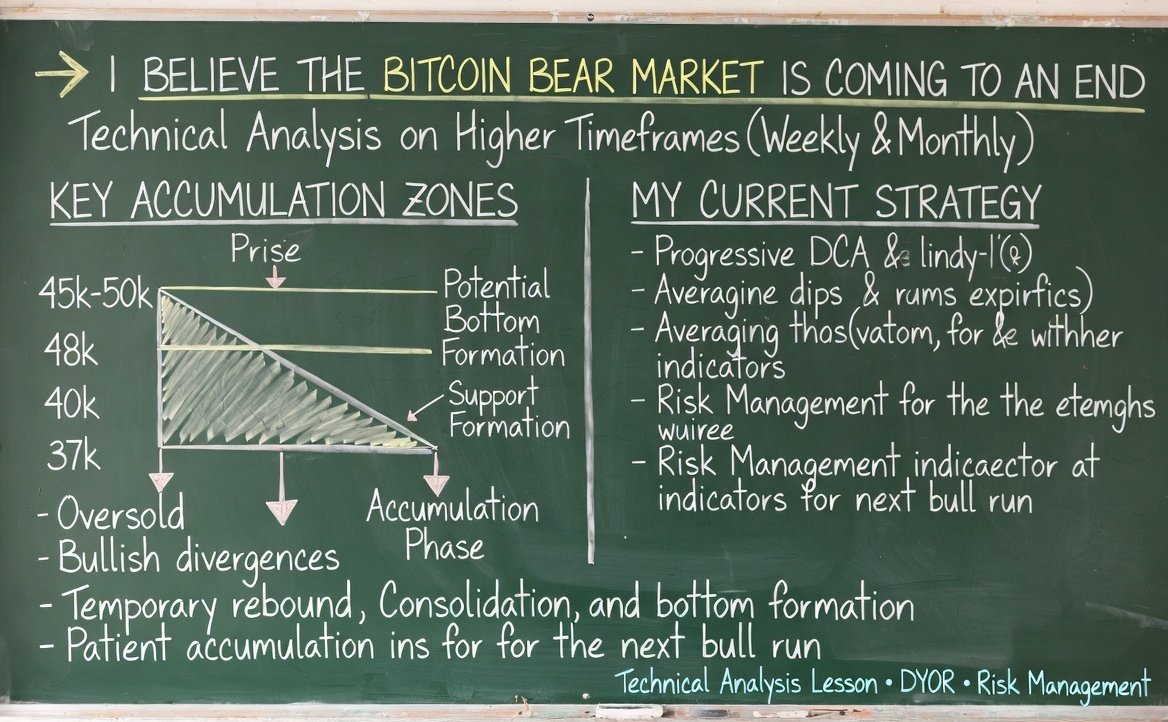
🚨 I believe the Bitcoin bear market is coming to an end. My current technical analysis:
After reviewing the charts on higher timeframes (weekly and monthly), I see clear signs of exhaustion in the downtrend. Bitcoin’s historical cycles usually form bottoms after strong capitulation and periods of heavy accumulation.
Key zones I’m closely watching:
Main accumulation base: Between 45k-50k. This is the area where I expect the price to potentially consolidate and build a solid foundation.
Progressive buying levels:
Around 48k as the first relevant support.
Lower down, zones like 40k and potentially 37k in a deeper correction scenario (to sweep liquidity and attract strong buyers).
Historically, these areas show strong demand and are where I plan gradual entries.
My strategy:
I’m using progressive DCA. I’m not going all-in at once; instead, I’m averaging in at the identified dips to improve my average entry price and manage risk better.
The indicators are showing extreme oversold conditions and bullish divergences are starting to appear. This doesn’t mean it will go up immediately, but it does suggest that the final phase of the bear market is near or already underway.
What I expect:
Possible temporary technical rebound.
A final phase of weakness or strong consolidation in the key zones.
Bottom formation and transition to the next bull market.
The bear market is the ideal time to accumulate patiently with a clear plan. History rhymes: those who accumulate smartly during these phases are usually the ones who benefit the most from the next bull run.
Where are you positioning yourself? Have you started averaging in or are you still waiting for more downside?
#Bitcoin #BTC #Crypto #BearMarket
1
7
2,638
Yulius retweeted
Jun 1
@saylor has achieved something truly pathetic: convincing thousands of deluded fools that betting an entire company on a single cryptocurrency is the pinnacle of financial intelligence.
Every time this guy ramps up the risk like an addict with no self-control, his devotees call him a “visionary.” Every time he burdens the company with absurd levels of debt, they crown him a “brilliant strategist.” And every time he buys more #Bitcoin, they act as if the guy has just reinvented the wheel for the second time.
This is the same Saylor who spent years repeating with a messianic straight face that he would **never sell a single Bitcoin in his life**, that it was an eternal conviction, that he would take it to the grave… and now, suddenly, he goes and sells 32 BTC without the slightest shame. What a shining example of coherence and honesty from the supposedly infallible genius.
The question his fans avoid like the plague is obvious: where does conviction end and the recklessness of an egomaniac who thinks he’s immortal begin?
Because turning #MicroStrategy into a leveraged Bitcoin proxy may seem brilliant while the market is rising. The problem comes when the wind changes and this “genius” has to prove he’s nothing more than a casino gambler in a fancy suit with empty speeches.
History is full of characters like Saylor who seemed infallible during bull markets. Anyone can look like a god when everything is going their way. The hard part is not ending up looking like an arrogant, irresponsible fool when reality slaps him square in the ego.
And meanwhile, the #crypto influencers — that bunch of opportunistic charlatans and professional bootlickers — never stop defending him and licking his boots. Every purchase was “historic” and “prophetic,” and now that he sells, they either spout ridiculous excuses or conveniently look the other way with their idiot faces. They are the same ones who make a living selling smoke and fear, the same ones who disappear when the market crashes, yet now strut around as if they themselves invented this clown’s strategy.
Saylor continues peddling absolute certainty with that modern-messiah smile, while a legion of second-rate influencers and dazzled followers confuse narcissism with wisdom and blind obsession with masterful strategy.
Maybe he’s right.
Maybe he’s just a man dangerously in love with his own myth, surrounded by a court of cowardly sycophants who applaud him because it benefits them and because they live off the circus he feeds.
But treating any criticism as heresy, swearing you’ll never sell and then doing it quietly, and celebrating every new purchase as a miracle is not financial analysis.
It’s a cult.
It’s fanaticism disguised as investment.
And the crypto influencers who push him are nothing more than the cheap priests of this circus, getting paid to keep the illusion alive while the risk keeps growing and the hypocrisy drips from every corner.


2
1
8
713
Jun 3
Today Bitcoin Decides Everything: Real Rebound or Confirmation of the Drop I’ve Been Warning About?
Hey everyone, this is Yulius. As always, straight analysis with no hype or filler. For several weeks now I’ve been warning about the structural weakness #Bitcoin has been showing, and right now the price is validating exactly what we’ve been watching. This isn’t a surprise — it’s what happens when the technical structure is respected.
After the strong correction we anticipated, the market tried a weak rebound. But in the last few hours we’ve seen a clear breakdown of key levels. This isn’t noise — it’s confirmation. Bitcoin is at a critical inflection point where we’ll decide if the rebound dies here or if we enter a deeper correction, just like I’ve been outlining in previous analyses.
What I’m seeing on the chart right now:
Critical support zone around $64,800 – $65,000:
If we lose this zone with volume and conviction, the next downside target I’ve been pointing out is the $60,000 – $58,000 area, where there’s significant liquidity and a potential deeper test.
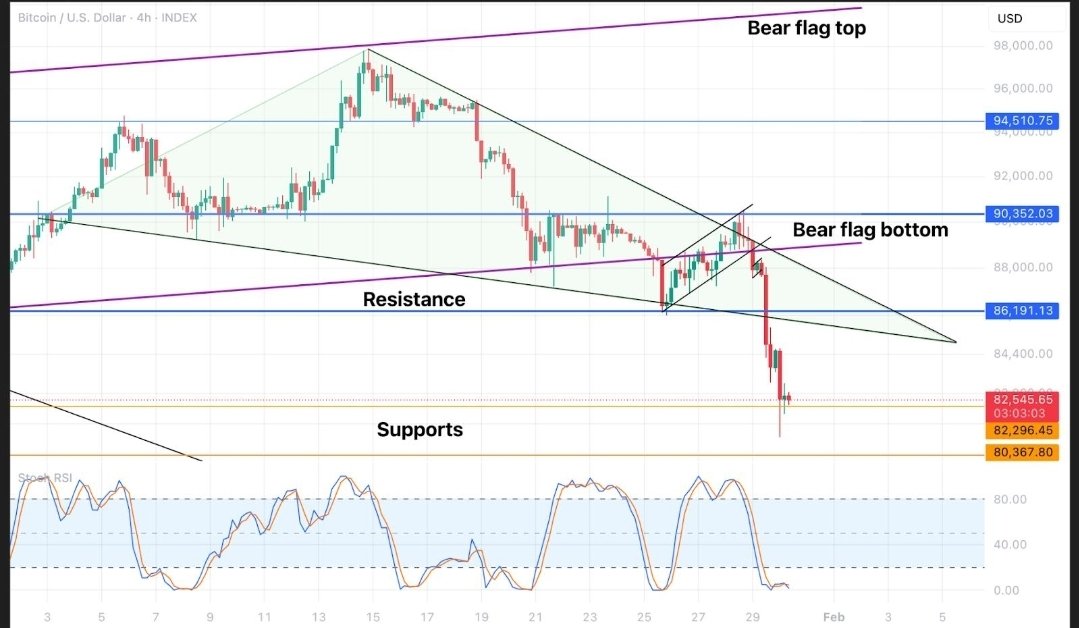
Bear flag pattern playing out (exactly as warned):
Divergences, structure & key levels:
Liquidations & market pressure:
My stance remains exactly what I’ve been repeating on the channel: maximum caution. I’m not jumping into aggressive longs without clear confirmation. I prefer to wait for a solid recovery above important resistance (around $68k–$70k) with strong volume and a structural shift before considering the rebound has real strength.
If we break below $64.8k with force, the bearish scenario I’ve been warning about becomes much more probable.
What I personally apply and always recommend on @cryptoyulius:
- Strict risk management: never risk more than 1-2% per trade.
- Look for confirmations on higher timeframes (1H and 4H).
- Always set your stop-loss before entering.
- Discipline above everything. FOMO and fear are a trader’s worst enemies.
This analysis is the direct continuation of what I’ve been saying: the crypto market is fragile and you have to trade with a cool head. Today Bitcoin defines the short-term direction. Either it defends the support and reactivates the rebound, or it confirms the weakness and we continue lower.
I keep the same message: protect your capital, trade with probability on your side, and stay emotionless.
If you want to join my weekly trading lives, real-time updates, and more detailed analysis, follow me
Stay disciplined and trade smart. ⚙️
(This is not financial advice. Educational technical analysis only. Invest only what you can afford to lose.)


8
212
May 27
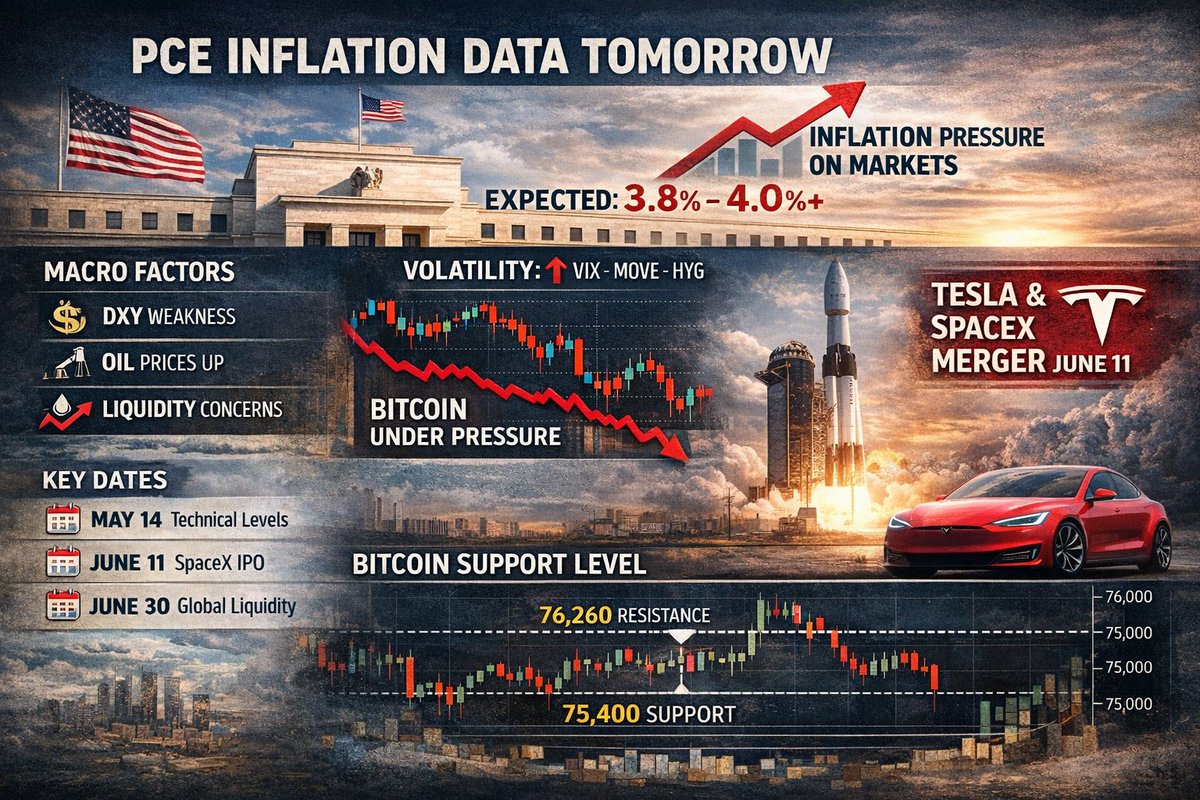
In the next 24 hours, a decisive macroeconomic event will take place that could shape the short- and medium-term behavior of #Bitcoin and the broader #crypto market: the release of the #PCE (Personal Consumption Expenditures) inflation data, the preferred inflation indicator of the #FederalReserve.
🌍 Current Macroeconomic Context
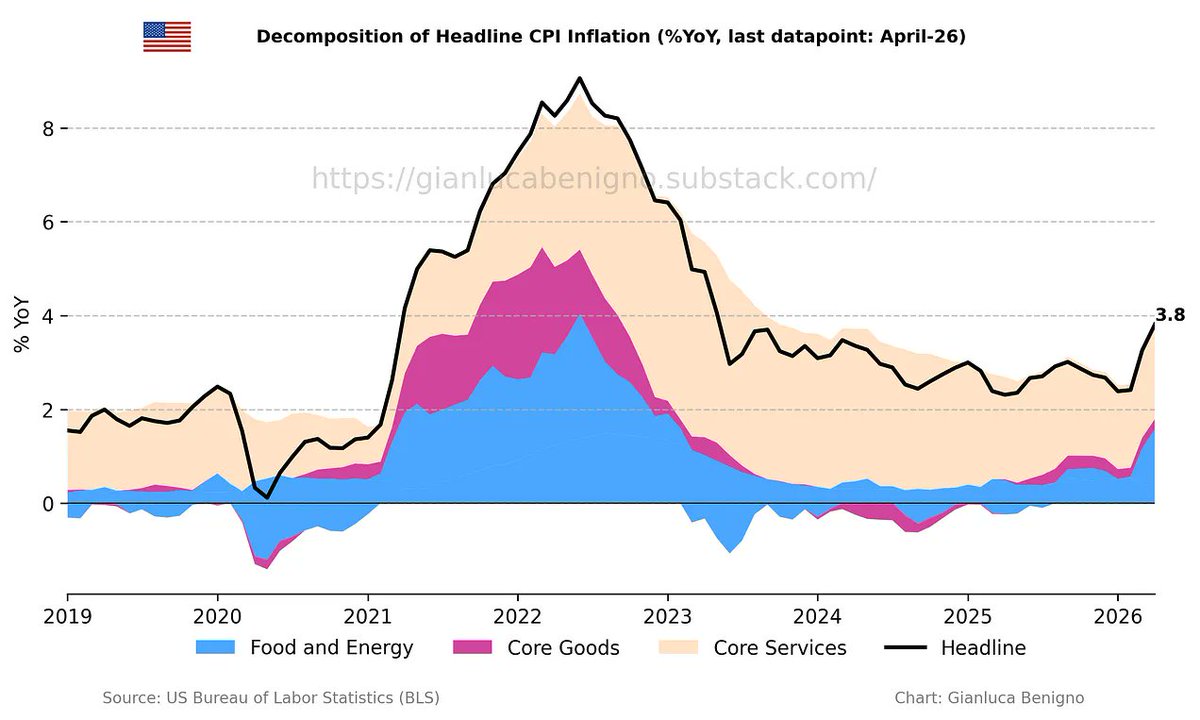
I anticipate a worse-than-expected PCE inflation reading. Both April’s #PPI and #CPI surprised to the upside, making it likely that the PCE will also print higher, potentially approaching or exceeding 3.8–3.9%. In a more adverse scenario, it could even reach levels close to or above 4%, something not seen in nearly four years.
This adjustment would force markets to price in persistent inflation, potentially increasing pressure on risk assets. Beyond the data itself, there are additional concerns tied to global liquidity, which has declined and significantly stagnated. While there is no immediate liquidity crisis, this stagnation is becoming increasingly concerning.
📉 Volatility and Liquidity Indicators
• The #DXY (U.S. Dollar Index) is showing structural weaknesses that could influence Bitcoin’s movement.
• Oil prices are displaying bullish pressure.
• Volatility indicators (#VIX, #MOVE, and #HYG) reflect a stressed environment in fixed income and liquidity markets. The MOVE index (bond volatility) is declining, which is positive, but it does not offset the broader pressures.
📅 Key Dates and Events
• PCE release: Tomorrow, expected to be the main volatility catalyst.
• May 14: Relevant date in technical and liquidity analysis.
• June 11: Start of #SpaceX trading, an event that could generate euphoric sentiment in related markets and trigger a temporary rebound in Bitcoin and equities.
• June 30: Another key date for the global liquidity index.
June 11 stands out in particular due to the potential merger between #Tesla and SpaceX, creating an entity valued at more than $3.5 trillion. This catalyst could fuel a short-term rebound in Bitcoin, although current candlestick patterns are not especially bullish.
🚀 Opportunities in the Space Sector
₿ Bitcoin Technical Analysis – Key Hotspots
On the hourly Bitcoin chart, we have narrowly defended a crucial support block. It is essential not to lose the 75,400 USD zone. We are currently bouncing from the early morning lows.
The most relevant hotspots are:
• Key upper zone: 76,260 USD — located in the center of two order blocks. It is likely to be tested either before or after the PCE release.
• The lower block must hold to avoid further deterioration.
The immediate objective in daily #trading points toward these hotspots, always subject to confirmation of market structure and the outcome of the inflation data.
📈 Outlook for Altcoins
The current environment offers selective opportunities in #altcoins. Some projects are showing favorable technical setups and strong narratives (including those linked to the space sector). I will analyze the best configurations in greater detail in future reports, prioritizing those with the strongest risk-to-reward ratios in the event of a generalized rebound.
⚠️ General Scenario and Strategy
The short term will heavily influence the medium term. I expect elevated volatility following the PCE release. The move “that nobody expects” could materialize if inflation surprises significantly to the upside, generating a reaction contrary to consensus expectations.
I recommend:
• Strict risk management.
• Continuous monitoring of the identified technical levels.
• Selective diversification into strong narratives such as the space sector.
• Preparation for possible temporary rebounds around events like the SpaceX listing.
Markets are inherently volatile. Any investment decision should be based on your own analysis, risk tolerance, and professional advice when necessary. This report reflects my current assessment of the macroeconomic, technical, and sectoral environment as of May 27, 2026.
ALT PCE Inflation Report — Market Impact Analysis
6
312
May 26
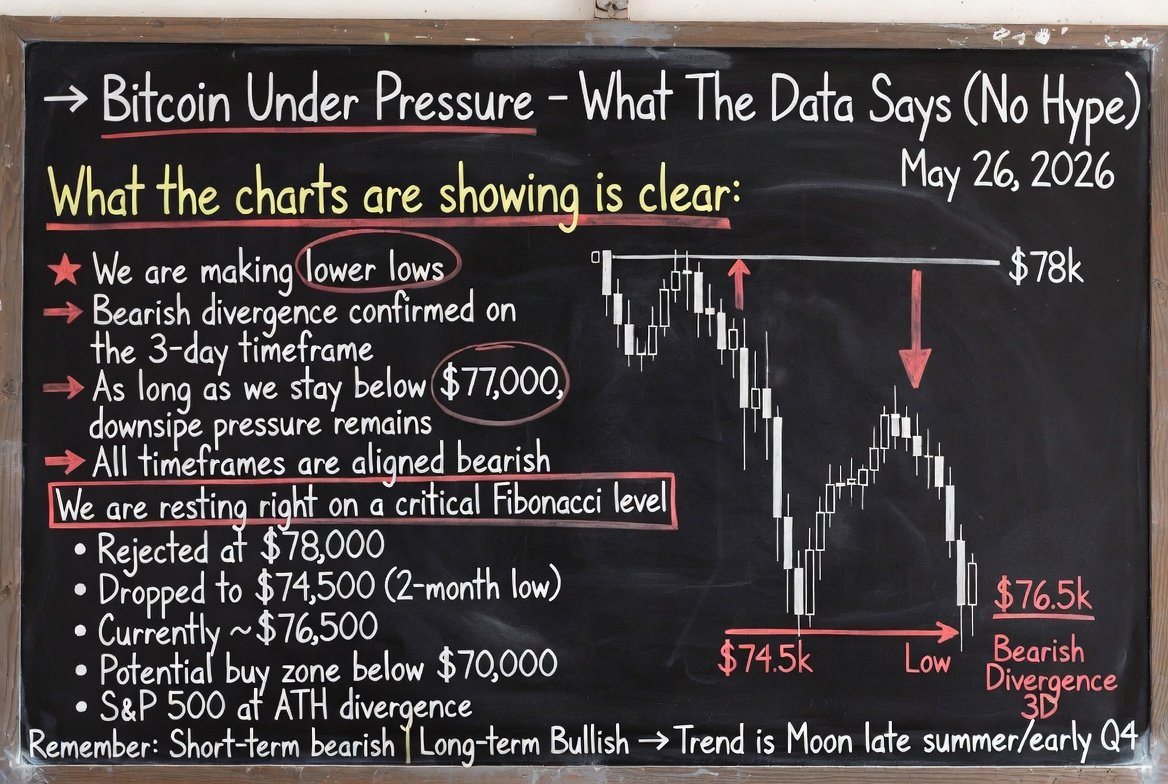
🚨 Bitcoin under pressure… here’s what the data says (no hype)
Hey team,
Over the last two weeks we’ve been talking about sideways and bearish price action in #Bitcoin… and the market finally reacted.
📉 Today: • Rejected once again at $78,000
• Dropped to $74,500 (2-month low)
• Currently trading around $76,500
What the charts are showing is clear:
🔻 We are making lower lows
🔻 Bearish divergence confirmed on the 3-day timeframe
🔻 As long as we stay below $77,000, downside pressure remains
🔻 All timeframes are aligned bearish
🔻 We are resting right on a critical #Fibonacci level
Is Bitcoin about to “crash”?
Not necessarily a total collapse… but it is realistic to expect more downside movement toward previous ranges.
📌 Personally, I’d be very interested in buying again below $70,000.
Meanwhile, the S&P 500 keeps closing at all-time highs… an interesting divergence between crypto and traditional equities.
Remember: We #trade the current trend (which remains bullish long term), but we respect what the data shows in the short to medium term.
🚀 “Trend is moon” into late summer / early Q4.
2
7
920
May 25
Bitcoin Liquidity Trap Technical Analysis
#Bitcoin is currently in a phase of high liquidity manipulation, where the price is setting up a classic trap designed to sweep stops and positions of retail investors before a strong directional move. This structure is typical in cryptocurrency markets, where large players (whales and market makers) induce false breakouts or breakdowns to generate massive liquidations.
Current Price Structure
The #chart shows compression on intermediate timeframes (4H and daily), with price oscillating in a tight range near key liquidity zones. This indecision is intentional: it accumulates pending orders both above and below the current price.
Upper Liquidity Zone (Potential #BullTrap): Around 78,000 - 82,000 USD. A sweep of recent highs would clear stops from leveraged long positions and liquidity above recent peaks, creating a false bullish breakout and attracting FOMO before a bearish reversal.
Lower Liquidity Zone (Potential #BearTrap): 70,000 - 72,000 USD (and lower toward 68,000). A sweep of lows would liquidate aggressive shorts and trigger institutional buy orders, fueling a subsequent bullish squeeze.
Most traps in this cycle resolve with an initial deceptive move followed by the real opposite direction, with high volatility in the following 24-72 hours once triggered.
Key Technical Indicators
Moving Averages: Price constantly interacts with the 50 and 200-period EMAs on the daily chart. A clear rejection at the EMA 50 (currently acting as dynamic resistance) strengthens the bull trap scenario.
#RSI and Momentum: Bearish divergences visible on daily and weekly timeframes, indicating exhaustion during rebounds. On 4H, RSI shows quick overbought conditions on short rallies — typical of liquidation setups.
Volume and #OrderFlow: Decreasing volume during recent bullish attempts → lack of real conviction. Exchange liquidity heatmaps show dense clusters above the highs, ideal for sweeps.
Patterns: Possible double top or bear flag formation on the daily chart, within a larger consolidation range. The structure resembles 2022 patterns where liquidity was swept before major macro moves.
Probable Scenarios
1. Bearish Scenario (Bull Trap - more aligned with cautious outlook):
Bitcoin rises toward 78k-80k, liquidates leveraged longs, then drops sharply toward 70k-65k. This would clear upper liquidity and create capitulation, setting the stage for the next bullish leg in the cycle.
2. Bullish Scenario (Bear Trap):
Quick sweep of lows (~72k), liquidation of shorts, and strong squeeze toward 85k . Elevated funding rates favor this move if triggered.
The macro context (correlation with Nasdaq/SPX and ETF flows) increases the probability of extreme volatility. The key is not to trade the obvious move: wait for confirmation with sustained volume and a candle close outside the current range.
Conclusion and Risk Management
We are facing an imminent liquidity trap designed to unbalance retail traders. The best position is to stay in cash or with very reduced exposure until the structure resolves. Monitor especially the 76k level (immediate support) and 80k (critical resistance). Any trade should have tight stops and a minimum risk-reward ratio of 1:3, given the unpredictable nature of these setups.
This analysis is based on price action, liquidity concepts (ICT/SMC), and Bitcoin’s historical behavior. Remember that markets are highly volatile and this is not financial advice.
8
923
May 24
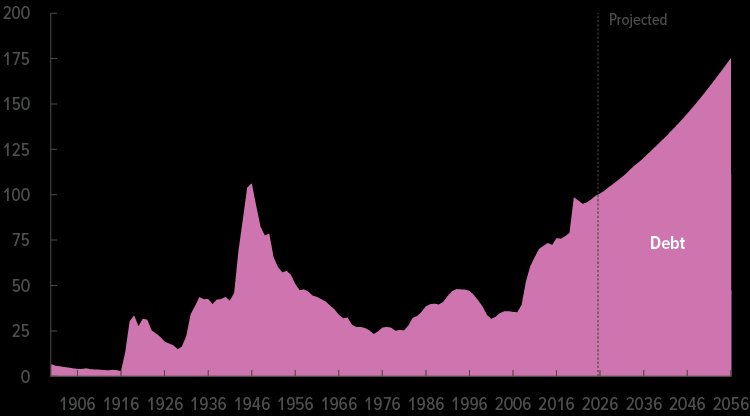
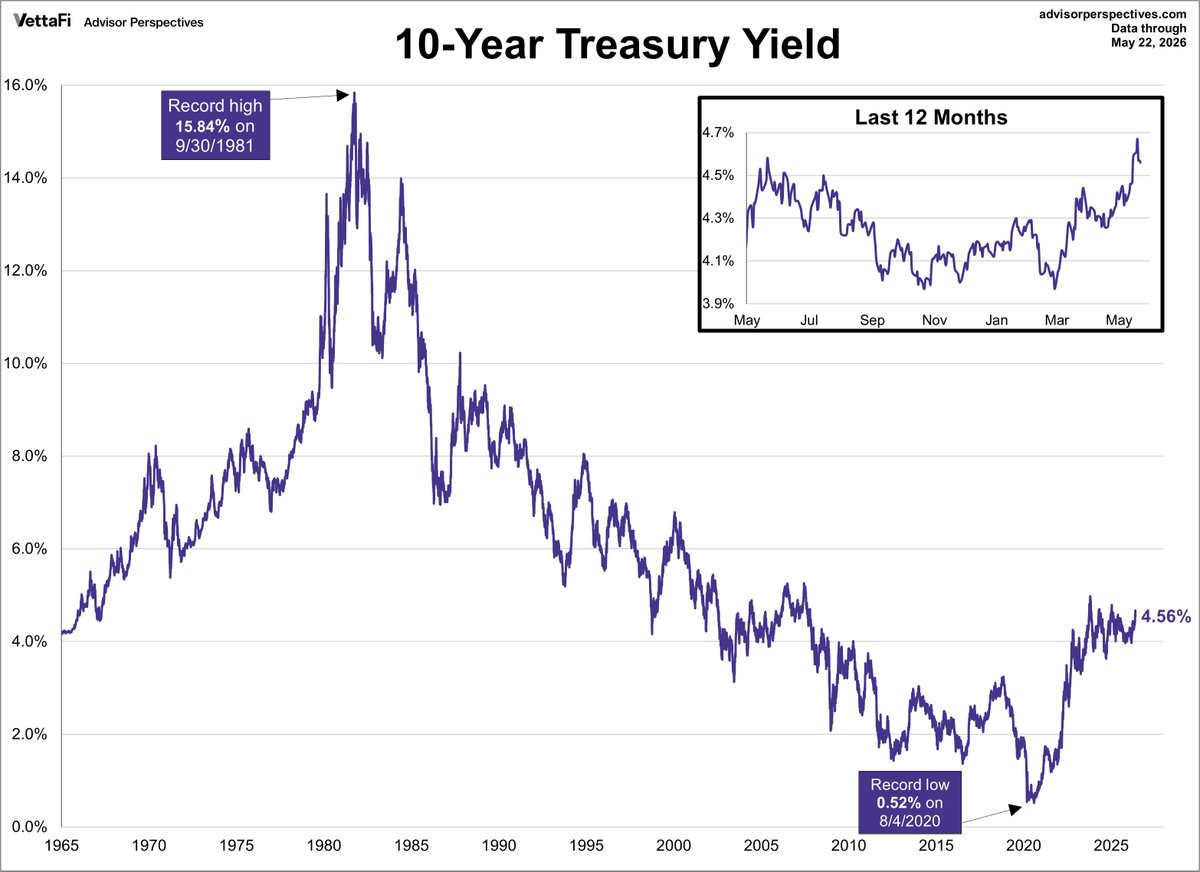
Do you realize how serious it is for the US 30-year Treasury yield to break above 5.16%?
It means the market is starting to question the sustainability of US debt.
And when the bond market speaks…
Wall Street listens.
Right now we have:
• record debt
• exploding interest costs
• sticky inflation
• chronic money printing
• and the worst geopolitical backdrop in decades
But sure, mainstream media keeps talking about Bitcoin moving 3%.
The real bomb is in the bond market.
And almost nobody is paying attention.
1
6
187
May 24
Bond markets rarely lie.
And right now, they’re saying something very uncomfortable.
3
110
May 21
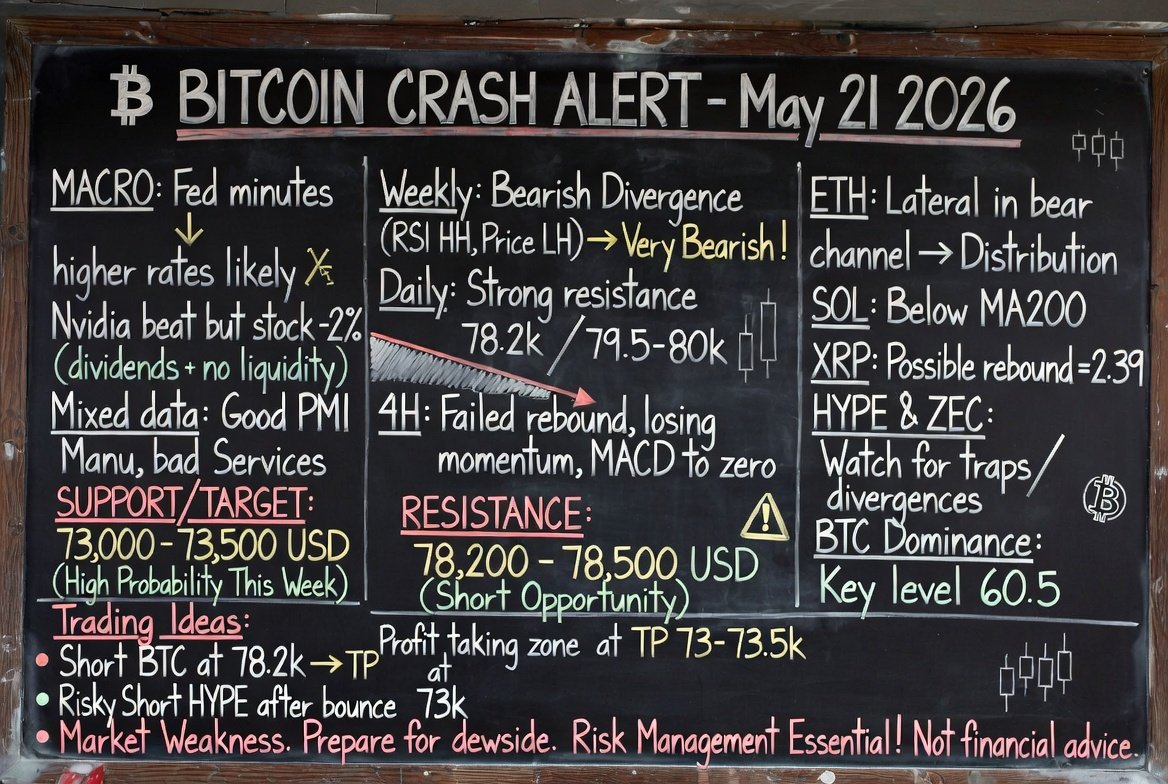
Bitcoin is showing clear signs of weakness.
And the market could be preparing for another major downside move.
1/ #Bitcoin failed to bounce even after Nvidia delivered earnings far above expectations.
When markets stop reacting to good news, it usually signals underlying weakness.
The most likely scenario still points toward the $73,000–73,500 zone.
2/ Macro conditions are not helping either.
The latest #Fed minutes suggest rate hikes are now more likely than cuts.
Less liquidity = more pressure on risk assets.
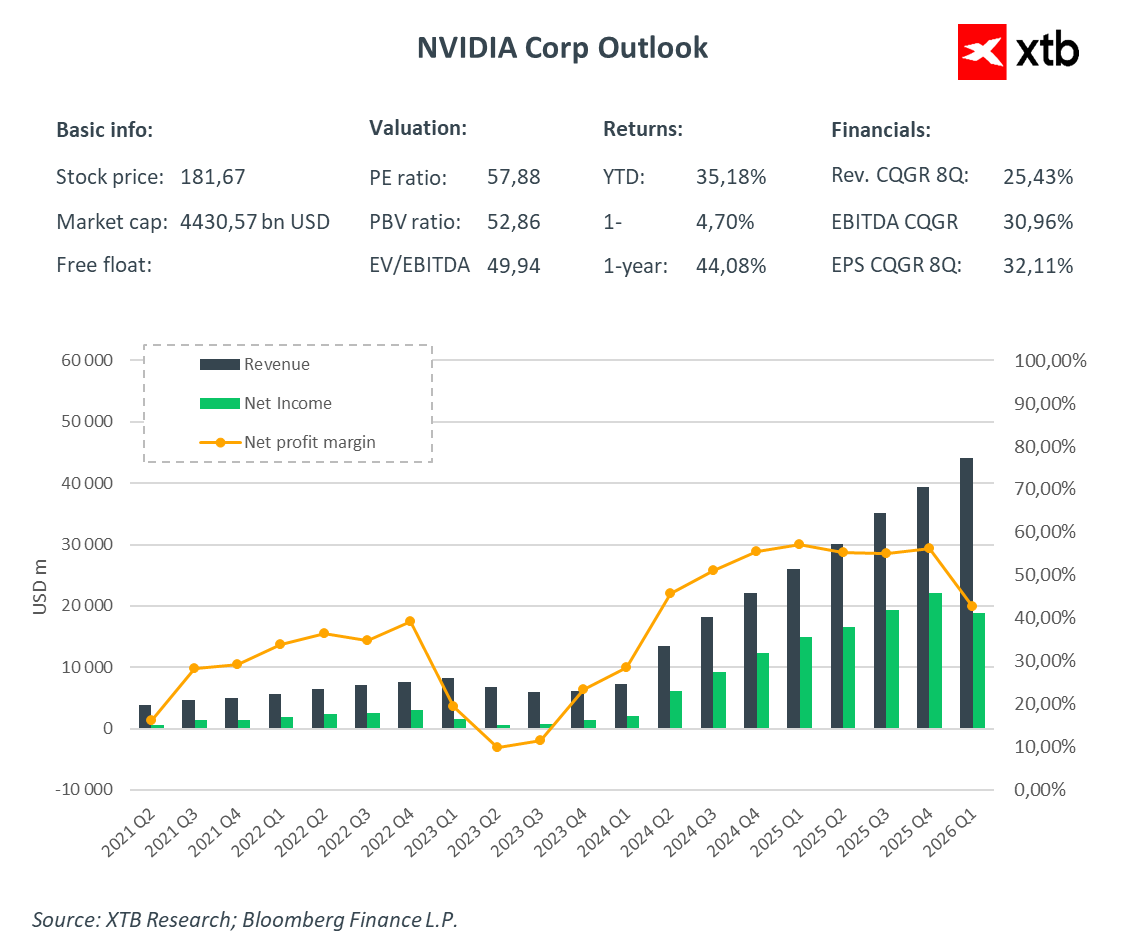
3/ #Nvidia posted outstanding results, yet the stock still dropped.
This does not look like the AI narrative is breaking.
It looks more like a liquidity problem across the broader market.
4/ From a technical perspective, Bitcoin continues to weaken.
On the weekly chart, a major bearish divergence is forming:
• #RSI is making higher highs
• Price is making lower highs
The last similar structure appeared near the 2025 all-time highs.
5/ On the daily timeframe, Bitcoin remains trapped below major resistance zones:
• $78,200–78,500
• $79,500–80,000
Each rebound attempt is losing momentum.
6/ The 4H chart is probably the most concerning signal right now.
Bitcoin:
• Failed to reclaim the MA200
• Failed to break back above 79k
• Has been ranging sideways since May 18
At the same time:
• #MACD momentum is fading
• Hidden bearish divergences are appearing
Sideways consolidation after a sharp drop often leads to continuation lower.
7/ Key levels are now very clear:
Resistance:
$78,200–78,500
Main downside target:
$73,000–73,500
High probability of testing that zone within the next few days.
8/ If Bitcoin reaches 73k, there are two possible outcomes:
• Strong rebound toward 85k
• Breakdown of the channel and further downside acceleration
The analyst currently leans toward the bearish breakdown scenario.
9/ #Altcoins are not showing much strength either.
#Ethereum remains inside a bearish channel.
#Solana still cannot reclaim structural strength.
#XRP could see a technical bounce, but trend reversal signals remain absent.
10/ Special attention on HYPE and ZEC.
Both show relative strength, but also significant bearish divergences.
#HYPE in particular is flashing potential bull trap signals after making new highs.
11/ Traditional markets are not helping either.
• #Nasdaq remains flat despite Nvidia earnings
• #Gold and silver continue to consolidate
• #Oil remains in a macro-sensitive range
Overall conditions still look fragile.
12/ Conclusion:
The #market continues to show structural weakness and fading momentum.
The key area to watch now is how Bitcoin reacts if it revisits the 73k zone.
Until then: caution and risk management remain essential.
1
6
1,377
May 20
🚨 TODAY: The Macro Moment That Could Reshape 2026 Market Sentiment
FOMC Minutes (2:00 PM ET) NVIDIA Earnings (after close).
Two high-conviction catalysts colliding in one session, directly impacting rates outlook, liquidity, growth valuations, and the AI capex cycle.
Precise Technical-Macro Breakdown:
- FOMC April Minutes: Expected to highlight internal divisions (multiple dissents already signaled). With yields climbing, oil above $100, and the post-Powell transition underway, traders will scan for hawkish bias (fewer 2026 cuts) versus data-dependent language. A restrictive tone risks pressuring equity multiples and lifting the USD, DXY, and real yields.
- NVIDIA Q1 FY2027 (consensus ~$78-79B revenue, ~$1.76-1.78 EPS): The definitive gauge of global AI infrastructure demand.
Key focus areas:
• Gross margins amid Blackwell ramp and competition.
• Q2 full-year guidance, especially data center momentum and China exposure.
• Updates on Rubin architecture and enterprise adoption.
Implied move: ±6-6.5% (potential $350B market-cap swing).
NVDA has a strong history of beating estimates, but “sell-the-news” reactions and cautious guidance have previously triggered sharp rotations across semis.
Probable Scenarios:
• Bull Case: Dovish-leaning minutes NVDA blowout → Nasdaq breakout, VIX compression, broad risk-on.
• Base Case: Mixed Fed tone solid in-line guidance → Sector rotation and consolidation.
• Bear Case: Hawkish Fed tilt soft guidance → Yield spike, multiple compression, and tech pullback.
Bottom Line:
This isn’t panic — it’s risk repricing.
Manage position sizing, deploy dynamic stops, and let real price action dictate the next move. Elevated implied volatility exists for a reason: today sets the tone for the coming weeks.
Stay disciplined. The edge belongs to those who react to facts, not hype.
#NVIDIA #NVDA #FOMC #FedMinutes #EarningsSeason #AI #BigTech #Semiconductors #MarketVolatility #Trading2026
4
200
May 20
Most technical analysis on altcoins is incomplete.
You see:
Perfect bull flags
Clean triangles,
Respected support levels,
Bullish divergences,
Flawless projections.
And yes, many of those analyses are technically well executed.
But most of the time, the most important chart in the market is missing: Bitcoin.
Because an altcoin does not trade in a vacuum.
You can have the best-looking bull flag on your favorite altcoin, but if BTC loses a key level and drops 4%, chances are:
The structure gets invalidated,
Support breaks
LIquidations accelerate,
FEar enters the market,
And the altcoin ends up dropping 10–15% within hours.
Not because technical analysis doesn’t work.
But because the analysis itself was incomplete.
Most altcoins have:
Structural correlation to BTC,
Lower liquidity,
Thinner order books,
Higher volatility,
And a far more aggressive beta.
In practice, many altcoins behave like:
Leveraged Bitcoin.
Typical market move:
BTC -4%
ETH -6%
mid caps -10%
low caps -15% or worse
This is where visual analysis and professional market analysis become two very different things.
The amateur question is:
“Does the altcoin look bullish?”
The professional question is:
“Does this structure remain valid if BTC corrects?”
Because context matters more than the isolated pattern.
The strongest traders do not analyze only the altcoin:
They analyze BTC structure,
BTC dominance,
Market liquidity,
Capital flows,
Overall momentum,
And only then the altcoin itself.
A mediocre altcoin can rally aggressively simply because BTC breaks resistance and fresh money enters the market.
And on the other side: a technically perfect altcoin setup can completely collapse within minutes if BTC loses support.
Analyzing an altcoin without analyzing BTC is like analyzing a boat while ignoring the condition of the ocean.


5
186
Yulius retweeted
May 18
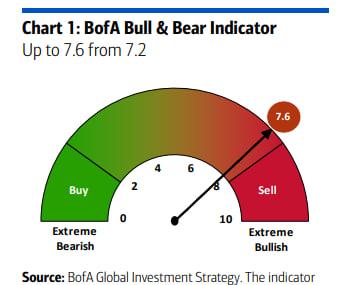
The Bank of America Bull & Bear Indicator just hit 7.6 and is skyrocketing.
Sell signal triggers above 8
Last December it crossed 8… and the market corrected hard shortly after.
Now it’s happening again — while CPI inflation is climbing (already at 3.8%). History shows when inflation pushes above 4%, markets get fragile 3-6 months later.
Nvidia is still pumping, but positioning is at extreme euphoria levels.
Correction coming… or more upside?
What’s your vote?
2
6
539