
Joined May 2020
- Tweets 36,215
- Following 7,240
- Followers 3,449
- Likes 89,791
12,817 Photos and videos


1
104
$HYPE freee technical analysis
youtube.com/watch?v=IWrbrr_T…
Jun 14

I was looking back at the mistake I made when analyzing $HYPE, and I finally identified where I went wrong.
I was correctly tracking the five-wave move to the downside, but when it came time to project the Wave 5 target, I accidentally used a Fibonacci retracement instead of a Fibonacci extension. Because of that mistake, I underestimated the downside target and completely missed the move.
I've corrected that error on my chart now and have the proper Fibonacci extension applied.
Looking at the current structure, I'm viewing the move as an ABC correction. You could make the argument that the B wave is already in place. Personally, I don't think the structure looks ideal for a completed B wave, but it is possible considering the reaction came from roughly the 50% retracement of Wave A.
If that interpretation is correct, then the next thing I want to see is price break above the descending trendline currently visible on the chart. A breakout through that trendline and a move above the Wave 4 high would strengthen the case that Wave C is underway.
If that scenario does not play out, then I'll be watching for a deeper retracement into the Golden Pocket, potentially extending toward the 0.786 retracement level. Should price reach that area, I'll be looking closely for a long opportunity based on the price action that develops there. One possible setup that could emerge is an inverse head-and-shoulders formation.
Another piece of confluence that stood out to me is the centerline of the parallel channel. Interestingly, the Wave 5 completion occurred right at that centerline, adding another layer of technical support to the area and helping validate the significance of that low.
For now, the key question is whether the current structure has already completed its B wave and is preparing for a Wave C advance, or if one final retracement is needed before the next meaningful move higher can begin.


83
are yall paying attn to the daily freee technical analysis here? U getting all this freee follow her for more valueable content on crypto and stocks #btc $eth $zec $tao $xrp $link $spcx $meta $aapl $msft $nflx $hype
Jun 14
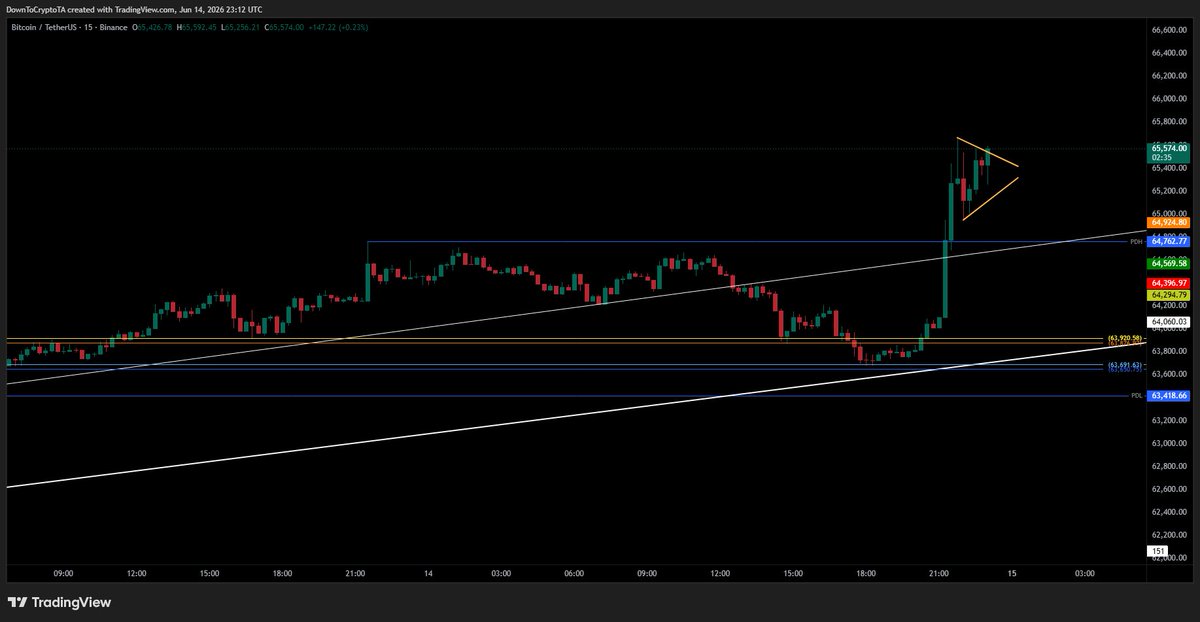
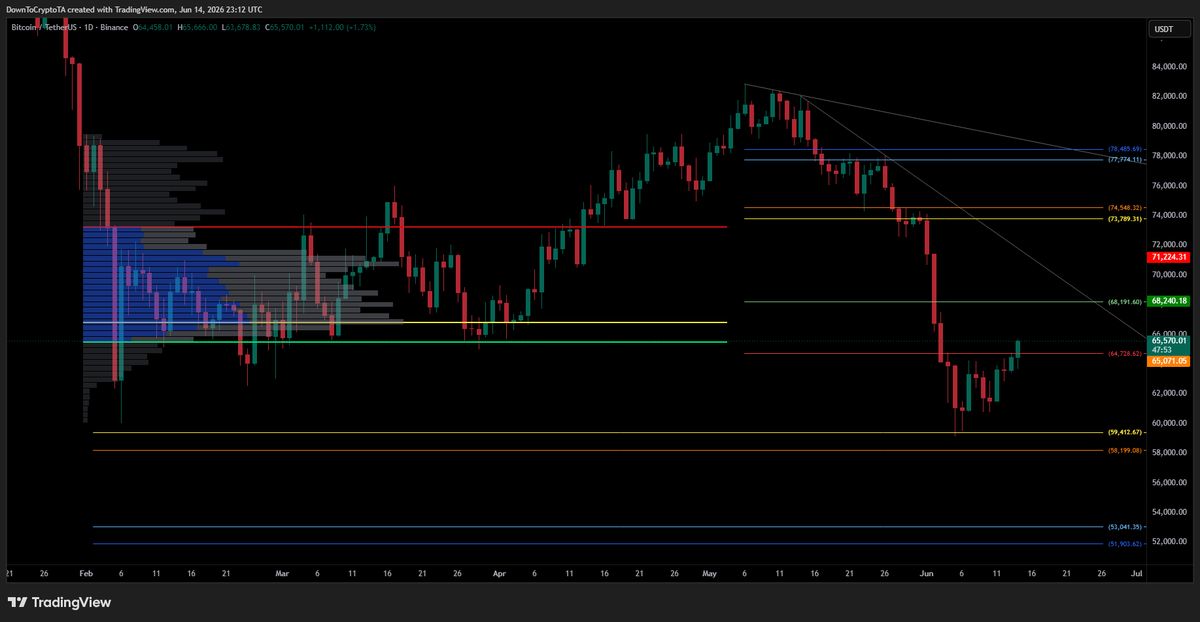
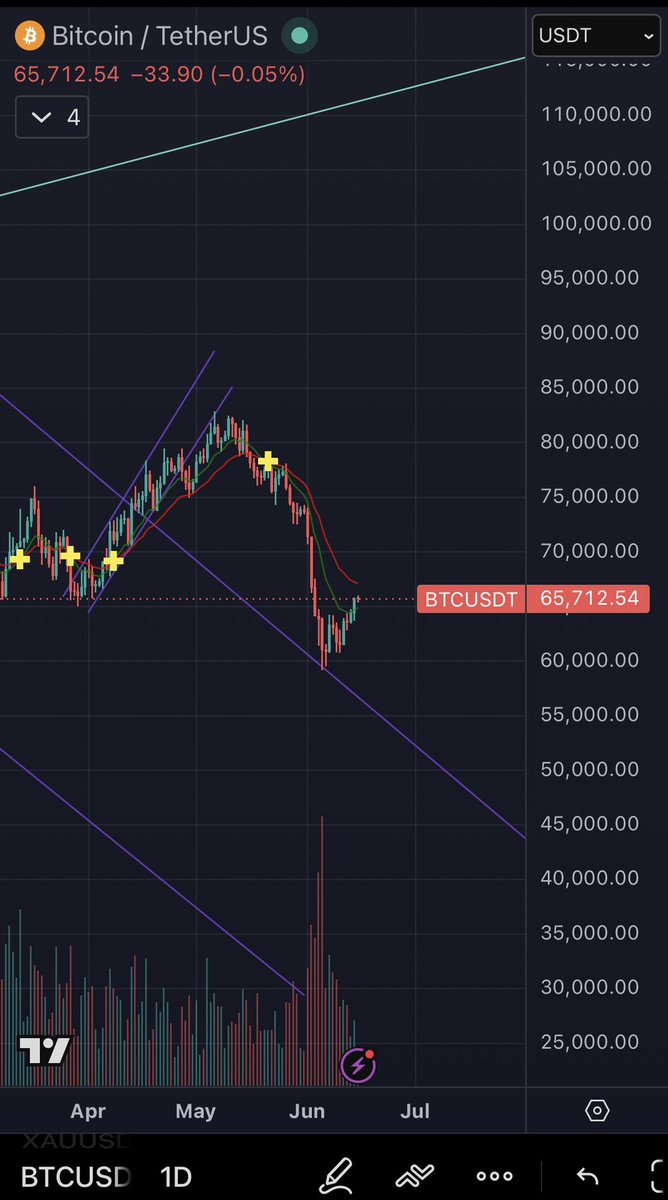
The last thing I expected was for #Bitcoin to get a successful backtest of the breakout. My assumption was that the breakout itself was more of an overshoot than a sustainable move higher.
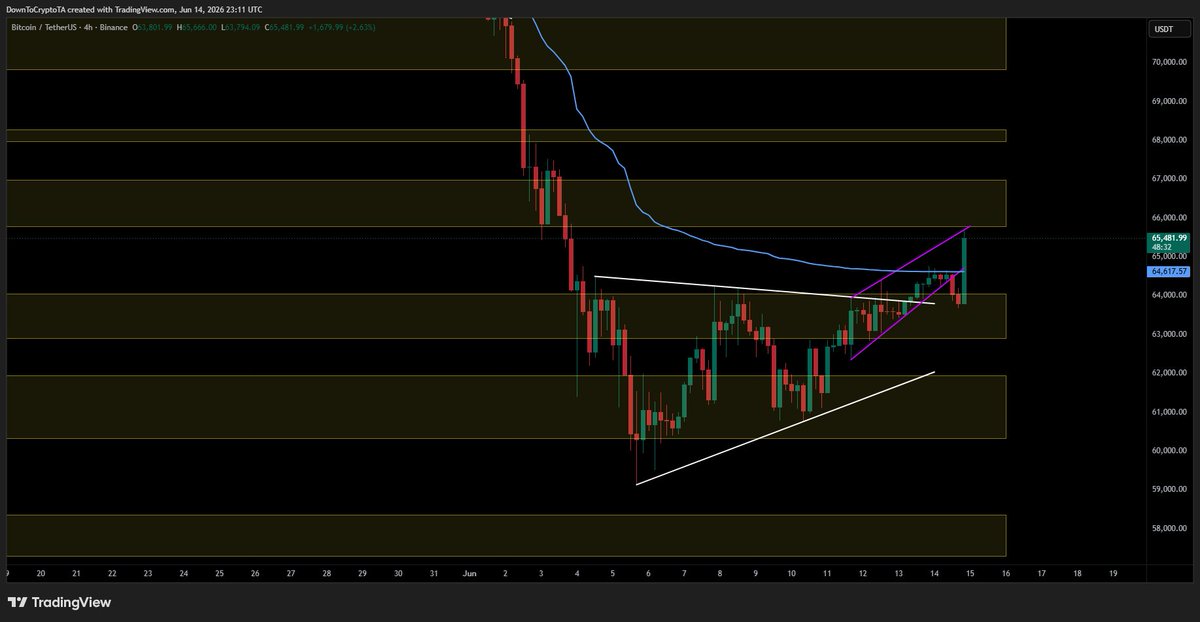
Leading into the breakdown, price had been overlapping within a rising structure while simultaneously showing bearish divergence at the highs. Because of that, when we finally broke down from the pattern, I expected Bitcoin to rotate lower into the Golden Pocket retracement zone and potentially backtest the underside of the larger triangle structure. Given the lower liquidity conditions that we often see over the weekend, that seemed like the more probable outcome.
Instead, we saw a significant surge in volume push price back to the upside. That move carried Bitcoin directly into the Value Area Low of the broader range, which is now becoming an important area to monitor.
If Bitcoin can successfully reclaim and hold above the Value Area Low, then I think there is a reasonable case for continuation higher, with the 0.382 Fibonacci retracement level becoming the next area of interest.
That said, I'm generally not eager to trade aggressively over the weekend. Weekend price action can be deceptive due to thinner liquidity conditions, and I prefer to see how the market behaves once traditional market participants return.
What is encouraging is that the Value Area Low is producing a reaction. On the lower timeframes, specifically the 15-minute chart, price appears to be forming a triangle pattern that could potentially develop into a bull flag. If that structure resolves to the upside and price can maintain acceptance above the Value Area Low, it would strengthen the bullish case heading into next week.
For now, I'm remaining patient. The reaction at the Value Area Low is constructive, but I want to see confirmation before assuming this move has enough strength to continue higher.
187


2
15
252

ʙᴜɪʟᴅɪɴɢ ᴠᴀʟᴜᴇ ᴏɴ-ᴄʜᴀɪɴ: ᴛʀᴏɴ ɪɴᴄ. ꜱᴜʀᴘᴀꜱꜱᴇꜱ 700ᴍ ᴛʀx ɪɴ ᴛʀᴇᴀꜱᴜʀʏ ʜᴏʟᴅɪɴɢꜱ
The playbook is becoming increasingly clear: companies are no longer just building around digital assets—they’re strategically accumulating them.
Tron Inc. (NASDAQ: TRON) has acquired an additional 157,392 TRX at an average price of $0.3177, bringing its total treasury holdings to more than 700.4 million TRX.
This isn’t merely a balance sheet update. It’s a statement of long-term conviction.
As institutional participation in blockchain continues to mature, treasury strategies are evolving beyond traditional cash reserves. By steadily expanding its TRX treasury, Tron Inc. is aligning shareholder exposure with the growth of one of the industry’s most active blockchain ecosystems.
What stands out is the focus on Digital Asset Treasury (DAT) growth. Rather than viewing TRX as a speculative holding, the company is positioning it as a strategic reserve asset designed to potentially enhance long-term shareholder value.
The broader implication is worth noting:
More public companies are exploring blockchain-native treasury strategies.
Digital assets are increasingly being viewed as productive balance-sheet assets rather than passive investments.
Long-term accumulation signals confidence in the underlying network’s future utility and adoption.
With over 700 million TRX now held in treasury, Tron Inc. continues to strengthen its alignment with the expanding TRON ecosystem—an ecosystem powering millions of daily transactions, growing stablecoin activity, and increasing global blockchain adoption.
In a market often focused on short-term price movements, strategic accumulation tells a different story: conviction, patience, and a belief that blockchain infrastructure will continue to capture value as digital economies scale.
The message behind today’s purchase is simple: when institutions believe in the future of a network, they don’t just participate—they accumulate.
@justinsuntron @trondao #TRONEcoStar


2
112
now our $RSR @reserveprotocol can hit $1??????
Jun 15

bitcoin:native bounced perfect from the trendline
maybe we reached here the bottom with positive news incoming the odds are very good for
1
1
157
The Knicks won....how does this improve your life ? Asking for a fren
35

Tron Inc. (NASDAQ: TRON) acquired 157,392 TRX tokens today at an average price of $0.3177, further increasing its TRX treasury holdings to more than 700.4 million TRX in total. The company aims to further grow its Tron DAT holdings to enhance long term shareholder value. For live update on the designated on-chain TRX treasury wallet for Tron Inc., please refer to: tronscan.org/#/address/TEySE….
2
168
3
94