
She/her. #SciComm ✏️ at USGS Water. My views and opinions are my own.
- Tweets 5,175
- Following 400
- Followers 409
- Likes 15,351


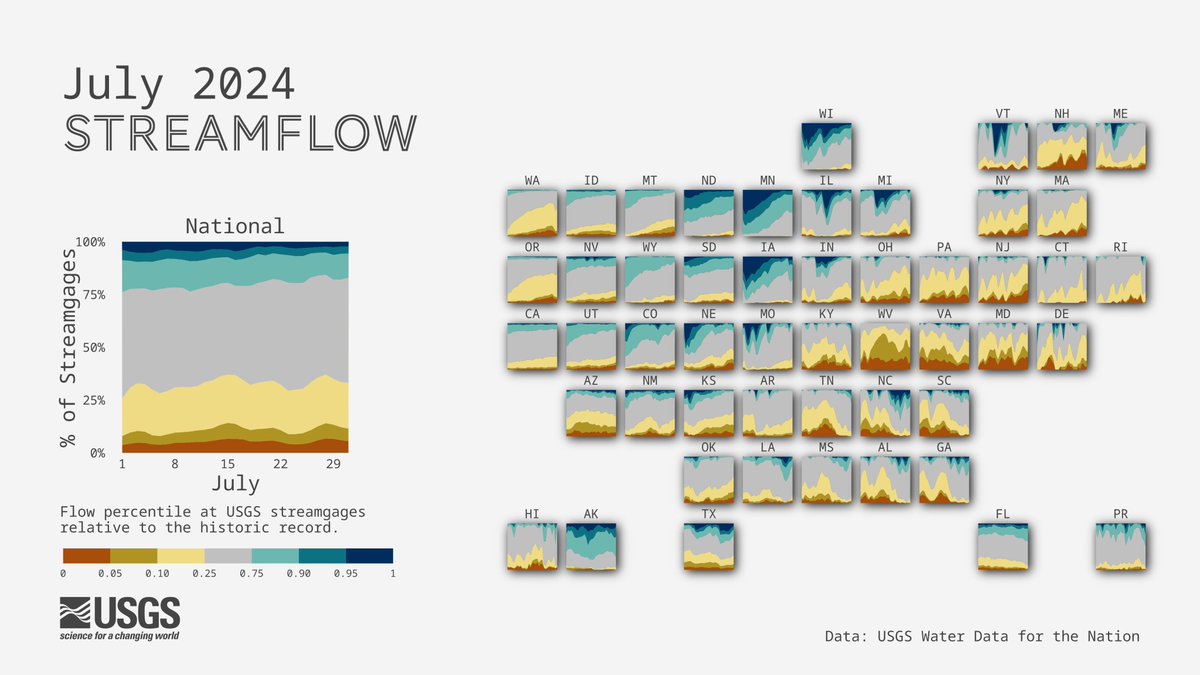
ALT A tile map of the U.S. showing streamgages by flow levels through the month of July 2024. For each state, an area chart shows the proportion of streamgages in wet, normal, or dry conditions. Streamflow conditions are quantified using percentiles comparing the past month’s flow levels to the historic record for each streamgage. During the month of June, wet conditions persisted for much of the Upper Midwest for states such as Minnesota and Wisconsin, while parts of the Eastern U.S. saw dry conditions for states such as West Virginia, Virginia, Massachusetts, and New Hampshire.


ALT O's WIN! Orioles - 17 Yankees - 5 The graphic features an image of Mullins celebrating in the dugout after his home run. He is wearing a grey Orioles uniform and black helmet.


ALT We see a dark blue background with a map showing the intricate fluvial landforms (e.g., meanders, relic stream channels, meander cutoffs) of Beaver Creek, Liberty County, MT. Text on the slide reads “USGS Water Resources Mission Area Science communication job opportunity, More info: usgs.gov/scicommjob, Apply online June 17.” The USGS logo is in the bottom left corner.

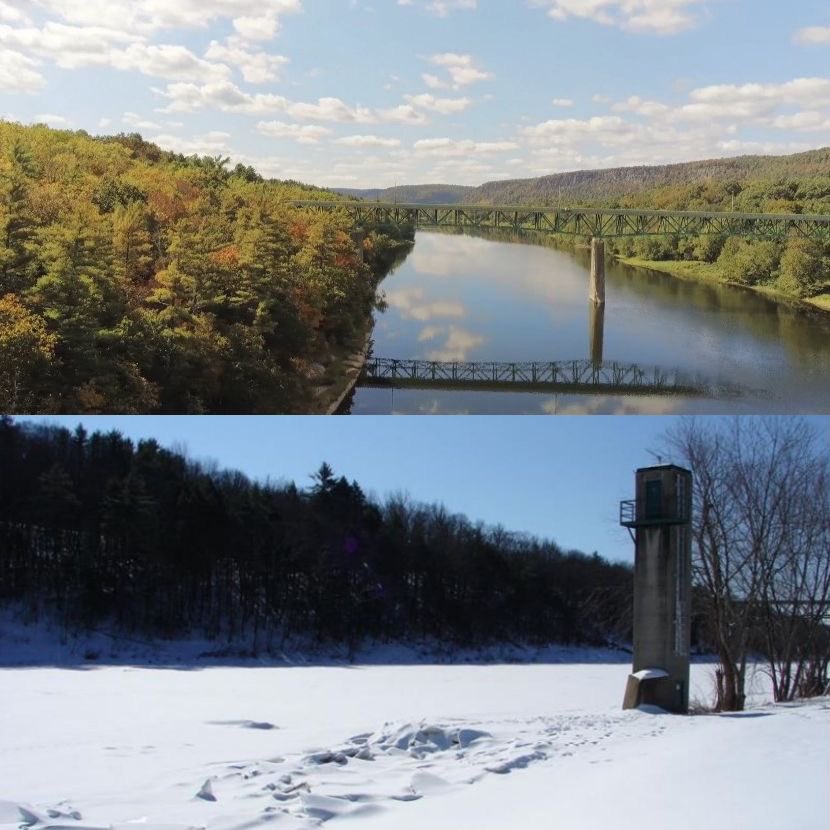
ALT The USGS boat at the Stikine River gage site, Alaska. The Stikine River is one of the transboundary watersheds of Southeast Alaska. Visit USGS Transboundary River Monitoring in Southeast Alaska for more information about our research.

ALT The USGS crew heads upriver early one winter day and sees an incredible sunrise on the Stikine River. The Stikine River is one of the transboundary watersheds of Southeast Alaska. Visit USGS Transboundary River Monitoring in Southeast Alaska for more information about our research.


ALT 📸 A USGS streamgage in the foreground at night with the aurora borealis (northern lights) shining overhead. Photo credit: Jamie Velkoverh, USGS

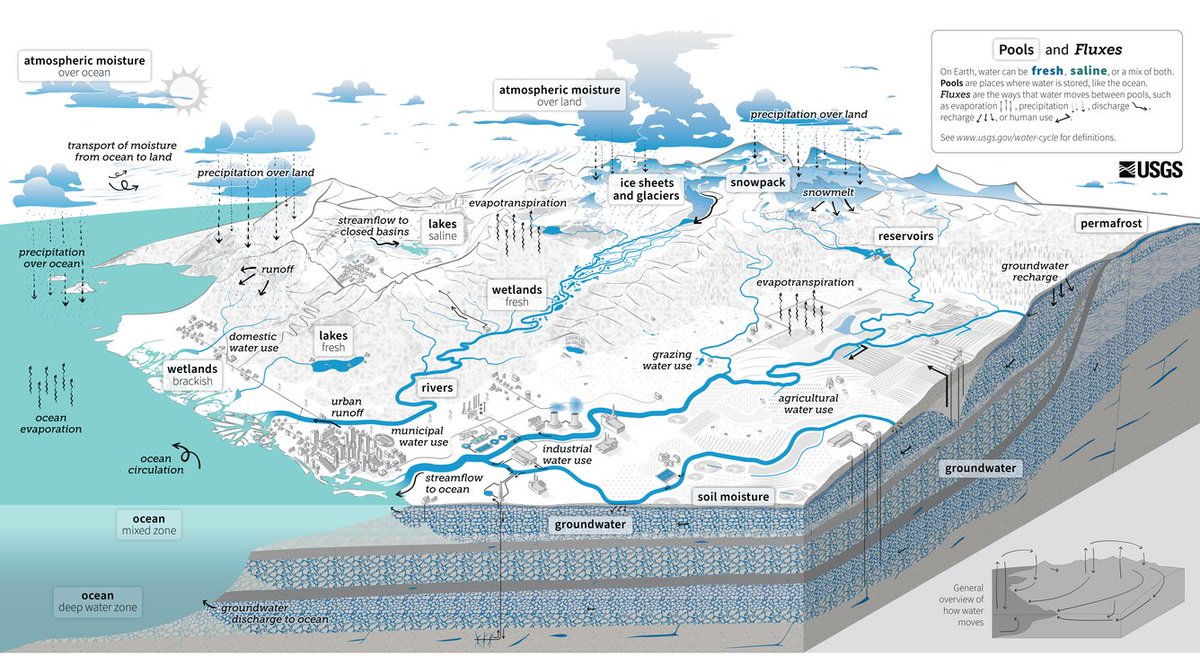
ALT Updated water cycle showing different phases and functions of water on Earth.

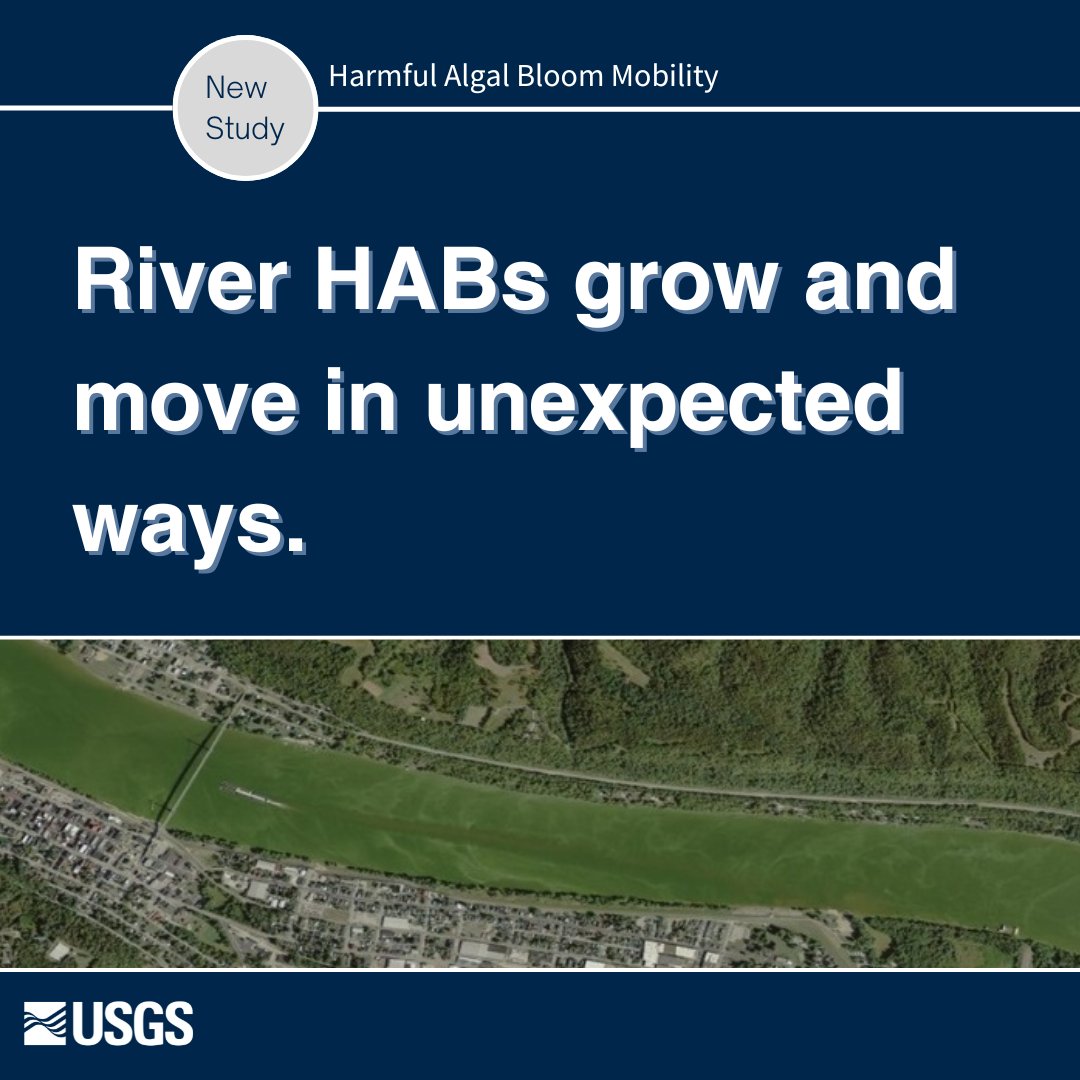
ALT We see a dark blue background. A gray circle at the upper left has text that reads "New Study." White text beside the circle reads "Harmful Algal Bloom Mobility." Below this, white text reads "River HABs grow and move in unexpected ways." A photograph of a river with a harmful algal bloom is seen below. A white USGS logo is seen in the lower left corner of the graphic.
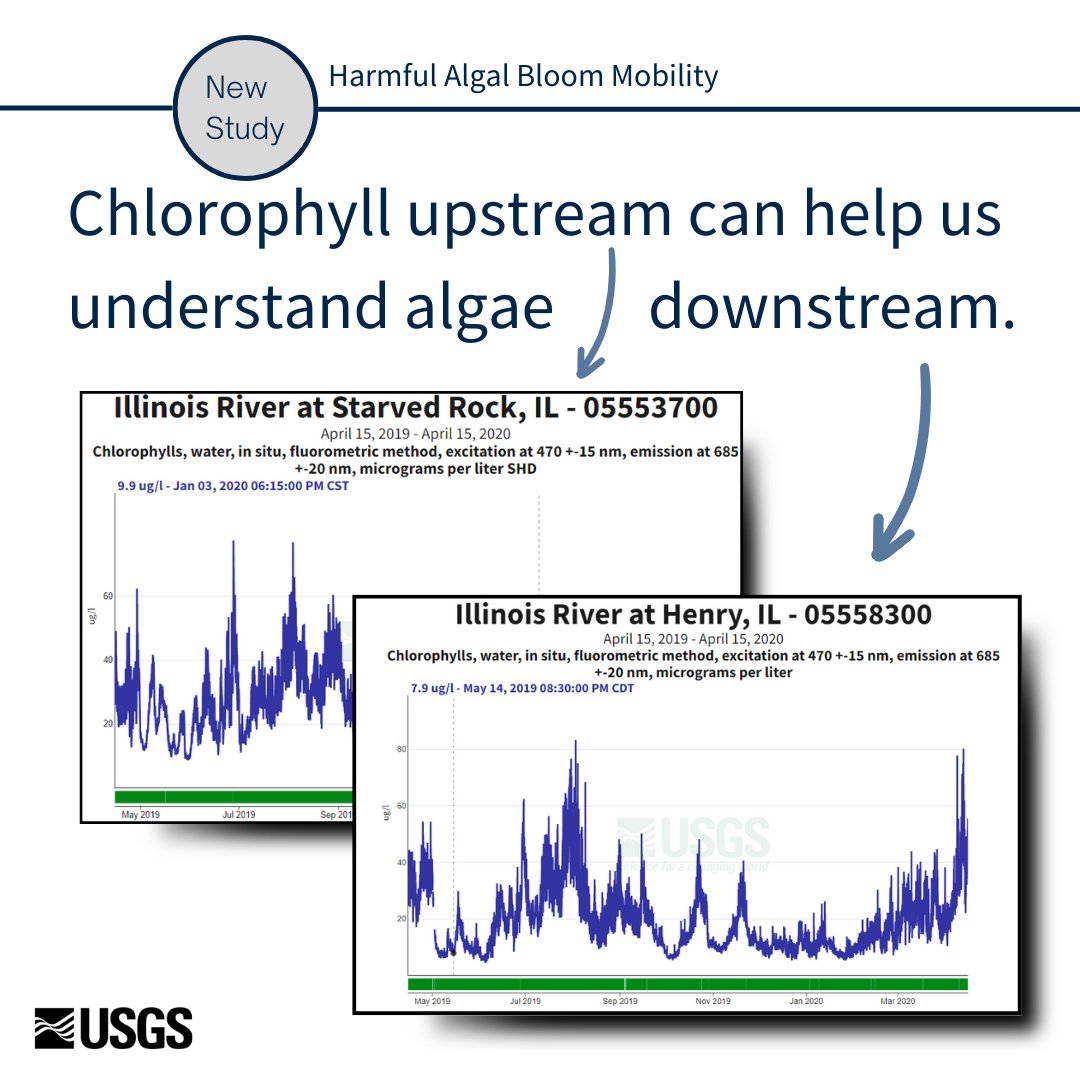
ALT We see a white background. A gray circle at the upper left has dark blue text that reads "New Study." Dark blue text beside the circle reads "Harmful Algal Bloom Mobility." Below this, dark blue text reads "Chlorophyll upstream can help us understand algae downstream." A blue arrow points down from the text "upstream" to a hydrograph displaying Chrlorophylls, water, In situ, fluorometric method, of the Illinois River at Starved Rock, Illinois - monitoring location number 05553700. A blue arrow also points downward from the text "downstream" to a hydrograph displaying Chrlorophylls, water, In situ, fluorometric method, of the Illinois River at Henry, Illinois - monitoring location number 05558300. A black USGS logo is seen in the lower left corner of the graphic.


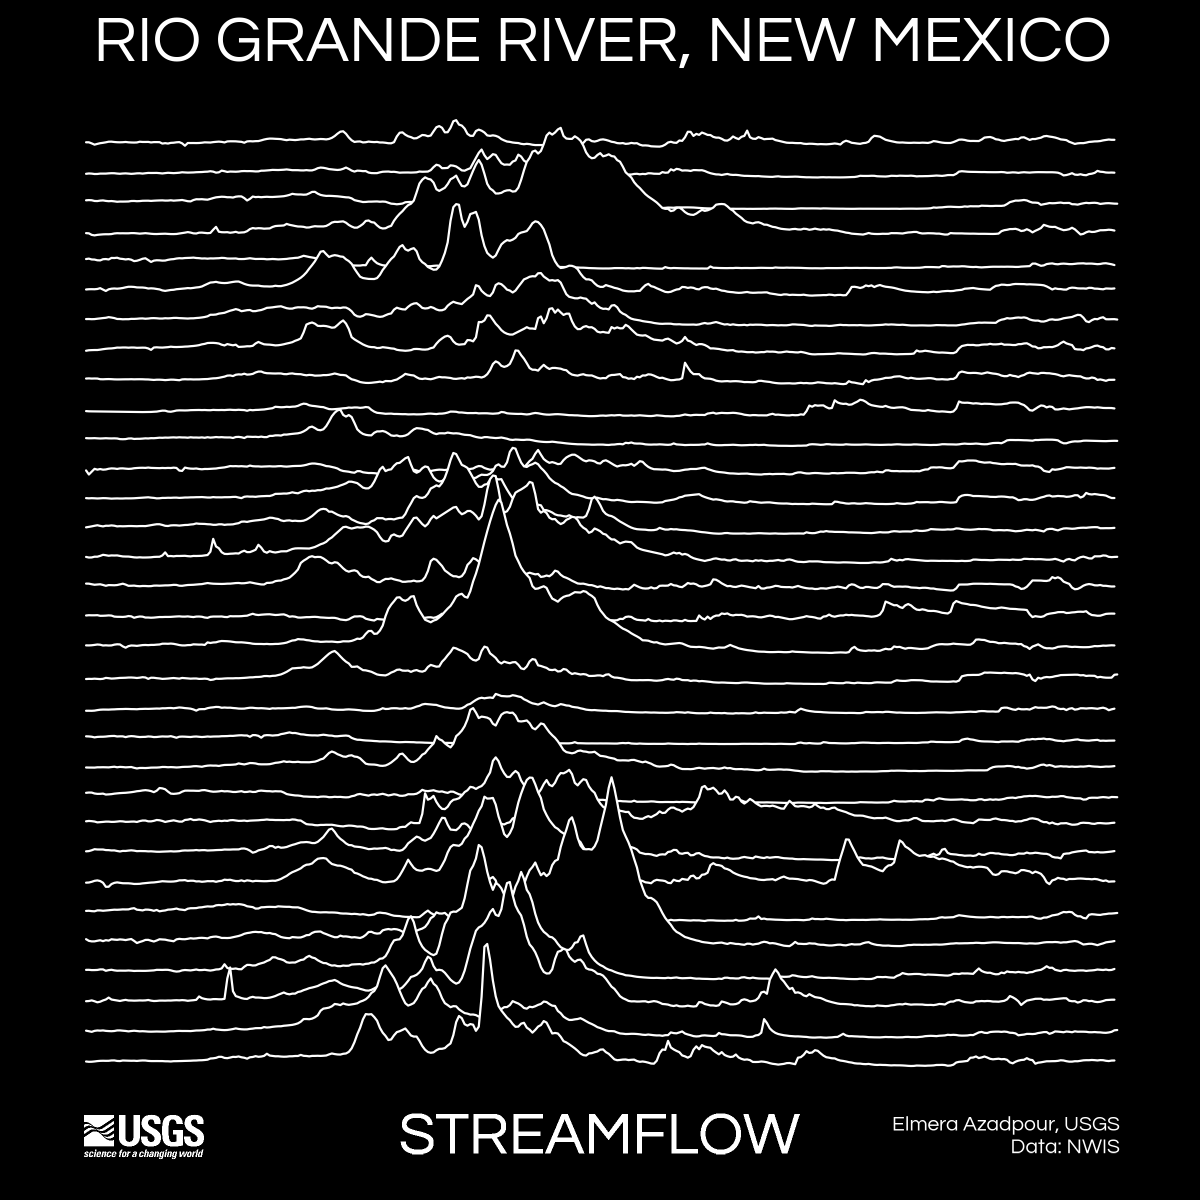
ALT Mean daily streamflow (cfs) of the Rio Grande at Embudo, New Mexico from 1991 to 2022. The chart has a black background and the 30 years of mean daily streamflow data are plotted as stacked white ridge lines that emulate the aesthetics of a classic rock album. In each year there is a peak of streamflow mid-year, with tapering streamflow levels during winter months.


ALT A doodled graphic of the Earth with the text “Every day is Earth Day” on it. The Earth is surrounded by drawings of nature including a desert, tropics, tundra, marine and deep sea environments, mountains, forests, rivers, and hills. Credit: NOAA Education/Kaleigh Ballantine.


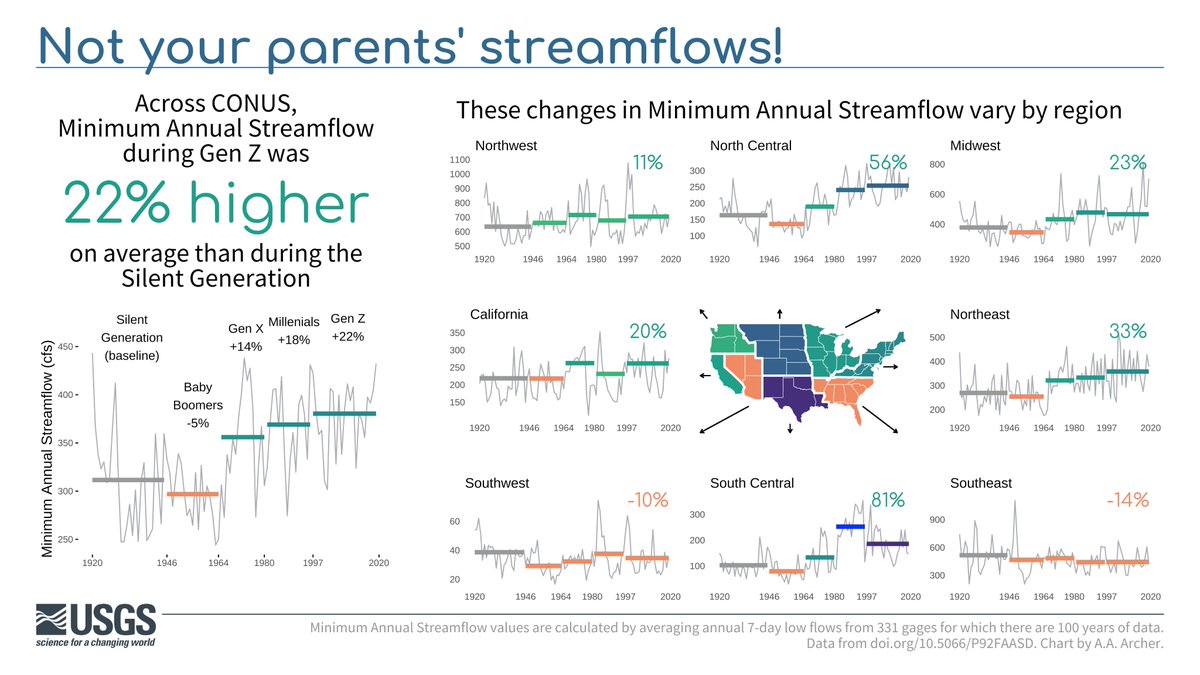
ALT A data visualization showing how Minimum Annual Streamflow has changed from generation to generation over the past 100 years. Across the contiguous United States, streamflow has increased by 22% when comparing the baseline “Silent generation” (1920 – 1946) against the Gen Z years (1997-2020). Regionally, streamflow has increased on average for every area of the U.S. other than the Southwest (excluding California) and Southeast, which both have decreased 10-14% since the silent generation. The largest increase was in the south central region, which was an increase of 81%.