
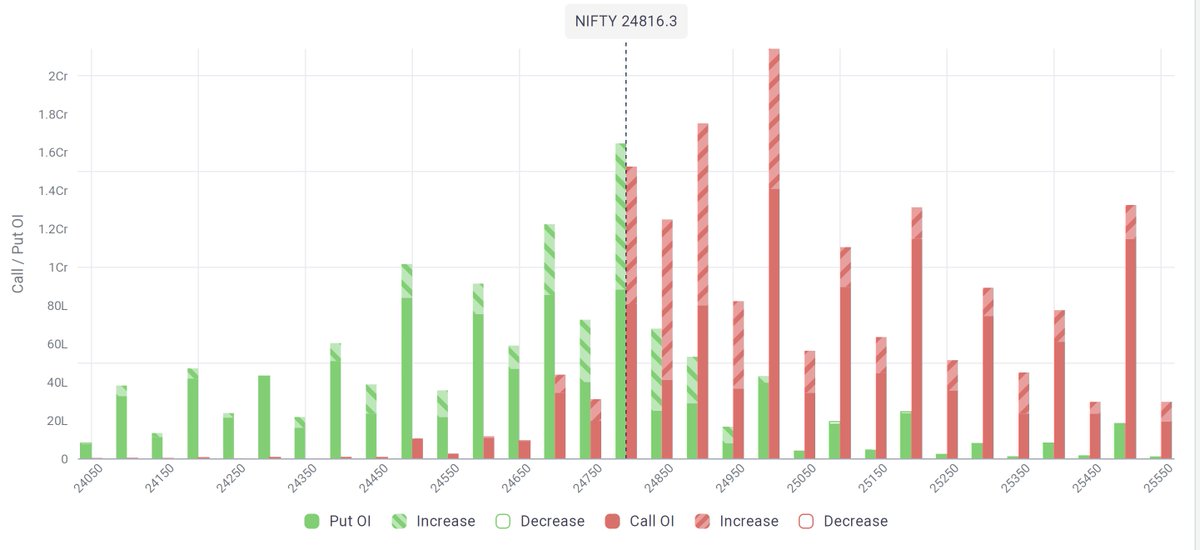
Green line shows the callwriting OI and red line shows put oi. For every sell there is a buy so we can't tell who is having strength by that, rather who has bought and who sold matters more.
1
47

May 30
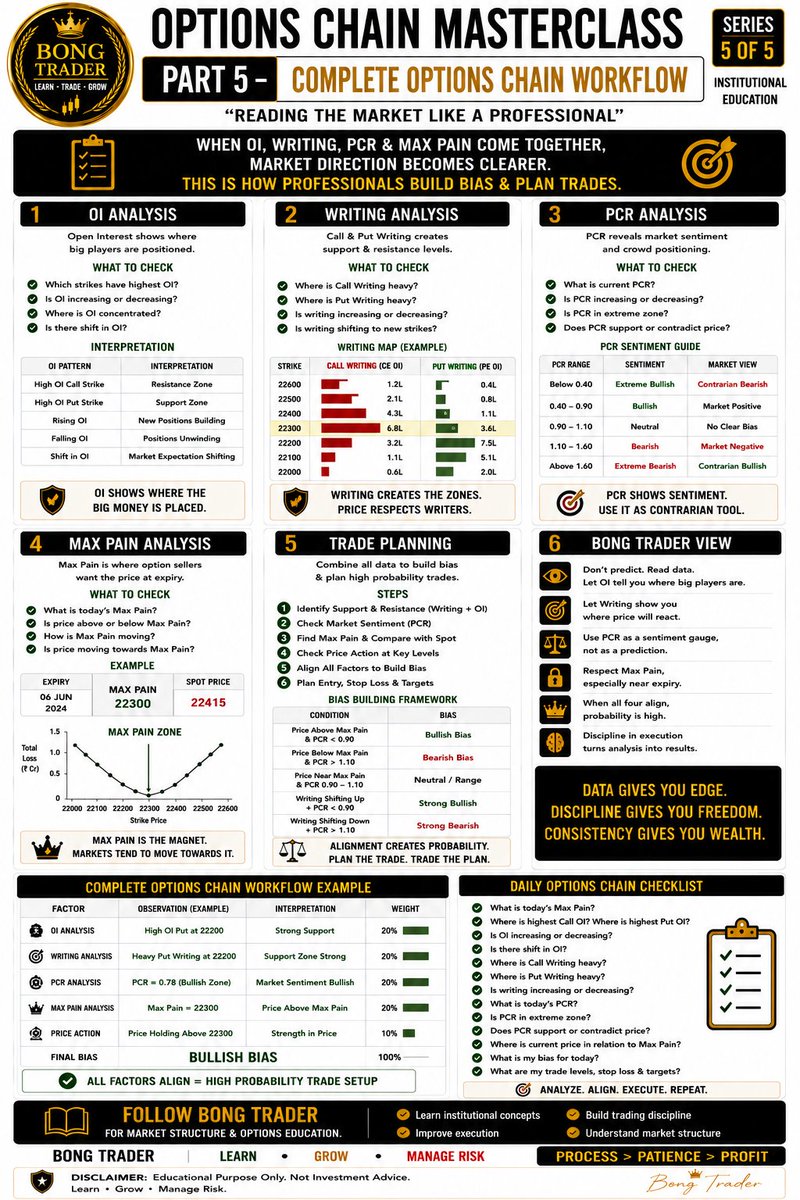
Options Chain Masterclass Part 5 | Complete Options Chain Workflow
#OptionsChain #OptionsTrading #OpenInterest #OIAnalysis #PCR #PutCallRatio #MaxPain #CallWriting #PutWriting #OptionSelling #OptionBuying #MarketStructure #PriceAction #TechnicalAnalysis #Nifty50 #BankNifty
3
48
May 16
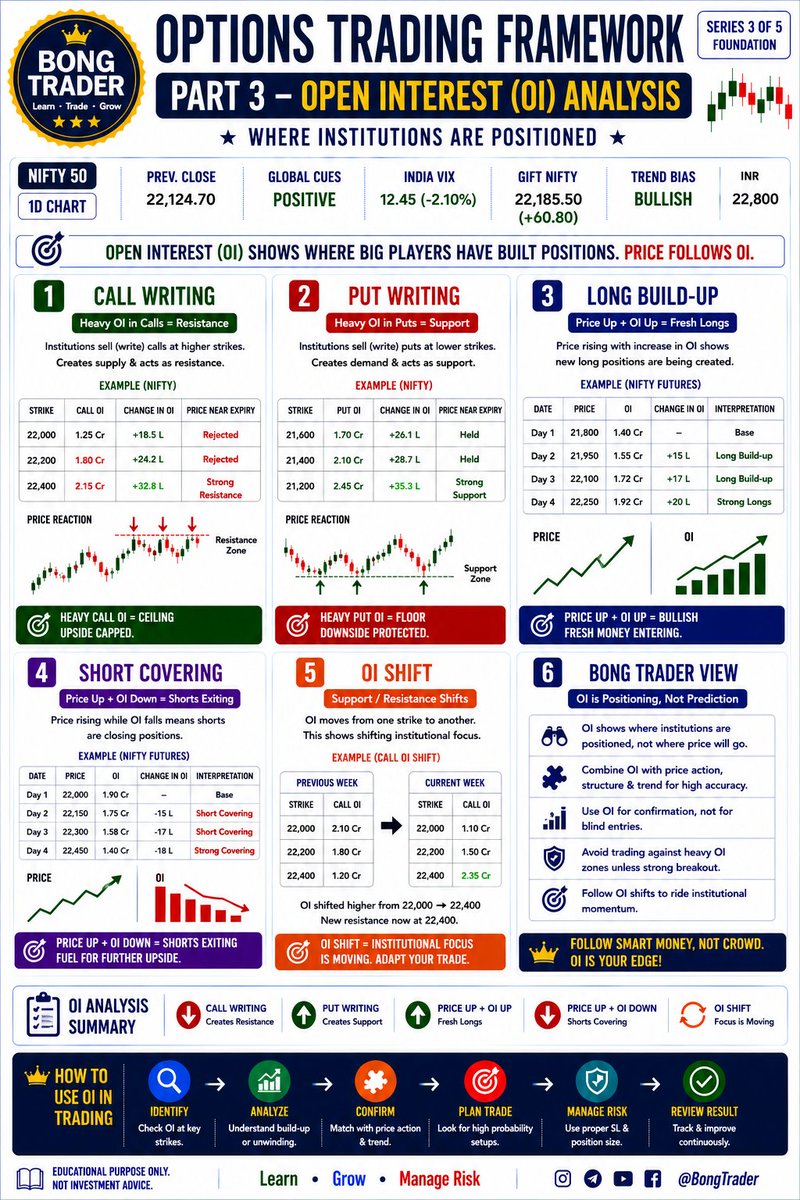
Options Trading Framework Part 3 | Open Interest (OI) Analysis
#OpenInterest #OIAnalysis #OptionsTrading #NiftyOptions #CallWriting #PutWriting #PriceAction #TradingEducation #IndianStockMarket #BongTrader
2
27

3 Aug 2025
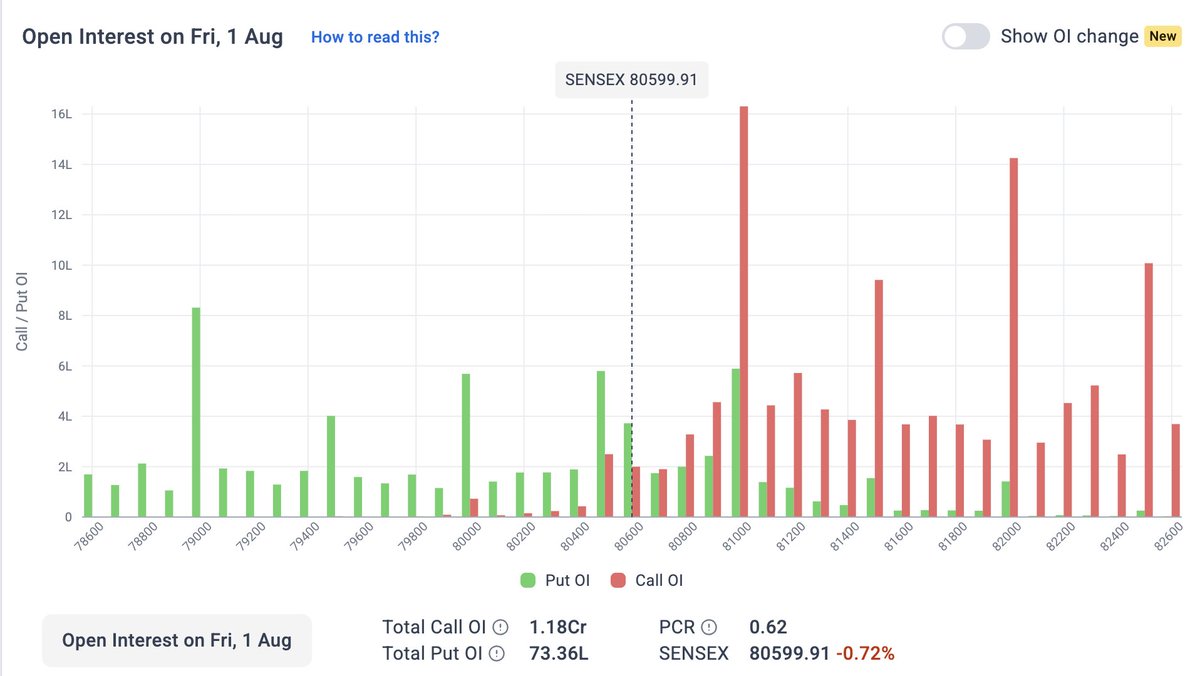
At first glance, anyone would completely agree, this #Sensex OI data looks outright bearish!
But a closer look says the following👇
Spot closed at 80599
▪️Massive Call OI additions, but the highest buildup is seen only at 81000, wich is almost 400-500 pts away from spot & very little Call writing at or nearthe ATM, 80600–80800 levels
▶️What this really means (figuring out probability):
▪️ Call writers aren’t confident to cap the index near current levels.
▪️ They are only active at distant strikes, leaving room for an upside test.
▪️ Lack of strong Put writing shows caution-not aggression-on the bullish side
✅However, this doesn’t necessarily guarantee an up move-it only shows that option sellers aren’t placing a ceiling close to spot, which opens the door for a potential upside probe before any decisive down move happens.
#OpenInterest #OptionsData #Nifty #CallWriting #Sensex #MarketSetup #TraderView
11
943

Heavy Call Writing spotted at 24900CE & 25000CE – strong resistance zone building up for Nifty in the 24,900–25,000 range.
#Nifty #StockMarketIndia #OptionsData #CallWriting #Nifty50 #TechnicalAnalysis
3
546

5 Jul 2025
That’s right, $YMAX also outperformed $QQQI & $SPYI.
Total Cumulative Returns during last 12 months:
$YMAX: 19.78%
$QQQI: 16.43%
$SPYI: 13.54%
Total Cumulative Returns during last 6 months:
$YMAX: 8.12%
$QQQI: 6.09%
$SPYI: 4.96%
Source: Bloomberg. Total Cumulative Returns are as of 6/30/2025, based on ETF NAVs and include the reinvestment of distributions.
$YMAX = YieldMax® Universe Fund of Option Income ETFs
$QQQI = NEOS Nasdaq-100® High Income ETF
$SPYI = NEOS S&P 500 High Income ETF
Past performance is no guarantee of future results. The performance data quoted above represents past performance. Current performance may be lower or higher than the performance data quoted above. Investment return and principal value will fluctuate, so that shares, when redeemed, may be worth more or less than their original cost. Short term performance, in particular, is not a good indication of the ETF’s future performance, and an investment should not be made solely on returns. All ETFs shown are managed differently and do not react in the same manner to economic or market events. The investment objectives, strategies, policies or restrictions of the above ETFs may differ, and more information can be found in their respective prospectuses. Therefore, we generally do not believe it is possible to make direct fund comparisons in an effort to highlight the benefits of an ETF versus another.
STANDARDIZED PERFORMANCES
For $YMAX, click yieldmaxetfs.com/our-etfs/ym…
For $SPYI, click neosfunds.com/spyi/#fund-mat…
For $QQQI, click neosfunds.com/qqqi/#fund-mat…
PROSPECTUSES
An investor should carefully consider the investment objectives, risks, charges, and expenses of the ETFs carefully before investing. To obtain a prospectus containing this and other information:
For $YMAX, click yieldmaxetfs.com/prospectus/…
For $SPYI, click neosfunds.com/wp-content/upl…
For $QQQI, click neosfunds.com/wp-content/upl…
RISK CONSIDERATIONS
Past performance does not guarantee future results. Short-term performance, in particular, is not a good indication of an ETF’s future performance, and an investment should not be made solely on returns. Links to the standardized performance of each ETF are provided above.
Investing in these funds involves a high degree of risk.
$YMAX: Due to the investment strategies of the Underlying YieldMax™ ETFs, the Fund’s indirect exposure to gains, if any, of the share price returns of the Underlying Securities is capped. However, the Fund is subject to all potential losses if the shares of the Underlying Securities decrease in value, which may not be offset by income received by the Fund.
ETF Comparison: The ETFs shown are not meant to be a representative sample of all equity income ETFs. All funds shown are managed differently and do not react the same to economic or market events. The investment objectives, strategies, policies or restrictions of other funds may differ, and more information can be found in their respective prospectuses. Therefore, we generally do not believe it is possible to make direct fund comparisons in an effort to highlight the benefits of a fund versus another.
ETF INVESTMENT OBJECTIVES AND EXPENSE RATIOS
$YMAX Investment Objective: The Fund’s primary investment objective is to seek current income. Expense Ratio: 1.28%. $YMAX has a Management Fee of 0.29% and Acquired Fund Fees and Expenses of 0.99% for a gross expense ratio of 1.28%. “Acquired Fund Fees and Expenses” are indirect fees and expenses that the Fund incurs from investing in the shares of other investment companies, namely other YieldMax® ETFs.
$SPYI Investment Objective: The Fund seeks to generate high monthly income in a tax efficient manner with the potential for equity appreciation in rising markets. Expense Ratio: 0.68%.
$QQQI Investment Objective: The Fund seeks to generate high monthly income in a tax efficient manner with the potential for equity appreciation in rising markets. Expense Ratio: 0.68%.
The YieldMax® ETFs are distributed by Foreside Fund Services, LLC.
#calloptions #coveredcalls #callwriting #buywrite #income #dividends #distribution #IncomeETF #CoveredCallETF #activeETF #dividendincome #dividendgrowth #DRIP #FoF #FundofFunds #weeklydivs #weeklypay @michael_venuto
46
61
598
101,090
4 Jun 2025
YieldMax® BRK.B Option Income Strategy ETF, $BRKC, launching tomorrow, 6/5!
$BRKC seeks to generate #income from selling call options on Berkshire Hathaway Inc. ($BRK.B).
$BRKC holdings of $BRK.B are 0%.
yieldmaxetfs.com #dividends #callwriting #coveredcallETF #DRIP
14
19
167
41,429
2 Jun 2025
YieldMax® BRK.B Option Income Strategy ETF, $BRKC, coming this week!
$BRKC seeks to generate #income from selling call options on Berkshire Hathaway Inc. ($BRK.B).
$BRKC holdings of $BRK.B are 0%.
yieldmaxetfs.com #dividends #callwriting #coveredcallETF
19
15
194
35,720
29 May 2025
YieldMax® BRK.B Option Income Strategy ETF, $BRKC, coming soon!
$BRKC seeks to generate #income from selling call options on Berkshire Hathaway Inc. ($BRK.B).
$BRKC holdings of $BRK.B are 0%.
yieldmaxetfs.com #dividends #callwriting #coveredcallETF
30
29
306
56,477
18 May 2025
How do YieldMax™ ETFs compare? We’re glad you asked.
Total Cumulative Returns during last 12 months:
YMAX: 13.18%
YMAG: 16.45%
FEPI: 3.49%
QDTE: 12.97%
XDTE: 10.47%
RDTE: N/A
Total Cumulative Returns during last 6 months:
YMAX: 5.20%
YMAG: 0.97%
FEPI: -2.26%
QDTE: -0.99%
XDTE: -2.84%
RDTE: -5.56%
Source: Bloomberg. Total Cumulative Returns are as of 5/16/2025, based on ETF NAVs and include the reinvestment of distributions.
YMAX = YieldMax Universe Fund of Option Income ETFs
YMAG = YieldMax Magnificent 7 Fund of Option Income ETFs
FEPI = Rex FANG & Innovation Equity Premium Income ETF
QDTE = Roundhill Innovation-100 ODTE Covered Call Strategy ETF
XDTE = Roundhill S&P 500 ODTE Covered Call Strategy ETF
RDTE = Roundhill Small Cap ODTE Covered Call Strategy ETF
Magnificent 7 Companies: Apple Inc. (AAPL), Amazon, Inc. (AMZN), Alphabet Inc. (GOOGL), Meta Platforms, Inc. (FBY), Microsoft Corporation (MSFT), NVIDIA Corporation (NVDA) and Tesla, Inc. (TSLA).
YieldMaxETFs.com
Past performance is no guarantee of future results. The performance data quoted above represents past performance. Current performance may be lower or higher than the performance data quoted above. Investment return and principal value will fluctuate, so that shares, when redeemed, may be worth more or less than their original cost. Short term performance, in particular, is not a good indication of the ETF’s future performance, and an investment should not be made solely on returns. All ETFs shown are managed differently and do not react in the same manner to economic or market events. The investment objectives, strategies, policies or restrictions of the above ETFs may differ, and more information can be found in their respective prospectuses. Therefore, we generally do not believe it is possible to make direct fund comparisons in an effort to highlight the benefits of an ETF versus another.
STANDARDIZED PERFORMANCES
For YMAX, click yieldmaxetfs.com/our-etfs/ym…
For YMAG, click yieldmaxetfs.com/our-etfs/ym…
For FEPI, click rexshares.com/fepi/?tm=tt&ap…
For QDTE, click roundhillinvestments.com/etf…
For XDTE, click roundhillinvestments.com/etf…
For RDTE, click roundhillinvestments.com/etf…
PROSPECTUSES
An investor should carefully consider the investment objectives, risks, charges, and expenses of the ETFs carefully before investing. To obtain a prospectus containing this and other information:
For YMAX and YMAG, click yieldmaxetfs.com/prospectus/…
For FEPI, click rexshares.com/wp-content/upl…
For QDTE, click roundhillinvestments.com/ass…
For XDTE, click roundhillinvestments.com/ass…
For RDTE, click roundhillinvestments.com/ass…
RISK CONSIDERATIONS
Past performance does not guarantee future results. Short-term performance, in particular, is not a good indication of an ETF’s future performance, and an investment should not be made solely on returns. Links to the standardized performance of each ETF are provided above.
Investing in these funds involves a high degree of risk.
YMAX & YMAG: Due to the investment strategies of the Underlying YieldMax™ ETFs, the Fund’s indirect exposure to gains, if any, of the share price returns of the Underlying Securities is capped. However, the Fund is subject to all potential losses if the shares of the Underlying Securities decrease in value, which may not be offset by income received by the Fund.
ETF Comparison: The ETFs shown are not meant to be a representative sample of all equity income ETFs. All funds shown are managed differently and do not react the same to economic or market events. The investment objectives, strategies, policies or restrictions of other funds may differ, and more information can be found in their respective prospectuses. Therefore, we generally do not believe it is possible to make direct fund comparisons in an effort to highlight the benefits of a fund versus another.
ETF INVESTMENT OBJECTIVES AND EXPENSE RATIOS
YMAX Investment Objective: The Fund’s primary investment objective is to seek current income. Expense Ratio: 1.28%. YMAX has a Management Fee of 0.29% and Acquired Fund Fees and Expenses of 0.99% for a gross expense ratio of 1.28%. “Acquired Fund Fees and Expenses” are indirect fees and expenses that the Fund incurs from investing in the shares of other investment companies, namely other YieldMax™ ETFs.
YMAG Investment Objective: The Fund’s primary investment objective is to seek current income. Expense Ratio: 1.12%. YMAG has a Management Fee of 0.29% and Acquired Fund Fees and Expenses of 0.83% for a gross expense ratio of 1.12%. “Acquired Fund Fees and Expenses” are indirect fees and expenses that the Fund incurs from investing in the shares of other investment companies, namely other YieldMax™ ETFs.
FEPI Investment Objective: The Fund investment objectives are capital appreciation and current income. Expense Ratio: 0.65%.
QDTE Investment Objective: The Fund’s primary investment objective is to provide current income. The Fund’s secondary investment objective is to provide capital appreciation. Expense Ratio: 0.95%.
XDTE Investment Objective: The Fund’s primary investment objective is to provide current income. The Fund’s secondary investment objective is to provide capital appreciation. Expense Ratio: 0.95%.
RDTE Investment Objective: The Fund’s primary investment objective is to provide current income. The Fund’s secondary investment objective is to provide capital appreciation. Expense Ratio: 0.95%.
The YieldMax ETFs are distributed by Foreside Fund Services, LLC.
#calloptions #coveredcalls #callwriting #buywrite #income #dividends #distribution #IncomeETF #CoveredCallETF #activeETF #YieldMaxETFs #dividendgrowthinvesting #Nasdaq #dividendincome #dividendgrowth #DRIP #FundofFunds #Magnificent7 #MagnificentSeven #weeklyincome #weeklydivs #weeklypay #0DTE
24
21
288
52,575
7 May 2025
5.7.25: YieldMax ETFs Announces Distributions for the following ETFs.
Press Release: tinyurl.com/57at8yv7
$WNTR $2.7190
$MSTY $2.3734
$SMCY $1.4128
$AMZY $0.7963
$LFGY $0.7511 #weeklyincome
$APLY $0.6512
$DISO $0.5291
$RDTY $0.4634 #weeklyincome
$YQQQ $0.4357
$XYZY $0.4140
$CHPY $0.3767 #weeklyincome
$AIYY $0.3245
$QDTY $0.2841 #weeklyincome
$GPTY $0.2738 #weeklyincome
$SDTY $0.2714 #weeklyincome
$YMAX $0.1679 #weeklyincome
$ULTY $0.1181 #weeklyincome
$YMAG $0.1059 #weeklyincome
Standardized Performance: YieldMaxETFs.com. Prospectus: Yieldmaxetfs.com/prospectus/….
#calloptions #options #callwriting #optionpremiums #optionselling #dividendgrowth #DRIP
97
131
1,065
245,916
6 May 2025
YieldMax™ HOOD Option Income Strategy ETF, $HOOY, launching Thursday, 5/8!
$HOOY seeks to generate #income from selling call options on Robinhood Markets, Inc. ($HOOD).
$HOOY holdings of $HOOD are 0%.
yieldmaxetfs.com #dividends #callwriting #coveredcallETF #DRIP
10
9
124
29,676
3 May 2025
YieldMax™ HOOD Option Income Strategy ETF, $HOOY, is launching next week!
$HOOY seeks to generate #income from selling call options on Robinhood Markets, Inc. $HOOD
$HOOY holdings of $HOOD are 0%.
yieldmaxetfs.com #dividends #callwriting #coveredcallETF #DRIP
46
23
263
44,280
23 Feb 2025
How do YieldMax™ ETFs compare? We’re glad you asked.
Total Cumulative Returns during last 6 months:
YMAX: 13.87%
YMAG: 11.89%
FEPI: 5.54%
QDTE: 10.92%
XDTE: 8.04%
Source: Bloomberg. Total Cumulative Returns are as of 2/21/2025, based on ETF NAVs and include the reinvestment of distributions.
YMAX = YieldMax Universe Fund of Option Income ETFs
YMAG = YieldMax Magnificent 7 Fund of Option Income ETFs
FEPI = Rex FANG & Innovation Equity Premium Income ETF
QDTE = Roundhill Innovation-100 ODTE Covered Call Strategy ETF
XDTE = Roundhill S&P 500 ODTE Covered Call Strategy ETF
Magnificent 7 Companies: Apple Inc. (AAPL), Amazon, Inc. (AMZN), Alphabet Inc. (GOOGL), Meta Platforms, Inc. (FBY), Microsoft Corporation (MSFT), NVIDIA Corporation (NVDA) and Tesla, Inc. (TSLA).
YieldMaxETFs.com
Past performance is no guarantee of future results. The performance data quoted above represents past performance. Current performance may be lower or higher than the performance data quoted above. Investment return and principal value will fluctuate, so that shares, when redeemed, may be worth more or less than their original cost. Short term performance, in particular, is not a good indication of the ETF’s future performance, and an investment should not be made solely on returns. All ETFs shown are managed differently and do not react in the same manner to economic or market events. The investment objectives, strategies, policies or restrictions of the above ETFs may differ, and more information can be found in their respective prospectuses. Therefore, we generally do not believe it is possible to make direct fund comparisons in an effort to highlight the benefits of an ETF versus another.
STANDARDIZED PERFORMANCES
For YMAX, click yieldmaxetfs.com/our-etfs/ym…
For YMAG, click yieldmaxetfs.com/our-etfs/ym…
For FEPI, click rexshares.com/fepi/?tm=tt&ap…
For QDTE, click roundhillinvestments.com/etf…
For XDTE, click roundhillinvestments.com/etf…
PROSPECTUSES
An investor should carefully consider the investment objectives, risks, charges, and expenses of the ETFs carefully before investing. To obtain a prospectus containing this and other information:
For YMAX and YMAG, click yieldmaxetfs.com/prospectus/…
For FEPI, click rexshares.com/wp-content/upl…
For QDTE, click roundhillinvestments.com/ass…
For XDTE, click roundhillinvestments.com/ass…
RISK CONSIDERATIONS
Past performance does not guarantee future results. Short-term performance, in particular, is not a good indication of an ETF’s future performance, and an investment should not be made solely on returns. Links to the standardized performance of each ETF are provided above.
Investing in these funds involves a high degree of risk.
YMAX & YMAG: Due to the investment strategies of the Underlying YieldMax™ ETFs, the Fund’s indirect exposure to gains, if any, of the share price returns of the Underlying Securities is capped. However, the Fund is subject to all potential losses if the shares of the Underlying Securities decrease in value, which may not be offset by income received by the Fund.
ETF Comparison: The ETFs shown are not meant to be a representative sample of all equity income ETFs. All funds shown are managed differently and do not react the same to economic or market events. The investment objectives, strategies, policies or restrictions of other funds may differ, and more information can be found in their respective prospectuses. Therefore, we generally do not believe it is possible to make direct fund comparisons in an effort to highlight the benefits of a fund versus another.
ETF INVESTMENT OBJECTIVES AND EXPENSE RATIOS
YMAX Investment Objective: The Fund’s primary investment objective is to seek current income. Expense Ratio: 1.28%. YMAX has a Management Fee of 0.29% and Acquired Fund Fees and Expenses of 0.99% for a gross expense ratio of 1.28%. “Acquired Fund Fees and Expenses” are indirect fees and expenses that the Fund incurs from investing in the shares of other investment companies, namely other YieldMax™ ETFs.
YMAG Investment Objective: The Fund’s primary investment objective is to seek current income. Expense Ratio: 1.28%. YMAG has a Management Fee of 0.29% and Acquired Fund Fees and Expenses of 0.99% for a gross expense ratio of 1.28%. “Acquired Fund Fees and Expenses” are indirect fees and expenses that the Fund incurs from investing in the shares of other investment companies, namely other YieldMax™ ETFs.
FEPI Investment Objective: The Fund investment objectives are capital appreciation and current income. Expense Ratio: 0.65%.
QDTE Investment Objective: The Fund’s primary investment objective is to provide current income. The Fund’s secondary investment objective is to provide capital appreciation. Expense Ratio: 0.95%.
XDTE Investment Objective: The Fund’s primary investment objective is to provide current income. The Fund’s secondary investment objective is to provide capital appreciation. Expense Ratio: 0.95%.
The YieldMax ETFs are distributed by Foreside Fund Services, LLC.
#calloptions #coveredcalls #callwriting #buywrite #income #dividends #distribution #IncomeETF #CoveredCallETF #activeETF #YieldMaxETFs #dividendgrowthinvesting #Nasdaq #dividendincome #dividendgrowth #DRIP #FundofFunds #Magnificent7 #MagnificentSeven #weeklyincome #weeklydivs #weeklypay #0DTE
47
32
287
208,658
30 Jan 2025
New YieldMax ETF $CVNY seeks to generate monthly #income by selling #calloptions on CARVANA CO. / $CVNA
See tinyurl.com/y7mf57nd & visit YieldMaxETFs.com/CVNY
##calloptions #coveredcalls #callwriting #income #YieldMaxETFs #dividendyield #IncomeETF #dividendgrowth #DRIP
14
6
73
30,351
24 Jan 2025
YieldMax™ CVNA Option Income Strategy ETF, $CVNY, launching next week.
$CVNY seeks to generate #income from selling call options on CARVANA CO. $CVNA.
$CVNY holdings of $CVNA are 0%.
yieldmaxetfs.com #dividends #callwriting #coveredcallETF #DRIP
21
12
123
159,700
28 Dec 2024
Did you know that $NVDY $DIPS $FBY $GDXY $BABO $JPMO $MRNY $PLTY $MARO (new!) are scheduled to make 2 distributions in January?
See for yourself at yieldmaxetfs.com/distributio….
#callwriting #income #dividends #coveredputwriting #DRIP #FoF #FundofFunds #weeklyincome #weeklydivs
10
26
198
33,535
10 Dec 2024
New YieldMax ETF $MARO seeks to generate monthly #income by selling #calloptions on MARA Holdings $MARA
See tinyurl.com/yckbvedv & visit yieldmaxetfs.com/maro/
##calloptions #coveredcalls #callwriting #income #YieldMaxETFs #dividendyield #IncomeETF #dividendgrowth #DRIP
7
17
105
22,593
9 Dec 2024
YieldMax™ MARA Option Income Strategy ETF $MARO is launching tomorrow, 12/10.
$MARO seeks to generate #income from selling call options on MARA Holdings, Inc. ( $MARA ).
$MARO holdings of $MARA are 0%.
yieldmaxetfs.com #dividends #callwriting #coveredcallETF #DRIP
16
13
129
25,731
6 Dec 2024
YieldMax™ MARA Option Income Strategy ETF $MARO is launching next week.
$MARO seeks to generate #income from selling call options on MARA Holdings, Inc. ( $MARA ).
$MARO holdings of $MARA are 0%.
yieldmaxetfs.com #dividends #callwriting #coveredcallETF #DRIP
26
29
224
47,900