
Jun 12
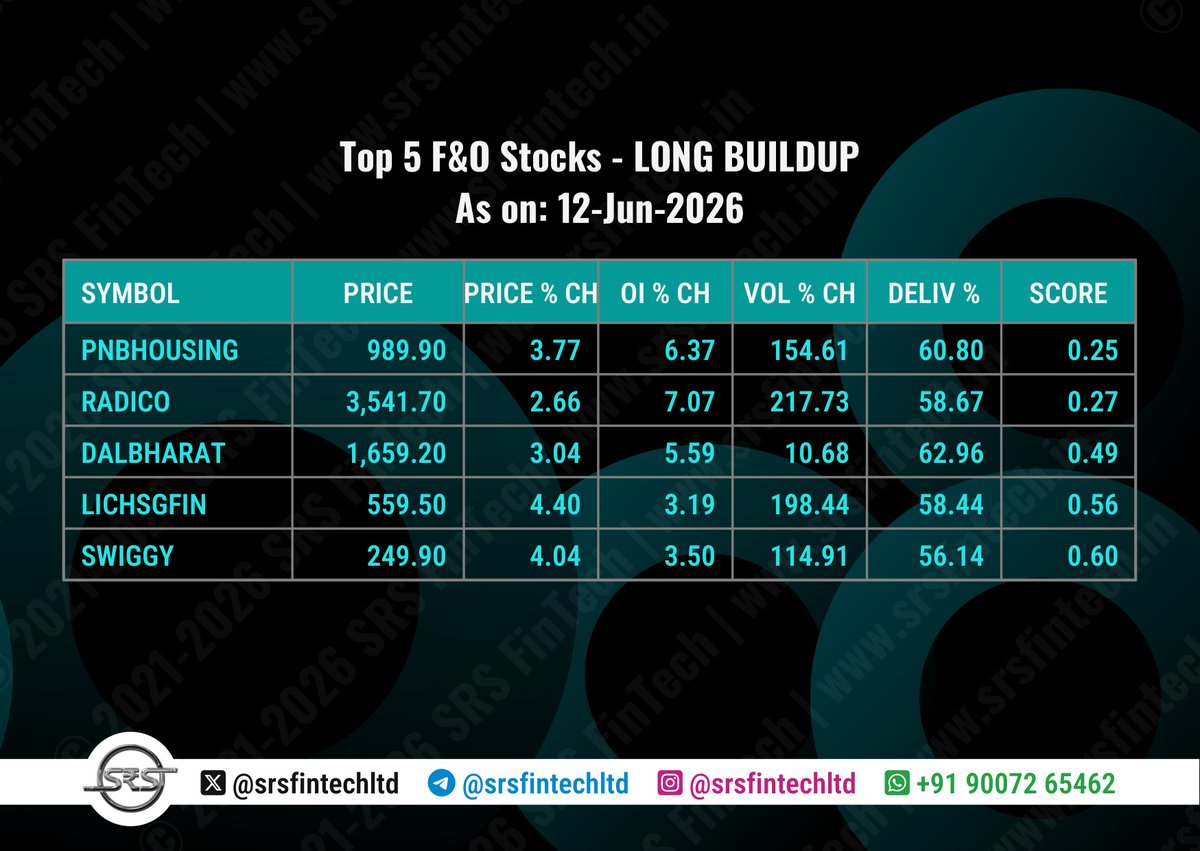
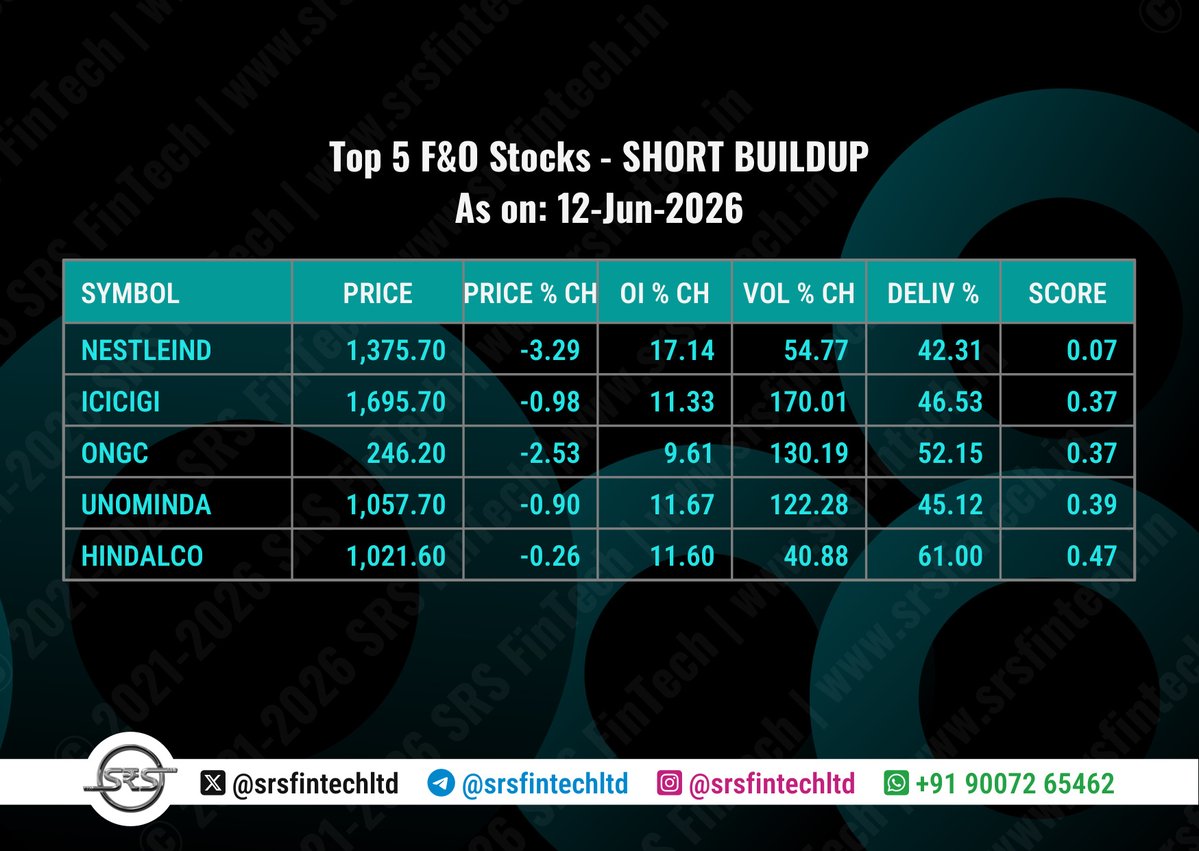
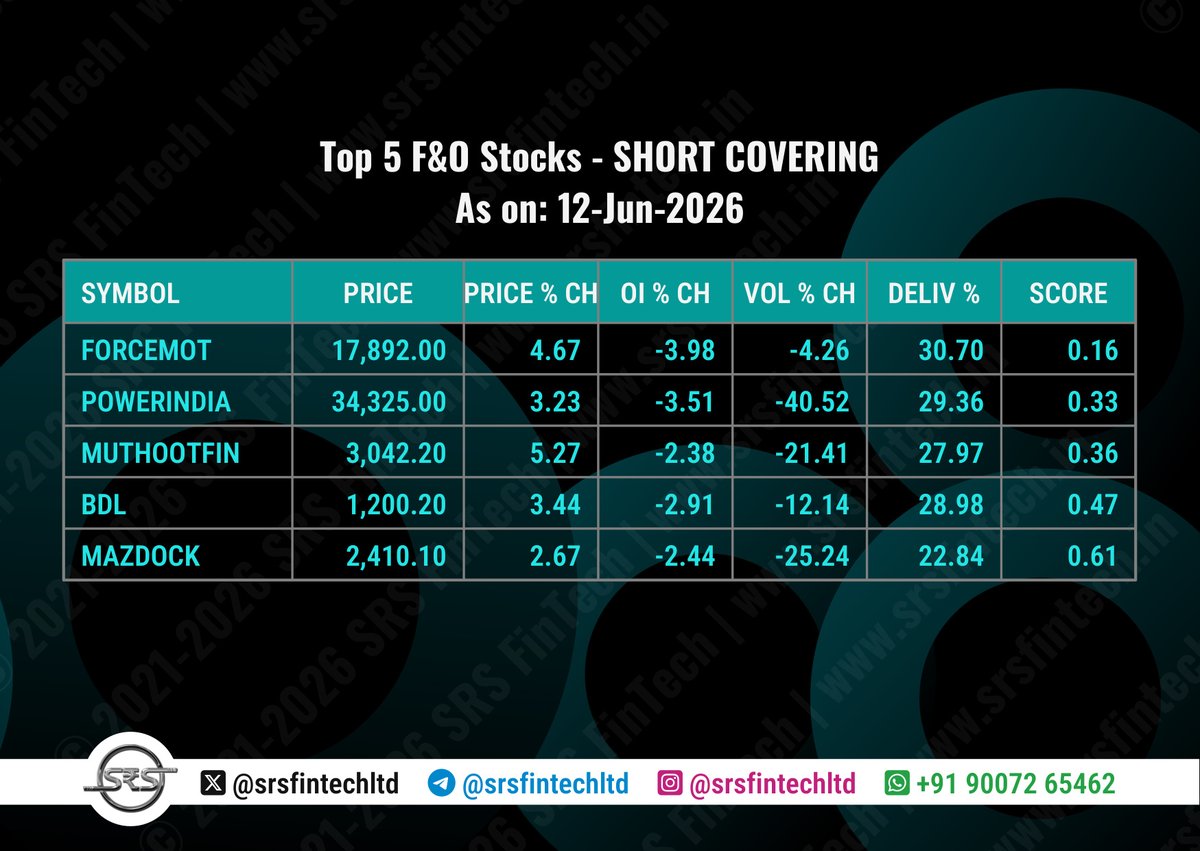
📊 F&O Market Top Stocks Report
12-Jun-2026
This report highlights the top 5 stocks across four key futures & options activity scenarios: Long Buildup, Short Buildup, Short Covering, and Long Unwinding, based on the latest trading day data.
Each stock is ranked by a score that combines multiple factors including price change %, open interest change %, volume change %, and delivery percentage. A lower score indicates stronger relative activity and potential market interest in that category.
⚠️ Disclaimer: This post is AI-generated and strictly for educational and informational purposes only. It does not constitute, contain, or imply any investment advice, stock recommendations, financial tips, or solicitation to buy or sell any securities or financial instruments. There are no references or suggestions related to Buy/Sell, Entry/Exit, Stop Loss (SL), or Target levels. Any market data or chart images shared are solely to illustrate technical concepts. We are not SEBI Registered Advisors, do not promote, solicit, or endorse trading decisions, and do not accept any liability for actions taken based on this content.
No compensation, association, or financial relationship exists between us and any entities or securities mentioned herein. Viewers are strongly advised to conduct their own research and consult with a certified financial advisor or SEBI registered professional before making any investment or trading decisions.
#StockMarket #Stocks #StockTrading #Trading #Investing #Investment #Finance #Money #Trader #Investor #ShareMarket #StockAnalysis #TechnicalAnalysis #Charting #MarketAnalysis #Success #Motivation #Entrepreneurship #MoneyMatters #InvestSmart #BuildWealth #TradeSmart #StockFundamentals #Dividend #FuturesTrading #OptionsTrading #FnOSegment #DerivativesMarket #OptionsStrategy #FuturesMarket #OptionsChain #EquityDerivatives #OptionsAnalysis #MarketVolatility #OptionsPremium #TradingStrategies #Hedging #RiskManagement #OptionsTrader

48
Jun 11
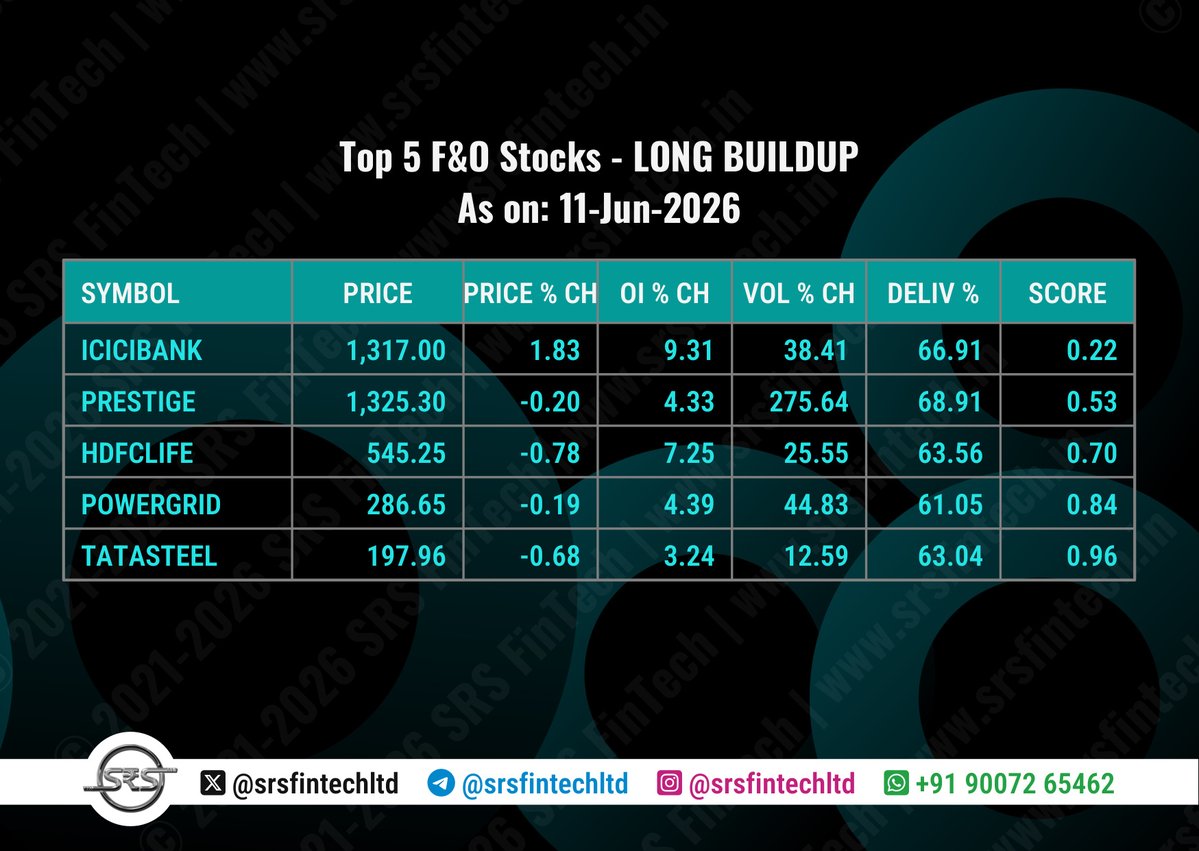
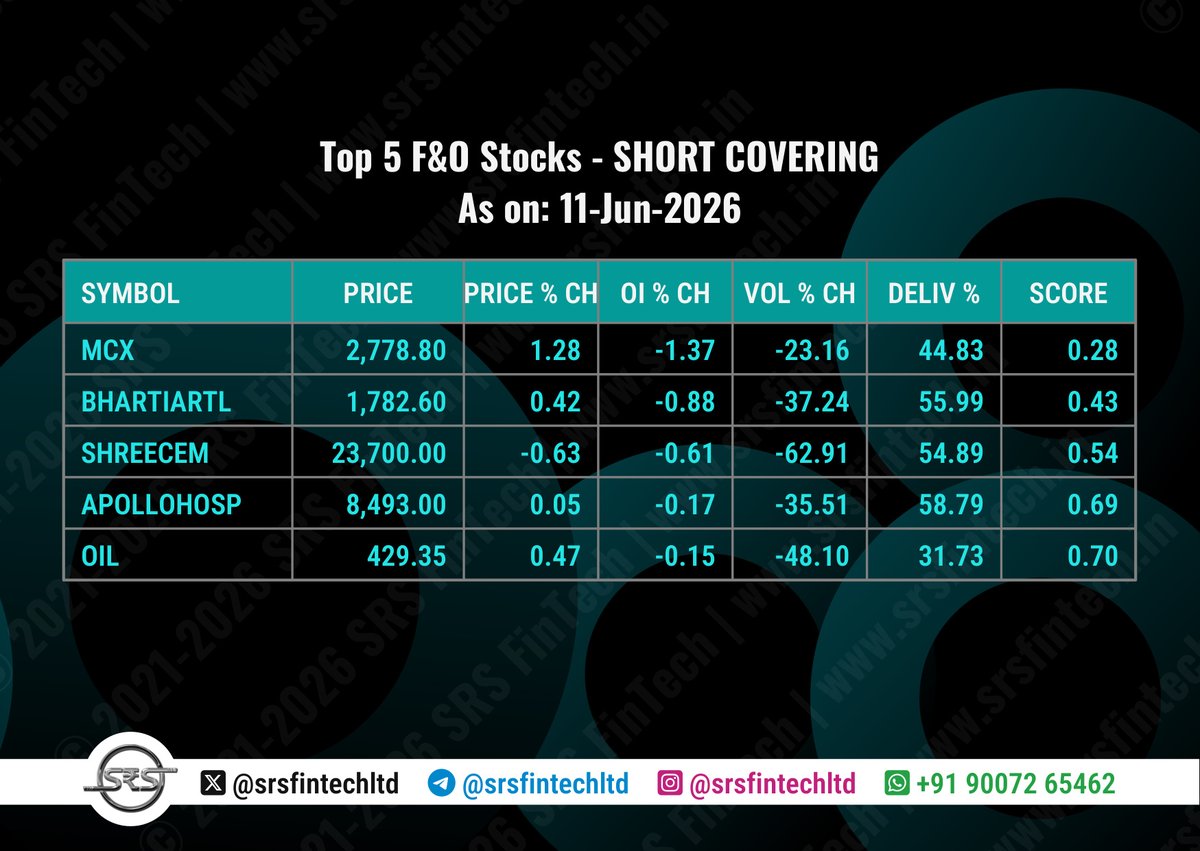
📊 F&O Market Top Stocks Report
11-Jun-2026
This report highlights the top 5 stocks across four key futures & options activity scenarios: Long Buildup, Short Buildup, Short Covering, and Long Unwinding, based on the latest trading day data.
Each stock is ranked by a score that combines multiple factors including price change %, open interest change %, volume change %, and delivery percentage. A lower score indicates stronger relative activity and potential market interest in that category.
⚠️ Disclaimer: This post is AI-generated and strictly for educational and informational purposes only. It does not constitute, contain, or imply any investment advice, stock recommendations, financial tips, or solicitation to buy or sell any securities or financial instruments. There are no references or suggestions related to Buy/Sell, Entry/Exit, Stop Loss (SL), or Target levels. Any market data or chart images shared are solely to illustrate technical concepts. We are not SEBI Registered Advisors, do not promote, solicit, or endorse trading decisions, and do not accept any liability for actions taken based on this content.
No compensation, association, or financial relationship exists between us and any entities or securities mentioned herein. Viewers are strongly advised to conduct their own research and consult with a certified financial advisor or SEBI registered professional before making any investment or trading decisions.
#StockMarket #Stocks #StockTrading #Trading #Investing #Investment #Finance #Money #Trader #Investor #ShareMarket #StockAnalysis #TechnicalAnalysis #Charting #MarketAnalysis #Success #Motivation #Entrepreneurship #MoneyMatters #InvestSmart #BuildWealth #TradeSmart #StockFundamentals #Dividend #FuturesTrading #OptionsTrading #FnOSegment #DerivativesMarket #OptionsStrategy #FuturesMarket #OptionsChain #EquityDerivatives #OptionsAnalysis #MarketVolatility #OptionsPremium #TradingStrategies #Hedging #RiskManagement #OptionsTrader


55
Jun 10
📊 F&O Market Top Stocks Report
10-Jun-2026
This report highlights the top 5 stocks across four key futures & options activity scenarios: Long Buildup, Short Buildup, Short Covering, and Long Unwinding, based on the latest trading day data.
Each stock is ranked by a score that combines multiple factors including price change %, open interest change %, volume change %, and delivery percentage. A lower score indicates stronger relative activity and potential market interest in that category.
⚠️ Disclaimer: This post is AI-generated and strictly for educational and informational purposes only. It does not constitute, contain, or imply any investment advice, stock recommendations, financial tips, or solicitation to buy or sell any securities or financial instruments. There are no references or suggestions related to Buy/Sell, Entry/Exit, Stop Loss (SL), or Target levels. Any market data or chart images shared are solely to illustrate technical concepts. We are not SEBI Registered Advisors, do not promote, solicit, or endorse trading decisions, and do not accept any liability for actions taken based on this content.
No compensation, association, or financial relationship exists between us and any entities or securities mentioned herein. Viewers are strongly advised to conduct their own research and consult with a certified financial advisor or SEBI registered professional before making any investment or trading decisions.
#StockMarket #Stocks #StockTrading #Trading #Investing #Investment #Finance #Money #Trader #Investor #ShareMarket #StockAnalysis #TechnicalAnalysis #Charting #MarketAnalysis #Success #Motivation #Entrepreneurship #MoneyMatters #InvestSmart #BuildWealth #TradeSmart #StockFundamentals #Dividend #FuturesTrading #OptionsTrading #FnOSegment #DerivativesMarket #OptionsStrategy #FuturesMarket #OptionsChain #EquityDerivatives #OptionsAnalysis #MarketVolatility #OptionsPremium #TradingStrategies #Hedging #RiskManagement #OptionsTrader


52
Jun 9
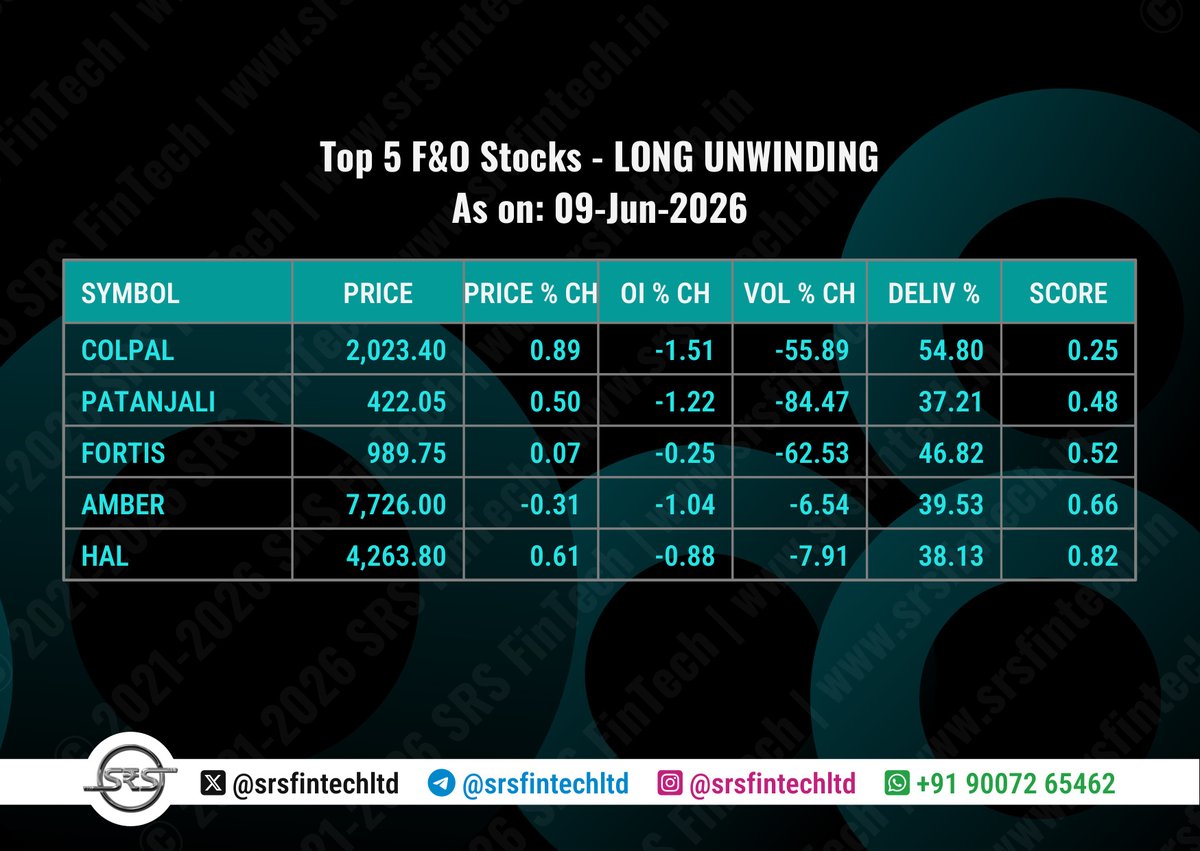
📊 F&O Market Top Stocks Report
09-Jun-2026
This report highlights the top 5 stocks across four key futures & options activity scenarios: Long Buildup, Short Buildup, Short Covering, and Long Unwinding, based on the latest trading day data.
Each stock is ranked by a score that combines multiple factors including price change %, open interest change %, volume change %, and delivery percentage. A lower score indicates stronger relative activity and potential market interest in that category.
⚠️ Disclaimer: This post is AI-generated and strictly for educational and informational purposes only. It does not constitute, contain, or imply any investment advice, stock recommendations, financial tips, or solicitation to buy or sell any securities or financial instruments. There are no references or suggestions related to Buy/Sell, Entry/Exit, Stop Loss (SL), or Target levels. Any market data or chart images shared are solely to illustrate technical concepts. We are not SEBI Registered Advisors, do not promote, solicit, or endorse trading decisions, and do not accept any liability for actions taken based on this content.
No compensation, association, or financial relationship exists between us and any entities or securities mentioned herein. Viewers are strongly advised to conduct their own research and consult with a certified financial advisor or SEBI registered professional before making any investment or trading decisions.
#StockMarket #Stocks #StockTrading #Trading #Investing #Investment #Finance #Money #Trader #Investor #ShareMarket #StockAnalysis #TechnicalAnalysis #Charting #MarketAnalysis #Success #Motivation #Entrepreneurship #MoneyMatters #InvestSmart #BuildWealth #TradeSmart #StockFundamentals #Dividend #FuturesTrading #OptionsTrading #FnOSegment #DerivativesMarket #OptionsStrategy #FuturesMarket #OptionsChain #EquityDerivatives #OptionsAnalysis #MarketVolatility #OptionsPremium #TradingStrategies #Hedging #RiskManagement #OptionsTrader


46
Jun 8
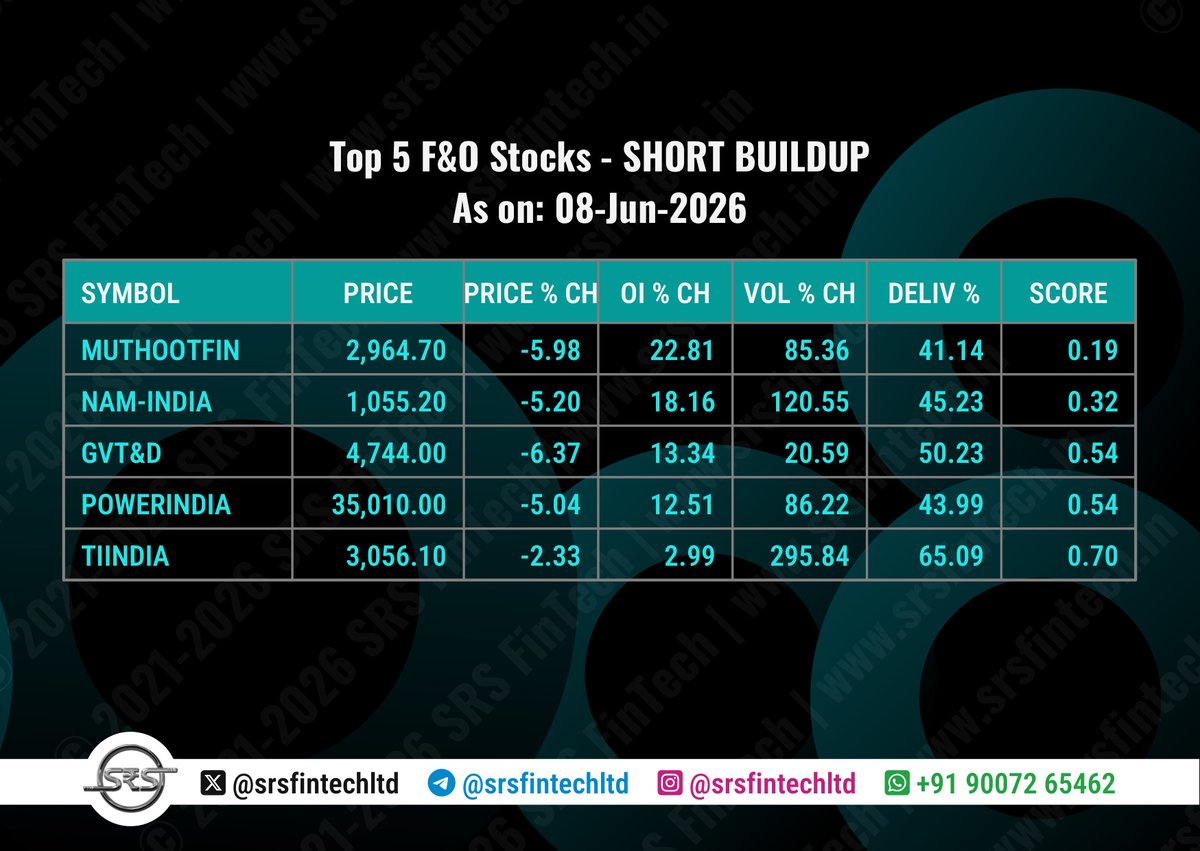
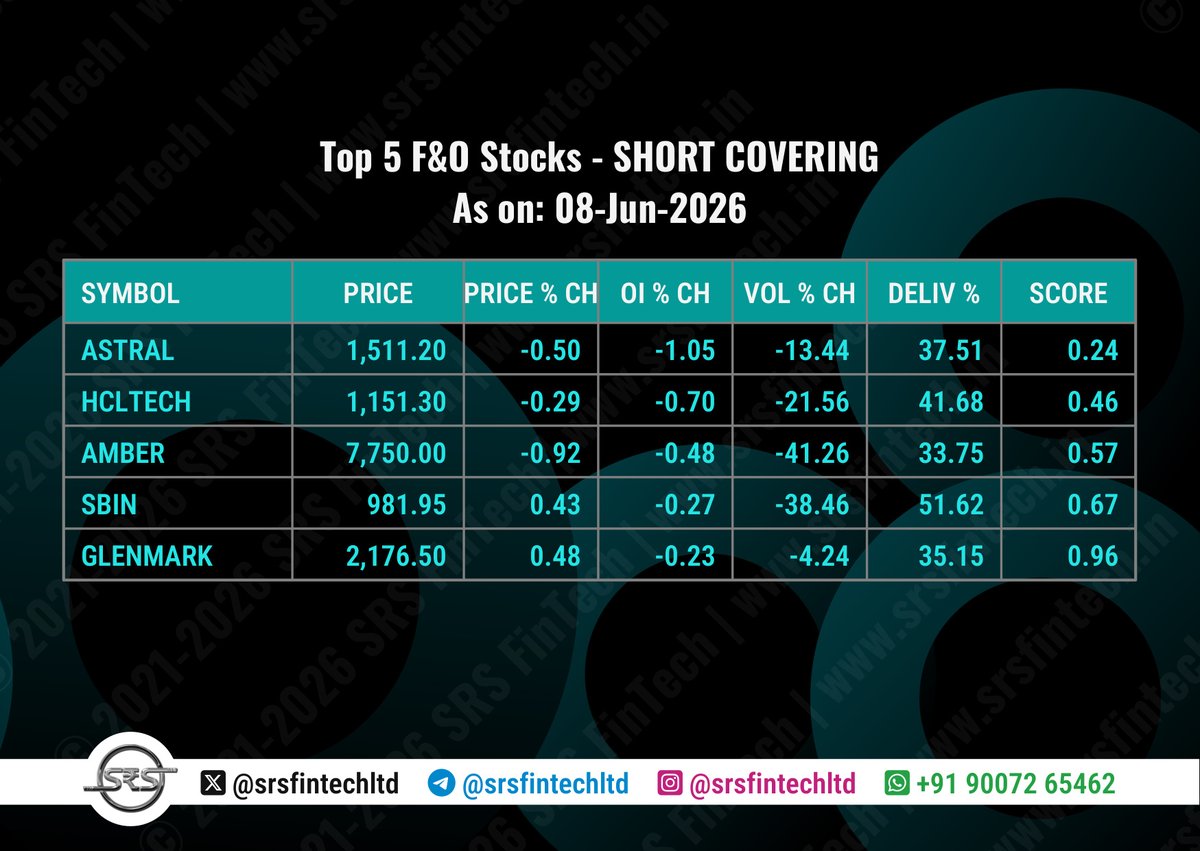
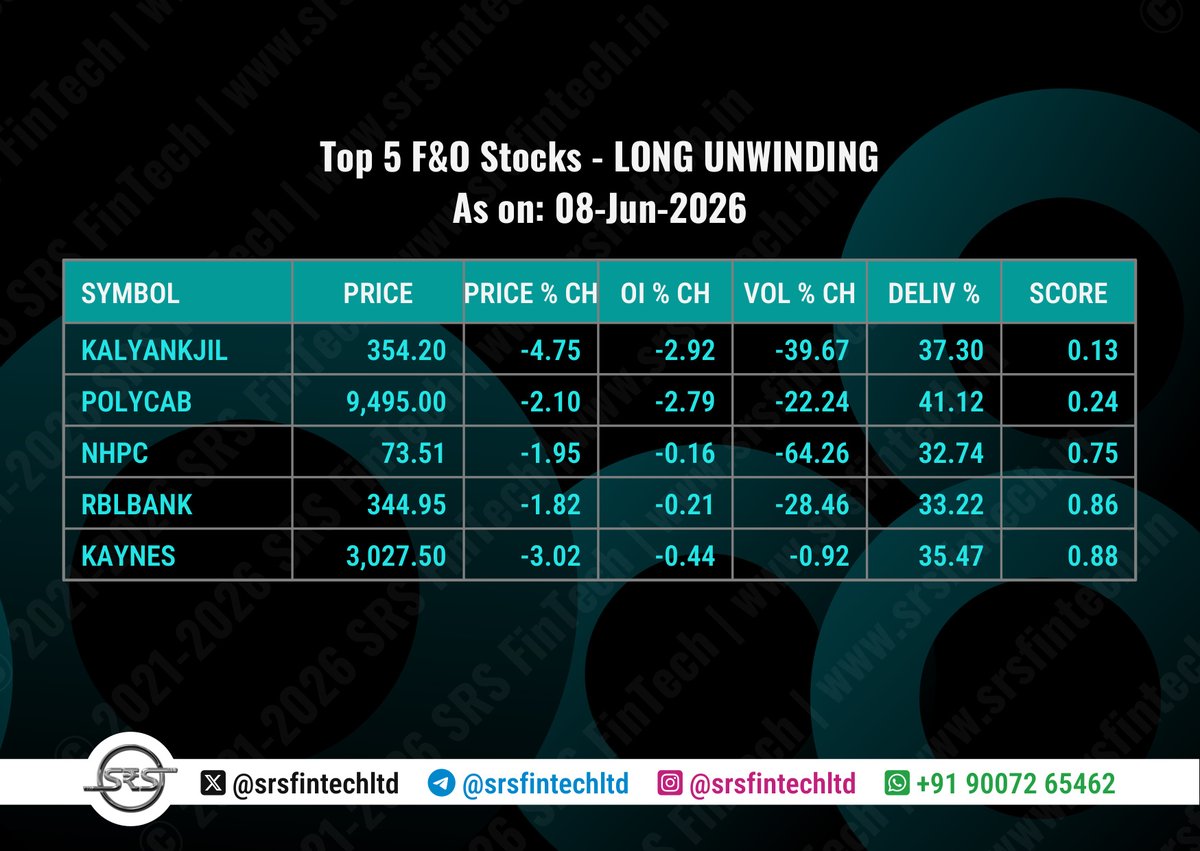
📊 F&O Market Top Stocks Report
08-Jun-2026
This report highlights the top 5 stocks across four key futures & options activity scenarios: Long Buildup, Short Buildup, Short Covering, and Long Unwinding, based on the latest trading day data.
Each stock is ranked by a score that combines multiple factors including price change %, open interest change %, volume change %, and delivery percentage. A lower score indicates stronger relative activity and potential market interest in that category.
⚠️ Disclaimer: This post is AI-generated and strictly for educational and informational purposes only. It does not constitute, contain, or imply any investment advice, stock recommendations, financial tips, or solicitation to buy or sell any securities or financial instruments. There are no references or suggestions related to Buy/Sell, Entry/Exit, Stop Loss (SL), or Target levels. Any market data or chart images shared are solely to illustrate technical concepts. We are not SEBI Registered Advisors, do not promote, solicit, or endorse trading decisions, and do not accept any liability for actions taken based on this content.
No compensation, association, or financial relationship exists between us and any entities or securities mentioned herein. Viewers are strongly advised to conduct their own research and consult with a certified financial advisor or SEBI registered professional before making any investment or trading decisions.
#StockMarket #Stocks #StockTrading #Trading #Investing #Investment #Finance #Money #Trader #Investor #ShareMarket #StockAnalysis #TechnicalAnalysis #Charting #MarketAnalysis #Success #Motivation #Entrepreneurship #MoneyMatters #InvestSmart #BuildWealth #TradeSmart #StockFundamentals #Dividend #FuturesTrading #OptionsTrading #FnOSegment #DerivativesMarket #OptionsStrategy #FuturesMarket #OptionsChain #EquityDerivatives #OptionsAnalysis #MarketVolatility #OptionsPremium #TradingStrategies #Hedging #RiskManagement #OptionsTrader

74
Jun 1
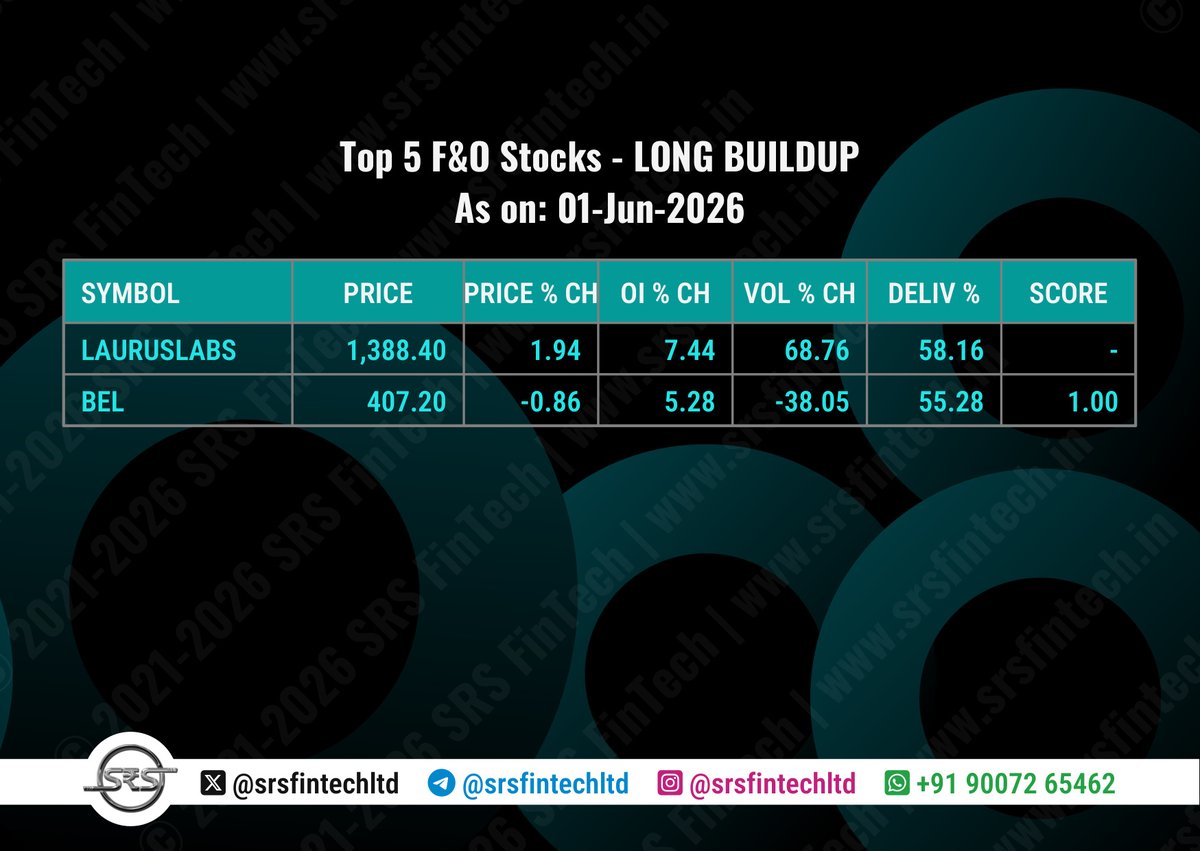
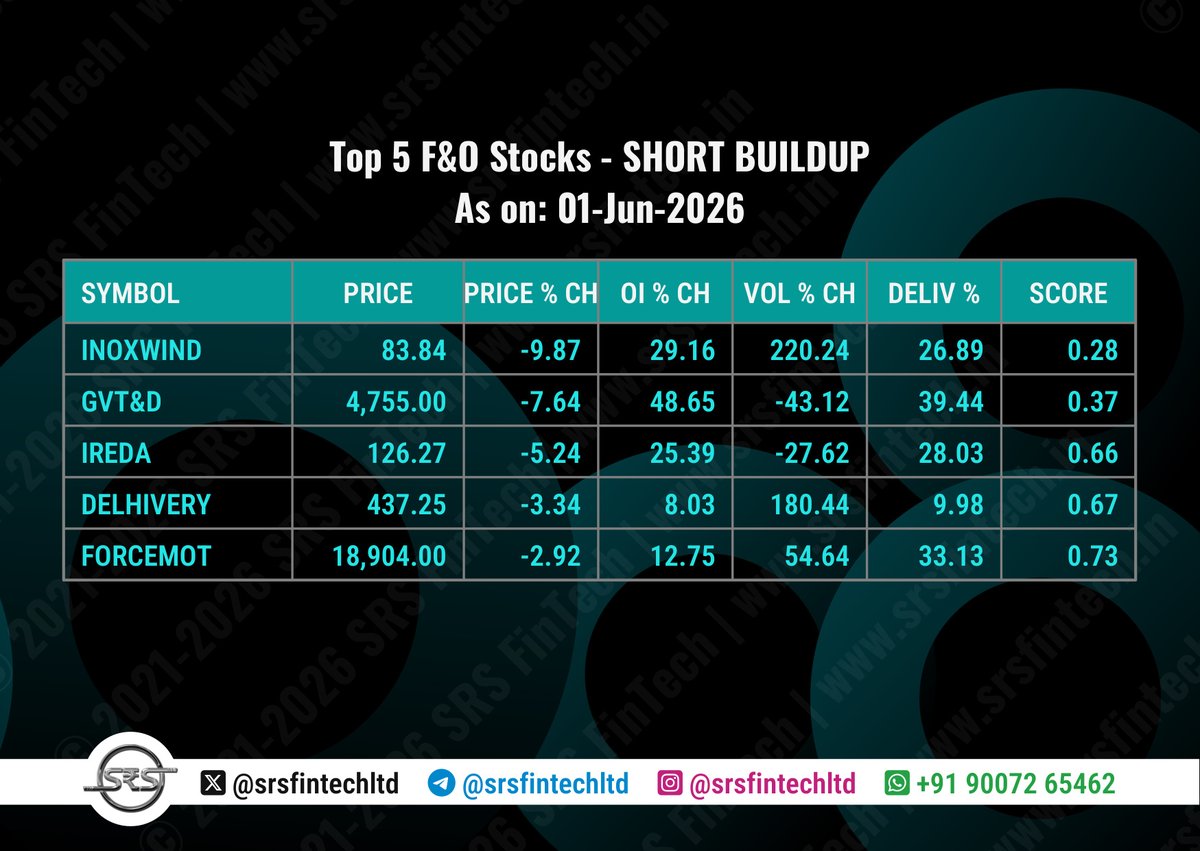
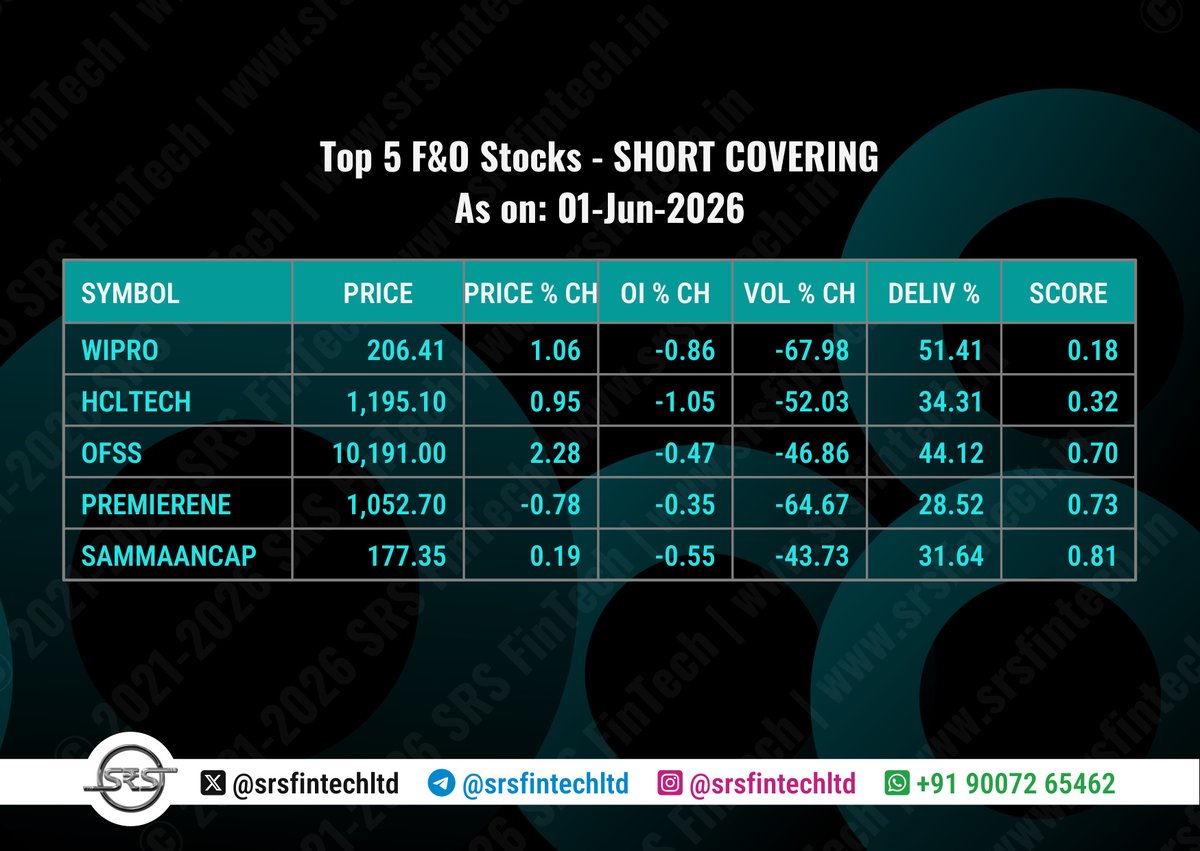
📊 F&O Market Top Stocks Report
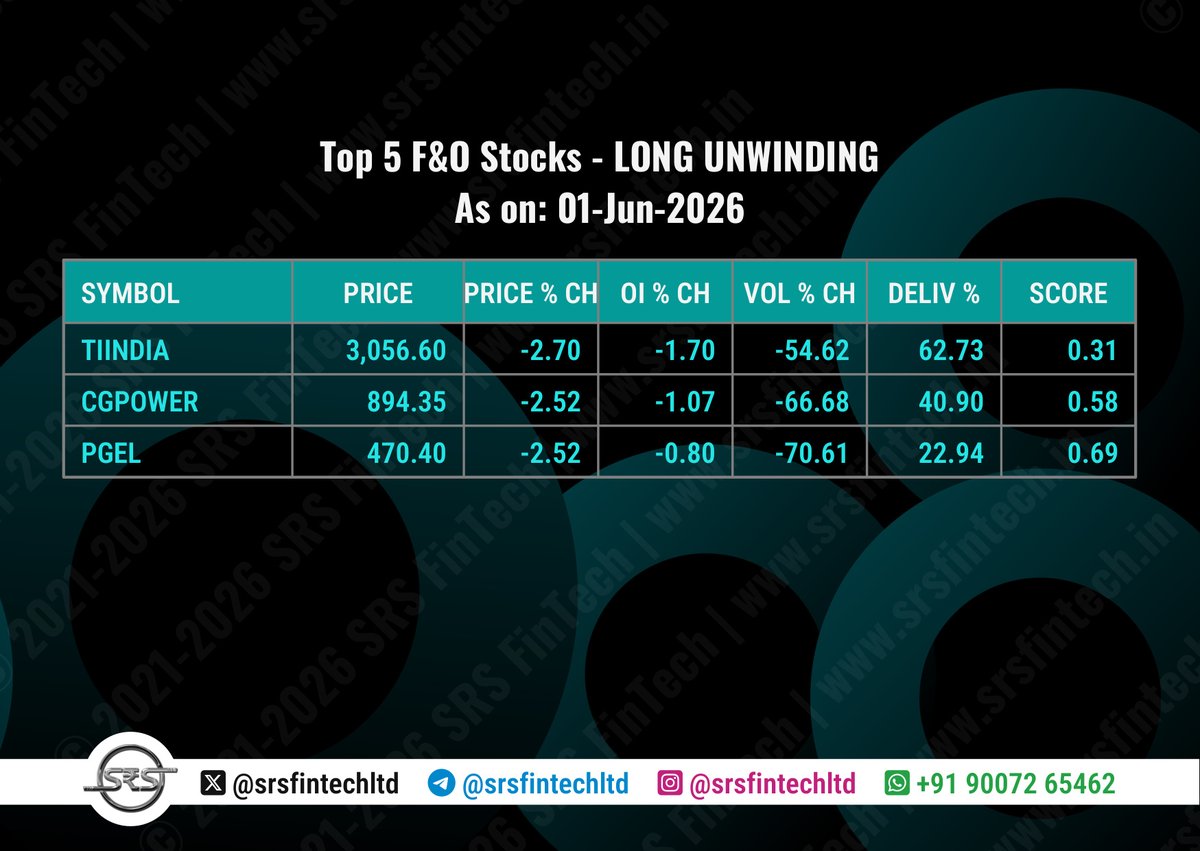
01-Jun-2026
This report highlights the top 5 stocks across four key futures & options activity scenarios: Long Buildup, Short Buildup, Short Covering, and Long Unwinding, based on the latest trading day data.
Each stock is ranked by a score that combines multiple factors including price change %, open interest change %, volume change %, and delivery percentage. A lower score indicates stronger relative activity and potential market interest in that category.
⚠️ Disclaimer: This post is AI-generated and strictly for educational and informational purposes only. It does not constitute, contain, or imply any investment advice, stock recommendations, financial tips, or solicitation to buy or sell any securities or financial instruments. There are no references or suggestions related to Buy/Sell, Entry/Exit, Stop Loss (SL), or Target levels. Any market data or chart images shared are solely to illustrate technical concepts. We are not SEBI Registered Advisors, do not promote, solicit, or endorse trading decisions, and do not accept any liability for actions taken based on this content.
No compensation, association, or financial relationship exists between us and any entities or securities mentioned herein. Viewers are strongly advised to conduct their own research and consult with a certified financial advisor or SEBI registered professional before making any investment or trading decisions.
#StockMarket #Stocks #StockTrading #Trading #Investing #Investment #Finance #Money #Trader #Investor #ShareMarket #StockAnalysis #TechnicalAnalysis #Charting #MarketAnalysis #Success #Motivation #Entrepreneurship #MoneyMatters #InvestSmart #BuildWealth #TradeSmart #StockFundamentals #Dividend #FuturesTrading #OptionsTrading #FnOSegment #DerivativesMarket #OptionsStrategy #FuturesMarket #OptionsChain #EquityDerivatives #OptionsAnalysis #MarketVolatility #OptionsPremium #TradingStrategies #Hedging #RiskManagement #OptionsTrader
1
1
86

May 30
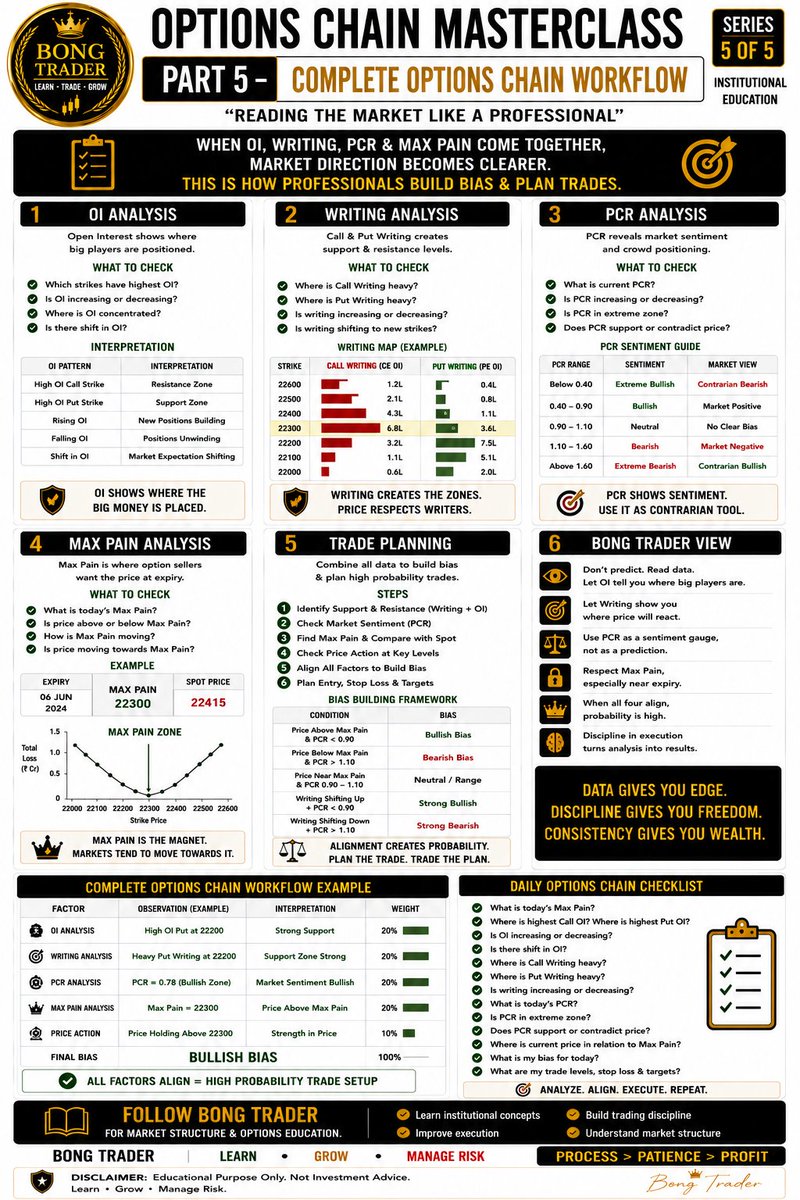
Options Chain Masterclass Part 5 | Complete Options Chain Workflow
#OptionsChain #OptionsTrading #OpenInterest #OIAnalysis #PCR #PutCallRatio #MaxPain #CallWriting #PutWriting #OptionSelling #OptionBuying #MarketStructure #PriceAction #TechnicalAnalysis #Nifty50 #BankNifty
3
48

May 26
#NIFTY 50 Technical View – Closing Basis (May 26, 2026)
Price Action & Structural Chart Observations
🔹 Psychological Threshold Rejection — The Nifty 50 surrenders its newly reclaimed milestone of 24,000, sliding down late in the session to finish officially at 23,913.70.
🔹 Daily Candlestick Pattern — Following an opening gap-up that tested intraday peaks, the index formed a corrective red candle, displaying sharp profit booking near upper boundaries.
🔹 Moving Average Intersections — Despite the intraday retracement, the index continues to float comfortably above its short-term 20-day Exponential Moving Average (EMA) near 23,825.
🔹 Medium-Term Trend Validation — Nifty remains structurally wrapped in a high-stakes battle around its 50-day EMA at 24,004, requiring a decisive close above this line to revive broad bullish continuation.
Key Technical Levels & Derivatives Alignment
🔹 Immediate Support Zone — The previous structural breakout pocket between 23,800 and 23,850 acts as the first line of defense for positional index bulls.
🔹 Crucial Floor Protection — Derivatives open interest concentration confirms solid protective Put writing blocks down at the 23,700–23,750 horizontal cushion.
🔹 Near-Term Resistance Marker — Sellers aggressively defend the 24,000 to 24,100 price corridor, which now shifts back to acting as an immediate tactical ceiling.
🔹 Major Expiry Supply Barrier — The options chain highlights heavy Call option concentration building up at the 24,400 and 24,500 strikes, capping sharp multi-day upside expansion.
#Nifty50 #TechnicalAnalysis #PriceAction #SupportAndResistance #OptionsChain #MovingAverages #DerivativeExpiry #DalalStreet
Disclaimer :
The information provided is for general informational purposes only and should not be construed as financial, investment, legal, or tax advice. Past performance is not indicative of future results. Each investor’s circumstances are unique; therefore, you should consult a qualified professional before making any financial commitments. While every effort has been made to ensure accuracy, I assume no liability for any errors or for outcomes resulting from the use of this information.
1
192
May 19
📊 F&O Market Top Stocks Report
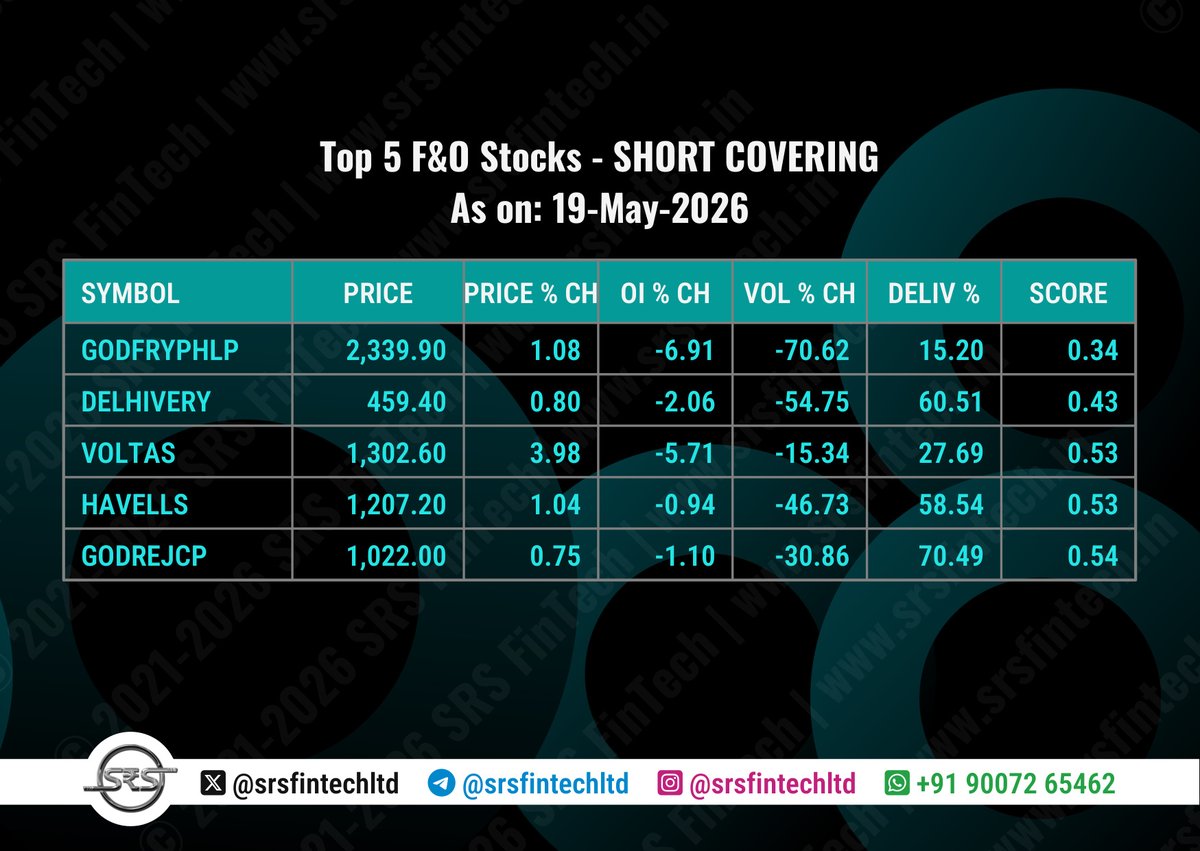
19-May-2026
This report highlights the top 5 stocks across four key futures & options activity scenarios: Long Buildup, Short Buildup, Short Covering, and Long Unwinding, based on the latest trading day data.
Each stock is ranked by a score that combines multiple factors including price change %, open interest change %, volume change %, and delivery percentage. A lower score indicates stronger relative activity and potential market interest in that category.
⚠️ Disclaimer: This post is AI-generated and strictly for educational and informational purposes only. It does not constitute, contain, or imply any investment advice, stock recommendations, financial tips, or solicitation to buy or sell any securities or financial instruments. There are no references or suggestions related to Buy/Sell, Entry/Exit, Stop Loss (SL), or Target levels. Any market data or chart images shared are solely to illustrate technical concepts. We are not SEBI Registered Advisors, do not promote, solicit, or endorse trading decisions, and do not accept any liability for actions taken based on this content.
No compensation, association, or financial relationship exists between us and any entities or securities mentioned herein. Viewers are strongly advised to conduct their own research and consult with a certified financial advisor or SEBI registered professional before making any investment or trading decisions.
#StockMarket #Stocks #StockTrading #Trading #Investing #Investment #Finance #Money #Trader #Investor #ShareMarket #StockAnalysis #TechnicalAnalysis #Charting #MarketAnalysis #Success #Motivation #Entrepreneurship #MoneyMatters #InvestSmart #BuildWealth #TradeSmart #StockFundamentals #Dividend #FuturesTrading #OptionsTrading #FnOSegment #DerivativesMarket #OptionsStrategy #FuturesMarket #OptionsChain #EquityDerivatives #OptionsAnalysis #MarketVolatility #OptionsPremium #TradingStrategies #Hedging #RiskManagement #OptionsTrader


1
2
1
85

OPTIONS CHAIN DATA LEARNING PART-1 #optionstrading #optionschain #stoc... youtube.com/shorts/Fd4Gqnr-0… via @YouTube
2
166
Apr 8
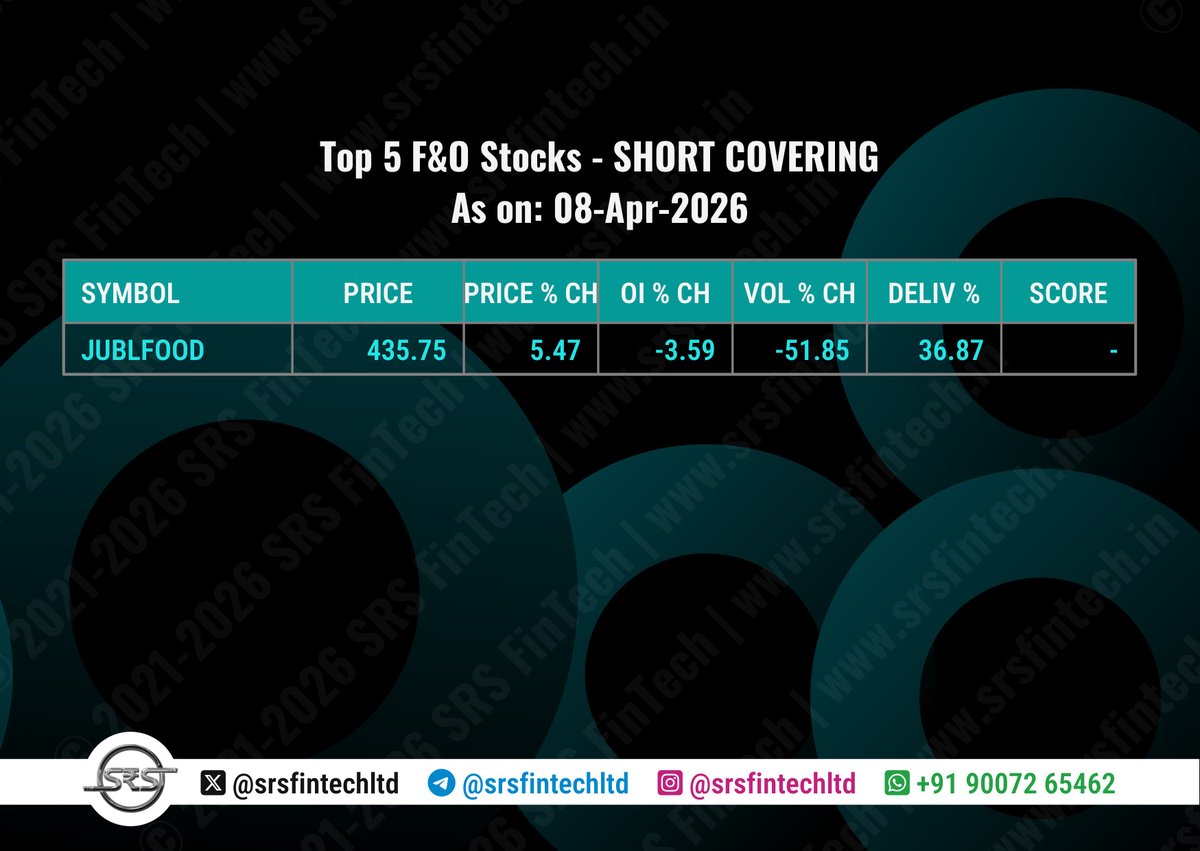
📊 F&O Market Top Stocks Report
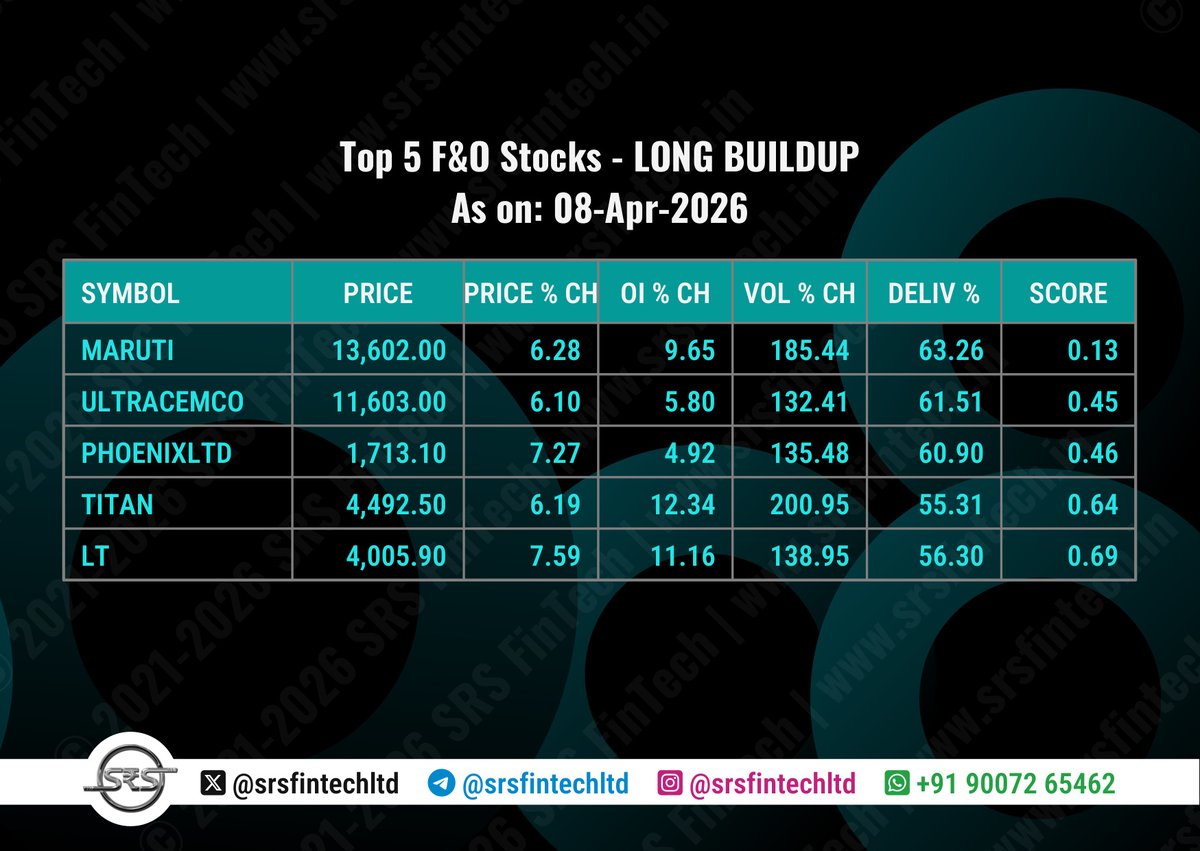
08-Apr-2026
This report highlights the top 5 stocks across four key futures & options activity scenarios: Long Buildup, Short Buildup, Short Covering, and Long Unwinding, based on the latest trading day data.
Each stock is ranked by a score that combines multiple factors including price change %, open interest change %, volume change %, and delivery percentage. A lower score indicates stronger relative activity and potential market interest in that category.
⚠️ Disclaimer: This post is AI-generated and strictly for educational and informational purposes only. It does not constitute, contain, or imply any investment advice, stock recommendations, financial tips, or solicitation to buy or sell any securities or financial instruments. There are no references or suggestions related to Buy/Sell, Entry/Exit, Stop Loss (SL), or Target levels. Any market data or chart images shared are solely to illustrate technical concepts. We are not SEBI Registered Advisors, do not promote, solicit, or endorse trading decisions, and do not accept any liability for actions taken based on this content.
No compensation, association, or financial relationship exists between us and any entities or securities mentioned herein. Viewers are strongly advised to conduct their own research and consult with a certified financial advisor or SEBI registered professional before making any investment or trading decisions.
#StockMarket #Stocks #StockTrading #Trading #Investing #Investment #Finance #Money #Trader #Investor #ShareMarket #StockAnalysis #TechnicalAnalysis #Charting #MarketAnalysis #Success #Motivation #Entrepreneurship #MoneyMatters #InvestSmart #BuildWealth #TradeSmart #StockFundamentals #Dividend #FuturesTrading #OptionsTrading #FnOSegment #DerivativesMarket #OptionsStrategy #FuturesMarket #OptionsChain #EquityDerivatives #OptionsAnalysis #MarketVolatility #OptionsPremium #TradingStrategies #Hedging #RiskManagement #OptionsTrader

2
61

Mar 26
$RANI 👁️ #Reputation is everything at that level in all industry..... #HistoricalData #GOTDROPS #ALLDAY #Data #Charting at 5x #Volume in @WebullGlobal @webull_mexico @Webull_Canada @WebullSingapore #FEEDS
"Høiland wouldn't risk his reputation (and likely a significant equity package) on a platform that hadn't shown him internal human data confirming the RaniPill actually works in the gut as intended."
#GameTheory #IV #OptionsChain #DarkPool #Accumulation #NFA
A good tactician and strategist plans for all scenarios. Your best laid plans will often be laid to waste once the chaos of battle ensues. This is why I feel it is imperative to plan for scenarios so when they arrive you can act accordingly as muscle memory takes over in case the pressure in the moment causes lizard brain. Totally normal and something anyone can work on adapting to imo... Anyways, lets get to THE GOOD SHIT.
Timeframe: After we inked Hoiland combined with historical data analysis when my alarms popped at 04:30 today.
The Frontline: Novo Nordisk and Eli Lilly are currently in a "Cold War" over oral GLP-1s. Novo’s Rybelsus (oral semaglutide) has absorption issues (less than 1%), requiring strict fasting.
The Strategy: Høiland knows exactly where Novo’s armor is thin. The RaniPill® bypasses the stomach's degradation issues.
Game Theory Prediction: RANI isn't looking to become a pharma giant; they are looking to be the "Universal Adapter." Høiland’s job is likely to leverage the Chugai precedent ($1B deal) to force a bidding war between Novo and Lilly for the rights to put their respective GLP-1s into the RaniPill. Rani doesn't want to sell their "Crown Jewel".... THEY WANNA MILK IT LIKE WE DO.... WE ARENT SELLING THE RANI PILL WE WILL SELL THE RIGHTS TO THE BIG BOIS SO THEY CAN BATTLE IT OUT OVER THEIR SHIT WITH OUR SHIT. This is my reasoning and has been my reasoning for continuing to up my position in Rani. God Bless and good luck today, and on all days. now...
LETS FUCKIN GET LOCKED IN. WE GOT WORK TO DO. Data drops will come as able. please have patience if requesting specifics but I will try and answer questions too. @Stocktwits @markets @NeptuneCigars @WSJmarkets @TipRanks @tradingview @US_FDA @teamnovonordisk @EliLillyandCo @Merck @JNJNews @JNJHealthEquity @MarketWatch @bullishbruk #NFA @joeroganhq @ShawnRyanShow #Biotech #Market #Undervalued #Asset
3
2
3
751

Jan 25
🚨 NIFTY 25,000 — OI SHAKEOUT!
📊 Nifty near 25,048
🛡️ 25,000 PUT still active, but
🔻 OI change: -36,500 contracts
⚠️ Big unwinding at key support — some bulls booking profits, volatility rising near 25K.
#Nifty50 #OptionsChain #MarketUpdate #25K #IndianMarkets
5
417

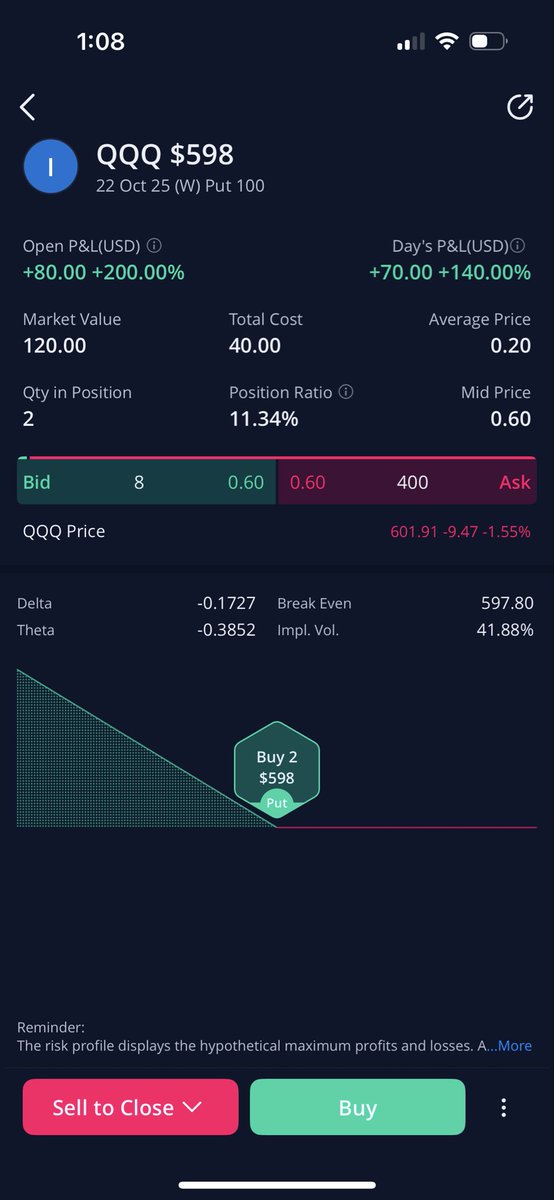
22 Oct 2025
Wish I could sell my options on @WebullGlobal Webull mobile! Missing out on money and the brokers have nothing to say?? #optionschain
1
4
503

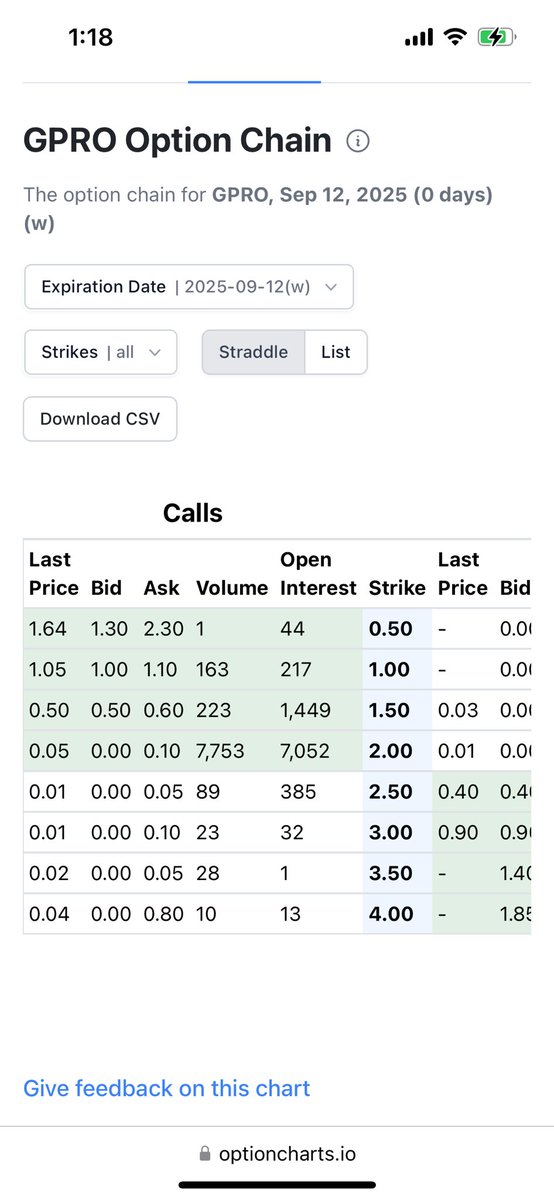
12 Sep 2025
Over 8,000 call options in the money this week for $GPRO , max pain was $1.50 . #Gammasqueeze #optionschain #lighterfluid #NFA #Cover
1
2
388

11 Sep 2025
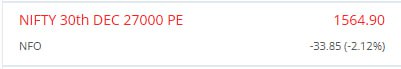
Where is #option intrinsic value & time value???
Look December this year 27k put trading at 1594 range & nifty spot at 25k. Writers so confident in wrting deep in the money Far Month contracts and many calling we are in a FEAR MARKET. I am strongly opposing the same & for me its a GREED MARKET.
Even though we may see 25400 near in coming days, BUT AM EXPECTING A GOOD DOWN MOVE WITH TARGET NEAR TO 23400.
Many say market in good conditions but i am expecting a down move which majority will miss.
@Shijumonantony ❤️👍pointing this
#nifty #optionschain #openinterest
3
165

7 Sep 2025
NIFTY Update (Valid for 08-09-2025 Only)
📊 Last Close: 24,741
✅ Strong Above 24,798 → Targets: 24,832 ▸ 24,924 ▸ 24,981
❌ Weak Below 24,685 → Targets: 24,650 ▸ 24,610 ▸ 24,501
📌 Note: A daily close above 24,861 may trigger sustained buying momentum.
24685 ke Niche Trump Ki Friendship Kaam nahi aayegi.
#Nifty50 #BankNifty #Sensex #IndianStockMarket #StockMarketIndia #EquityResearch #MarketResearch #DataAnalysis #TechnicalAnalysis #StockMarketAnalysis #NiftyResearch #BankNiftyResearch #OptionsTradingIndia #TradingViewIndia #StockMarketResearch #MarketUpdates #StockResearch #FinancialMarkets #MarketOutlook #TradingStrategies #NiftyAnalysis #BankNiftyAnalysis #OptionsData #IndexAnalysis #OpenInterest #OIAnalysis #OptionsChain #StockMarketNews #InvestingIndia #MarketTrend
1
109

Was studying the #Nifty 25000 PE chart and noticed something that could change the game…
Curious to know what it is??
#Nifty50 #optionschain #Inflation #Markets #OptionsTrading
1
3
512

12 Aug 2025
Options chain analysis ahead of CPI
While traders watch price action, professionals read positioning.
Current setup reveals institutional boundaries:
S&P: 6,015 VIX: 14.8 ( 3%) Put/Call: 0.95
Here's what the options are screaming 👇
#OptionsChain #CPI
30
4,834

10 Jul 2025
Be ready to see dugged up 'bearish' tweets of your fav finfluencers who were calling for breakout just a couple of days ago. 🤣🤣🤣
#Nifty #NiftyBank #NiftyTraders #OptionsChain #OptionsData
2
142