

Jun 8
I mean its just like how people tend to only learn react cause their job forces em into it and due to that they never look outside of the box,everyone outside of that box just uses modified chartjs of some sorts paying for trading views chart would be wild especailly in 2026
26

Jun 8
just use chartjs and modify that solid foundation for whatever
1
1
397

𝟓 𝐁𝐞𝐬𝐭 𝐉𝐒 𝐂𝐡𝐚𝐫𝐭 𝐋𝐢𝐛𝐫𝐚𝐫𝐢𝐞𝐬 𝐟𝐨𝐫 𝐃𝐚𝐭𝐚 𝐕𝐢𝐬𝐮𝐚𝐥𝐢𝐳𝐚𝐭𝐢𝐨𝐧 𝐢𝐧 𝟐𝟎𝟐𝟔
Most developers do not struggle to find a chart library. They struggle to choose the right one.
Chart.js, D3.js, Apache ECharts, Highcharts, and AnyChart each solve different problems. The best choice depends on your data volume, customization needs, performance requirements, and development stack.
A practical comparison of the top JavaScript chart libraries shaping data visualization in 2026.
#JavaScript #DataVisualization #ChartJS #D3JS #ApacheECharts #Highcharts #analyticsinsight #analyticsinsightmagazine
Read More 👇
zurl.co/ldb5C

33

Jun 2
Built a Multi-Page Freelance Dashboard using Tailwind and Chart.js.
Designed an admin interface with project tracking, profile settings, and data visualizations.
Focused on dynamic layouts, notification systems, and UI consistency.
#Dashboard #WebDev #ChartJS #Internship
6
144

May 13
this chart above is my creation made with Claude by the way. you can recreate/ verify it for yourself with this prompt:
--- prompt starts ---
Create an interactive 50-state scatter plot visualizing the "carefare" thesis: home care employment vs. Medicaid budget share, with dots colored by elderly population share.
CHART:
- Title: "Home care employment and Medicaid budget share, by state"
- X-axis: "Aides per 1,000 residents aged 65 " (range 0-180)
- Y-axis: "Medicaid as % of state-funded budget" (range 0-32, percentage format)
- Dashed national-average reference lines at x=65 and y=14.2%, labeled "nat. avg 65 aides" and "nat. avg 14.2%"
- Color dots by % age 65 on a 5-bin blue ramp (lightest <16%, darkest >21%); include a horizontal color-bin legend
- Larger dots (radius 9) and full-name labels for focus states: New York, California, Texas, Florida
- Smaller dots (radius 6) for the rest, with state abbreviation labels for the top/bottom outliers and mid-quadrant carefare cluster; show all states on hover with tooltip "{State}: {x} aides per 1k elderly · {y}% Medicaid share · {age}% age 65 "
- Use Chart.js with chartjs-plugin-datalabels
DATA — please look up all 50 state values yourself from these sources, no estimates:
- X-axis (aides per 1,000 residents aged 65 , 2024): America's Health Rankings, "Home Health Care Workers" indicator, derived from BLS LAUS. URL: americashealthrankings.org/e…
- Y-axis (Medicaid as % of state-funded budget, SFY 2022): MACPAC MACStats Exhibit 5, derived from NASBO State Expenditure Report. URL: macpac.gov/wp-content/upload…
- Color (% population age 65 , 2024): America's Health Rankings, "65 Population" indicator, derived from Census Bureau population estimates. URL: americashealthrankings.org/e…
Verify each value against the source before plotting; flag any state you couldn't source. Cite the three sources in a small footer line beneath the chart. Omit DC.
1
2
10
3,713
Apr 26
Upd AJAX/ #PHP template Version 3.439 - 26-Apr-2026 (CU-plugin) update to use ChartJS instead of Highchart graphs, add Wind Rose to wxtrends page, add wxcugauges Steel Series Gauges, add wxcurecords for all-time records, updated CU-tags.txt/CU-tags-comments.txt templates for CUtags.php to fix all-time low wind chill.
(Base-*) update check-fetch-times.php V1.62 for CU-plugin support, wxgraphs.php for CU graphs with ChartJS bit.ly/gLdrTq
1
3
350

1
3
164

Apr 8
working on your wedding day for “The complete intelligence platform for ecommerce”
so like a few chartjs dashboards?
not even a heartfelt passion driven indie game 😮💨
3
112


Mar 1
Build line, bar, and pie charts in react using chart.js.
#react #chartjs #frontend #codewolfy
codewolfy.com/react-chart-js…
3
400
Mar 1
Learn chart.js integration in react for professional analytics dashboards.
#react #chartjs #frontend #developers #codewolfy
codewolfy.com/react-chart-js…
2
2,426

Feb 28
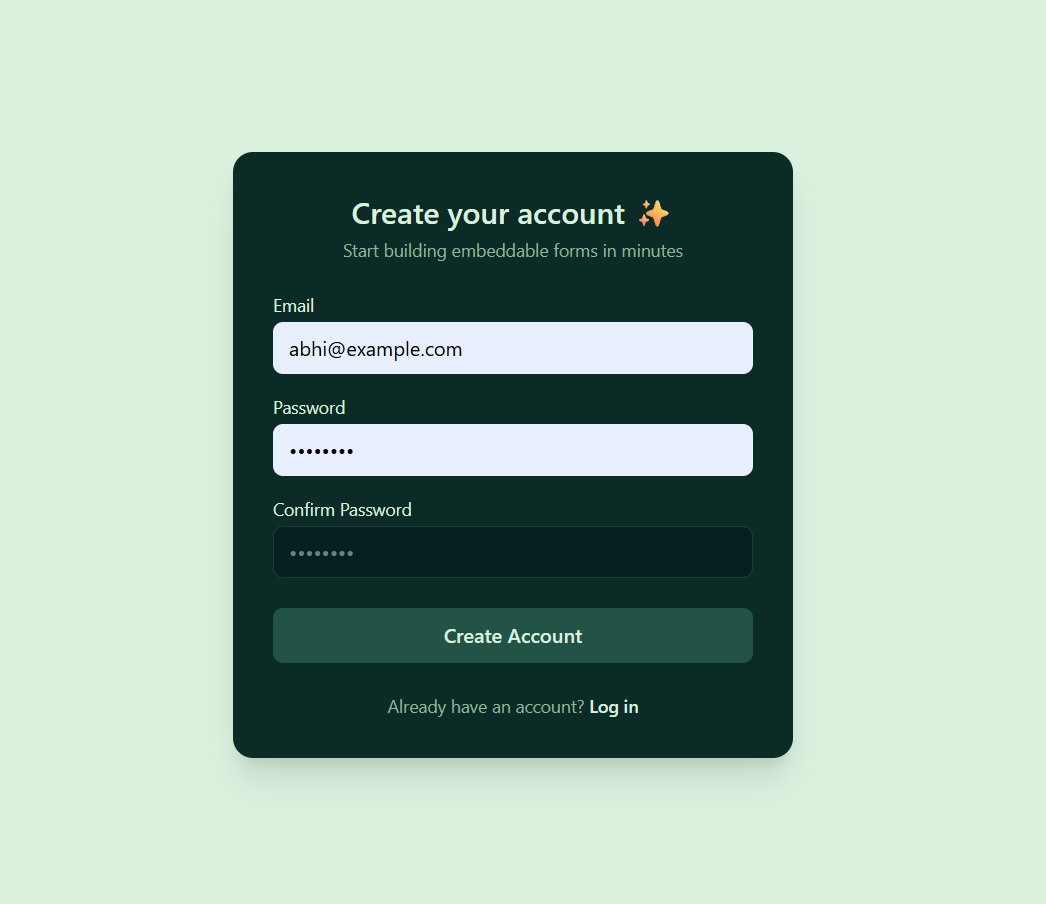
Day 25 & 26 of coding till I get placed
-Created a Form builder
-Implemented auth
-Learned Firebase (though I didn't like it much)
-Analytics with ChartJS
-Real-time responses
-Live Preview
-Dashboard showing responses vs forms
-Lil Backend
#BuildingInPublic
#LearnInPublic
1
16
379


Feb 11
Well, it's a component I'm designing to use ChartJS charts in Streamlit as a component.
Are you familiar with Streamlit?
25

vue-chartjs is a Vue wrapper for Chart.js by @apertureless, helping you to quickly set up simple charts 📈📊 - madewithvuejs.com/vue-chartj…
1
7
693

Kalo gak salah inget, gw pernah coba Tableau ini untuk generate comparison chart penggunaan bahan baku masakan di sebuah perushaan, tp akhirnya gw putuskan u pake chartjs atau apa yg lbh sesikit featurenya tapi cukup u kebutuhan gw.
Hal lain, gw prefer open source free tools ketimbang yg berbayar.
Untuk kebutuhan yang lebih kompleks sih ini bisa jadi solusi bagus.
1
751

Day 5 of coding till I get placed 🎯
-Explored React table for Sorting and Pagination
-Explored ChartJs
-Started with my Frontend project
-Practiced some JS questions
I am going to give full time to this Frontend project so that I can complete it by tomorrow.
#BuildInPublic
6
123