
"I have sales data… but I don’ know what it's telling me."
That’s what a small business owner told me last month.
So I sat down with my students and we built a BI dashboard from real sales data.
Here’s what we learned and why it matters for your business.
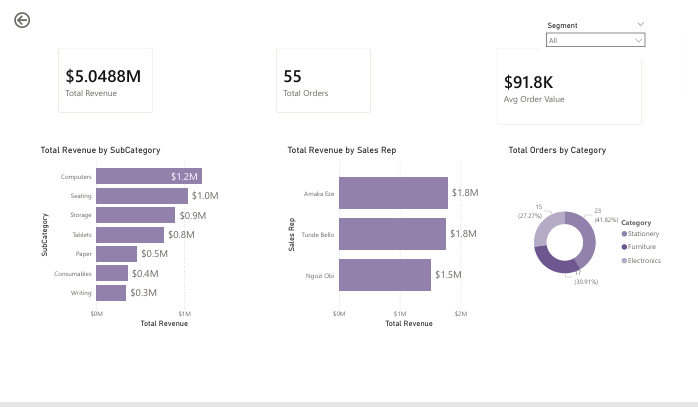
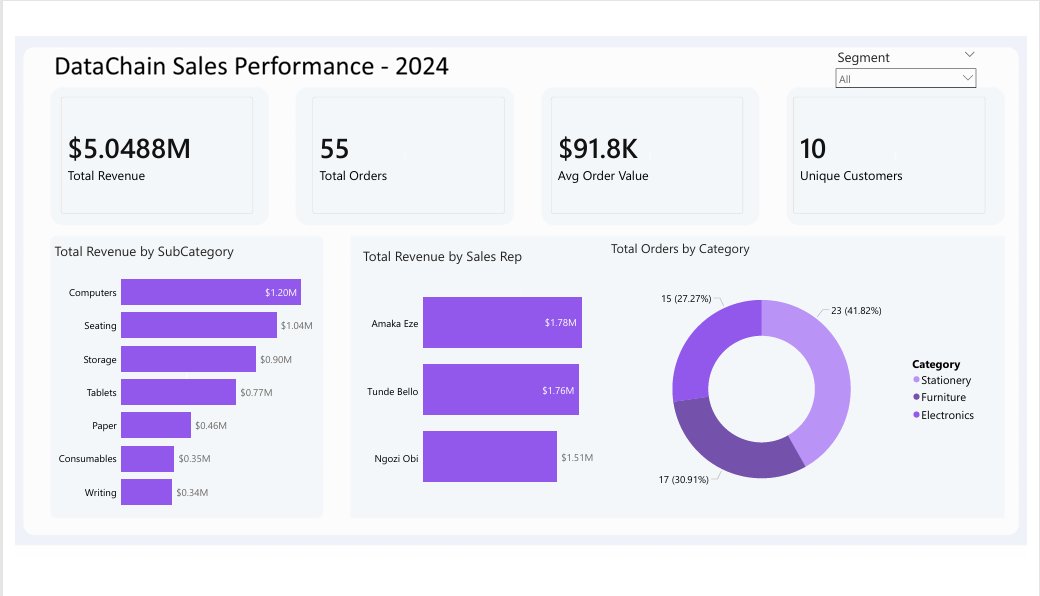
The numbers at first glance:
→ $5M revenue
→ 55 orders
→ 3 sales reps
Looks fine, right?
But the story was hiding underneath.
🔍 We asked simple questions:
❓ Why do we have 23 furniture orders but only 17 electronics orders yet electronics brought in almost the same revenue?
→ Maybe furniture sells in lower value per order. That changes how you train your sales team.
❓ Three reps made almost the same revenue ($1.7M each) but did they sell the same things?
→ One might be selling high-volume low-margin items. Another might be selling fewer but bigger deals. Different coaching needs.
❓ Subcategories like "Writing" and "Consumables" are at the bottom should we drop them or market them better?
→ Data doesn't shout the answer, but it points to the question.
What we built:
A simple dashboard that turns messy spreadsheets into clear answers without needing a data science degree.
And the biggest lesson for small business owners:
You don't need more data. You need the right view of the data you already have.
I’m sharing this because:
I help small business owners and beginners learn how to use BI tools (like Power BI, even Excel) to stop guessing and start growing.
✅ Open for 1-on-1 coaching
✅ Open for small group workshops
✅ Also available for consulting, let me look at your data and build you a dashboard that actually helps you decide.
📩 DM me "DATA" and I’ll send you a simple template to get started.
No jargon. No fluff. Just practical help.
#SmallBusiness #DataForBeginners #BusinessIntelligence #BIcoaching #SalesDashboard

1
2
10
213

Stop chasing too much data.
Focus on what the data is actually telling you.
It’s not about how much you have,
it’s about the insight you can get from it. 📊✨
#NaijaDataProfessor #DataForBeginners #AnalyticsSimplified #LearnData
6


16 Oct 2025
Understanding Data Science Lifecycle - Step-by-Step Explained in Simple Terms
Watch >> youtu.be/WN908S4ALF0
Join Telegram: t.me/learnitguidetutorials
#DataScience #DataScienceLifecycle #AI2025 #MachineLearning #MLOps #DataAnalytics #AIExplained #DataForBeginners

24


9 Oct 2025
Title:
👉 “What Is Data? (Explained in the Simplest Way!)”
👇
#DataExplained #BusinessGrowth #DataDriven #LearnData #EcommerceInsights #ProjectAlpha #DataForBeginners #Day87Journey #SmallBusinessTips #TechMadeSimple
1
8

5 Aug 2025
You don’t need Data Analytics experience. You need exposure." My sessions are beginner-friendly & built for growth. Get slotted for September. #NoExperienceNoProblem #LearnTechSkills #DataForBeginners #PythonForStudents

16

14 Jul 2025
📅 Day 15 of #100DaysOfDataAnalysis
Today, I started learning SQL , a tool that helps you ask questions from data 🧠💻
I’m excited to keep learning and growing!
#SQL #LearningData #DataForBeginners #DataCommunity

2
46


10 May 2025
100% off Udemy course coupon
Data Science & Data Analytics Real World Projects
First step towards Data Science in this competitive job market
korshub.com/courses/bigdata-…
#DataScienceProjects #DataAnalytics #LearnDataScience #DataForBeginners #Korshub
13

29 Apr 2025
• Tracked monthly performance
• Summarized yearly trends
. Pulled out top trading volume days
Your data girl is not playing😌
Might not be perfect yet, but I’m learning and getting better one step at a time.
#SQLProject #DataForBeginners #BlackTechTwitter
1
24

25 May 2024
youtu.be/2qChy77AhzY
Why Everyone Wants Your Data: The Hidden Truth Explained
#WhatIsData #DataBasics #UnderstandingData #DataExplained #TechEducation #DataForBeginners #LearnData #DigitalWorld #TechSavvy #Data101
29

25 May 2024
What is Data Explained in Hindi! ? Why Everyone Wants Your Data | The Hi... youtu.be/2qChy77AhzY?si=F2Kg… via @YouTube #DataHindi #WhatIsData #DataBasics #UnderstandingData #TechEducation #DataForBeginners #LearnData #DigitalIndia #TechSavvy #DataExplained
1
68

26 Jul 2022
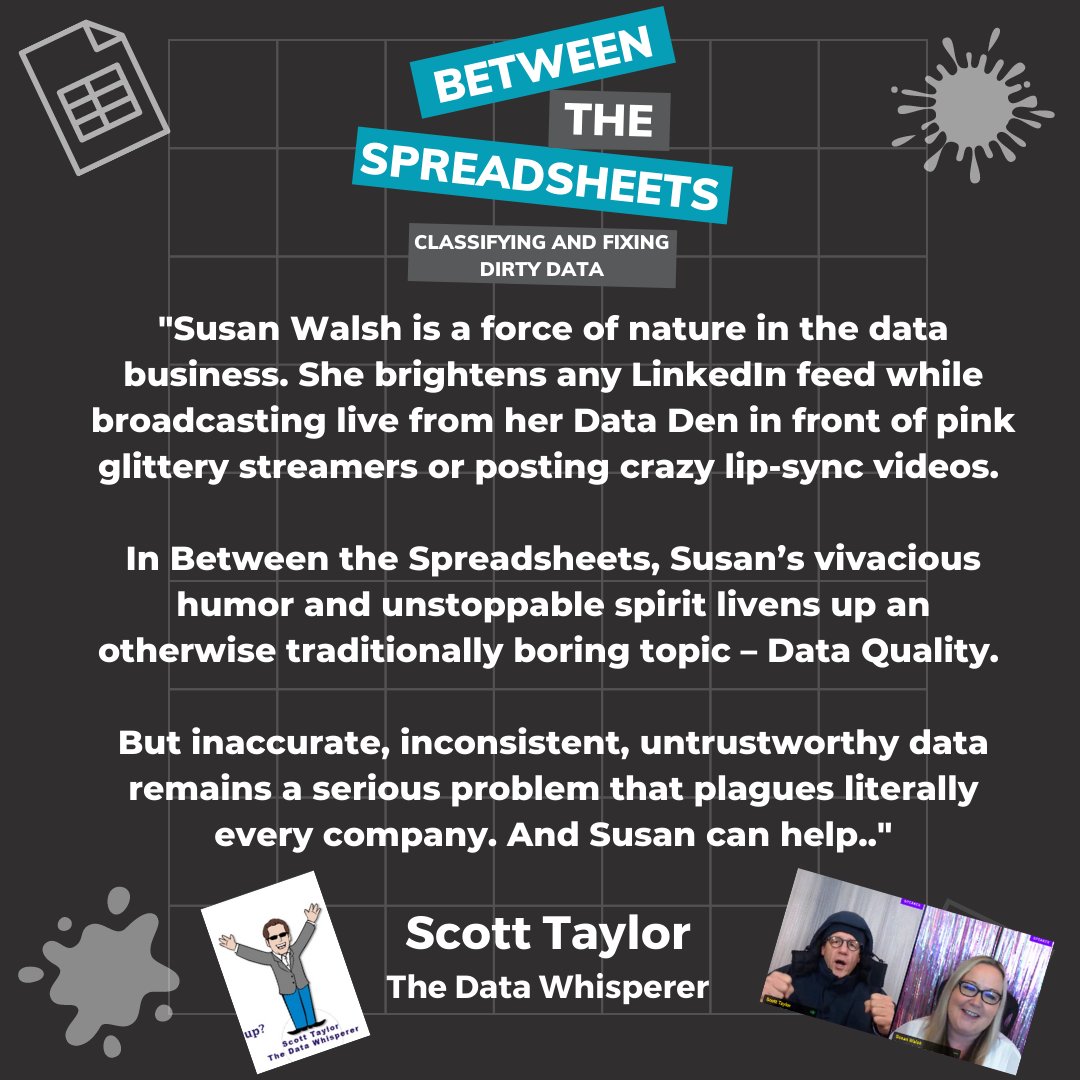
A lovely endorsement for 'Between the Spreadsheets' from my good friend Scott Taylor, The Data Whisperer!
Pick up your copy here: amzn.to/3INCKz4
#book #author #data #dataforbeginners #classification #selfhelp

4
14 Jul 2022
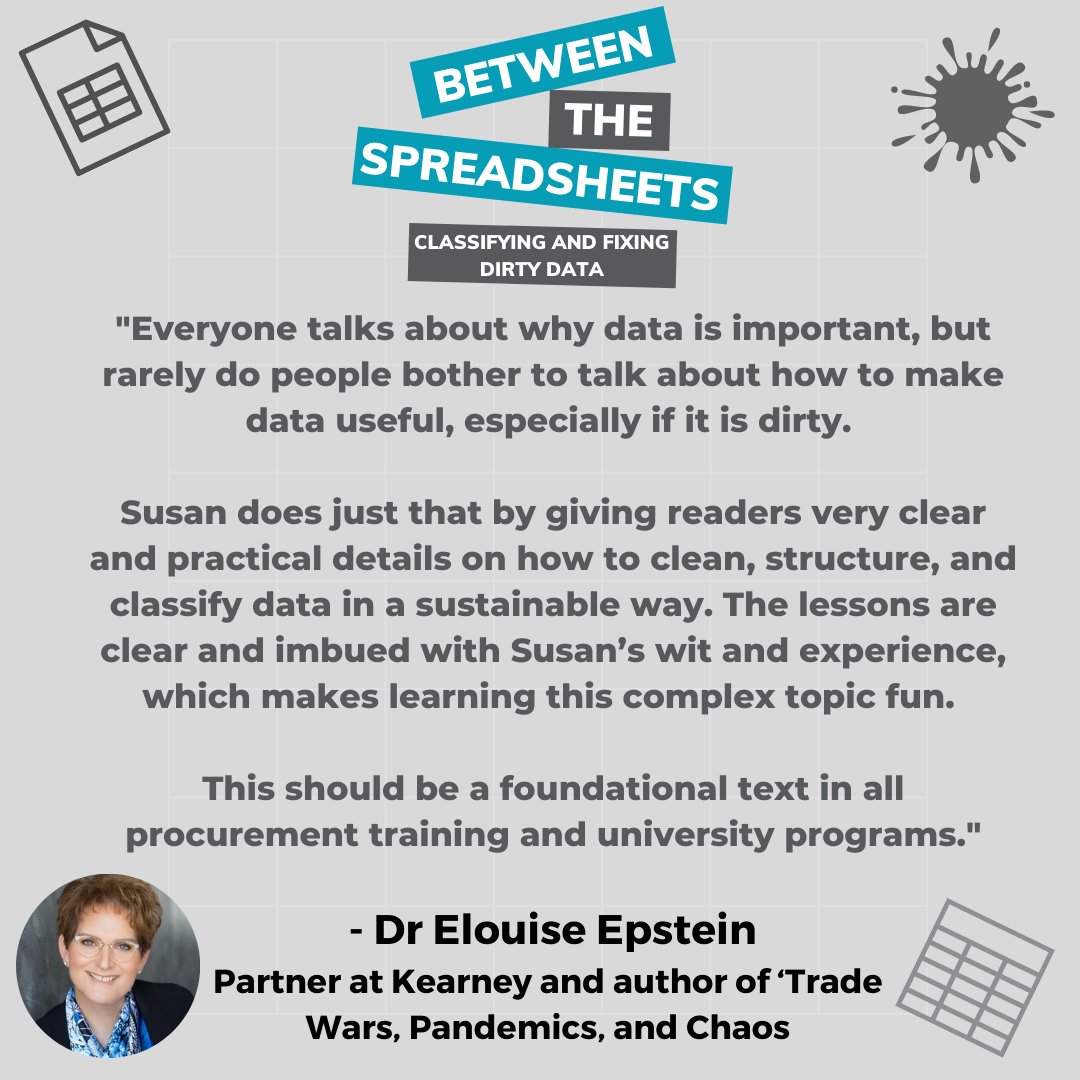
Did you know THEE Dr Elouise Epstein loves my book?
She does! LOOK 😍
Want to love it too? Pick up a copy here: amzn.to/3vyJiN1
#author #bookreview #classification #dataforbeginners #datascience #datacleansing

1
2
9 May 2022
Did you know THEE Dr Elouise Epstein loves my book?
She does! LOOK 😍
Want to love it too? Pick up a copy here: amzn.to/3vyJiN1
#author #bookreview #classification #dataforbeginners #datascience #datacleansing
2
26 Apr 2022
A lovely endorsement for 'Between the Spreadsheets' from my good friend Scott Taylor, The Data Whisperer!
Pick up your copy here: amzn.to/3INCKz4
#book #author #data #dataforbeginners #classification #selfhelp

3
1 Feb 2022
A lovely endorsement for 'Between the Spreadsheets' from my good friend Scott Taylor, The Data Whisperer!
Pick up your copy here: amzn.to/3INCKz4
#book #author #data #dataforbeginners #classification #selfhelp
2
2