
Just noticed something about how @prjx_hl volume correlates with Hyperliquid perp open interest.
Over the past week, every time HYPE spot volume on prjx𝘩𝘭 𝘤𝘳𝘰𝘴𝘴𝘦𝘴 $15𝘔 𝘪𝘯 𝘢 4-𝘩𝘰𝘶𝘳 𝘸𝘪𝘯𝘥𝘰𝘸, 𝘱𝘦𝘳𝘱 𝘖𝘐 𝘰𝘯 𝘏𝘺𝘱𝘦𝘳𝘭𝘪𝘲𝘶𝘪𝘥 𝘪𝘯𝘤𝘳𝘦𝘢𝘴𝘦𝘴 𝘣𝘺 𝘳𝘰𝘶𝘨𝘩𝘭𝘺 7-12% 𝘸𝘪𝘵𝘩𝘪𝘯 𝘵𝘩𝘦 𝘯𝘦𝘹𝘵 𝘩𝘰𝘶𝘳. 𝘛𝘩𝘦 𝘳𝘦𝘷𝘦𝘳𝘴𝘦 𝘢𝘭𝘴𝘰 𝘩𝘰𝘭𝘥𝘴: 𝘸𝘩𝘦𝘯 𝘖𝘐 𝘥𝘳𝘰𝘱𝘴 𝘴𝘩𝘢𝘳𝘱𝘭𝘺, 𝘱𝘳𝘫𝘹hl pool fees spike as LPs reposition.
This suggests the DEX isn't just a spot venue, it's the liquidity runway for the entire perp ecosystem. Traders accumulate on prjx_hl, then open perp positions. When they deleverage, they rotate back through the same pools.
The 0.05% HYPE/USDC tier acts as the primary onramp. Over 60% of HYPE volume flows through it, and the APR has been climbing from 40% to 68% in 10 days. That's not because more people are farming, but because the same capital is being reused more times per day.
If this pattern holds, prjx_hl becomes the price discovery layer for the entire Hyperliquid perp market. The spot liquidity determines how effectively traders can size up or unwind, and that gives the LPs here a structural advantage that goes beyond yield
$HYPE

3
3
32

Markets participants are being too optimistic, especially the markets in Asia. Leverages that have been used in the Korean Stock Market is insane, comparable to the Chinese Stock Market in 2015. Bubbles will burst, and people will have no time to react but to be liquidated.
Not calling for top right now, but would be a smart move to deleverage some positions.
#stock #ewy
13

If you're overleveraged you will get liquidated even with dividend stocks. Momentum chasing works when you apply a 2 to 3 x leverage and deleverage ahead of earnings calls, FOMC meetings, PCE and job data announcement and of course potential war announcements.
1
1
16

GOLDMAN SACHS ON INDIA CONSUMER DURABLES
Maintained BUY on LG Electronics India and Havells; maintained SELL on Voltas
April and May volumes missed expectations, though full-quarter estimates remain intact; price increase expectations have been lowered
Expecting 16-29% year-on-year revenue growth across coverage for Q1 despite tempered pricing
Facing headwinds from raw material inflation, rupee depreciation, and operating deleverage that price hikes have not fully offset
El Niño-induced weak monsoons and shifts in Betu summer patterns raise uncertainty for Q1 and Q2 demand
Voltas remains highly sensitive to seasonality; LG and Havells are better protected by their diverse, non-cooling product portfolios
139


True 🤣
A Trade Meeting with Pauline Hanson and China would be funny as fck. No more 'Age of Iron for China' eh?
Well, thats one way to deleverage Australia from the Chinese Economy and Diversify our Trade
Do you think Pauline would make China mad? 🤣

PM questions Hanson’s ability to deal with Asian neighbours afr.com/politics/federal/pm-…
1
21


I’m purely speculating but perhaps he would try to find a financial buyer to get rid of FIG (and Dhyvia, thank God), and then use the proceeds to deleverage, while focusing primarily on merchant payments, something he’s good at.
100

16h
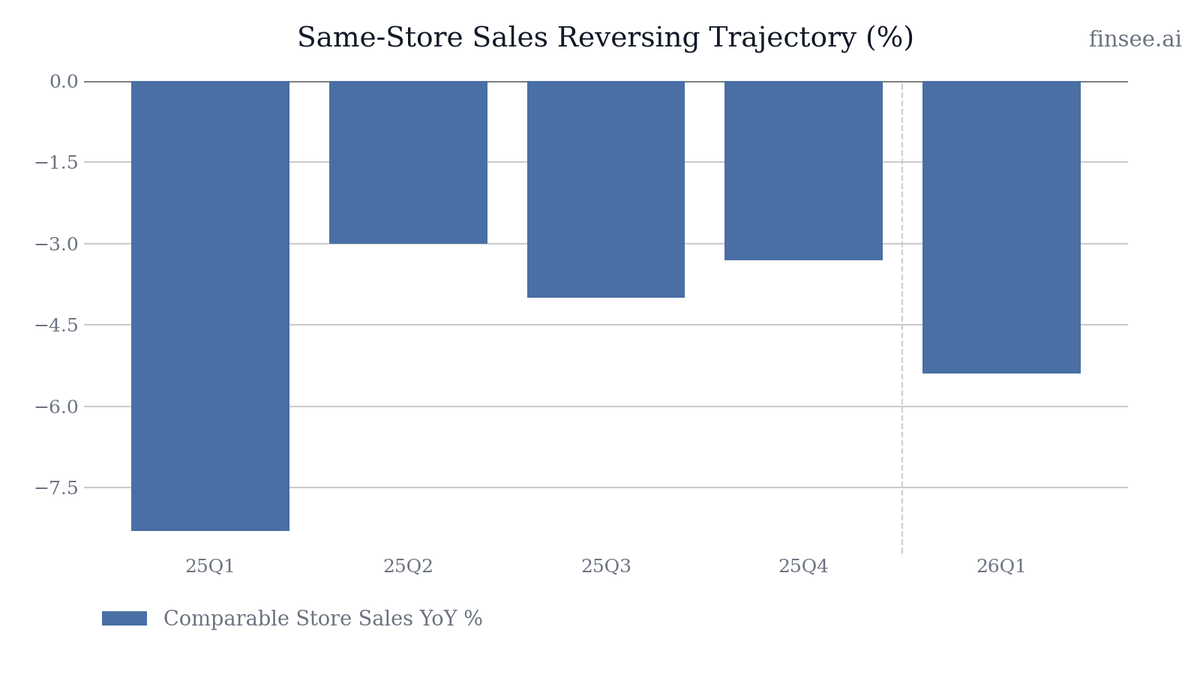
$PLAY Q1 2026 earnings: F&B Success Collides with Entertainment Weakness
Dave & Buster’s 'back-to-basics' turnaround plan is showing highly polarized results. While the Food & Beverage segment is successfully pulling its weight with a 6.4% YoY revenue increase, the core Entertainment business is bleeding, down 5.8% YoY. This divergence caused overall comparable store sales to drop 5.4%, decelerating from the -3.3% trend in Q4 2025 and directly contradicting management's claims of strong 'momentum'. Furthermore, negative operating leverage crushed net income, which fell 73% to $5.7 million. The single brightest spot is capital discipline: Adjusted Free Cash Flow turned positive to $25.3 million, reversing a steep cash burn from a year ago.
Full article with charts - link in bio
🐂 𝐁𝐮𝐥𝐥 𝐂𝐚𝐬𝐞
• 𝐂𝐚𝐬𝐡 𝐅𝐥𝐨𝐰 𝐓𝐮𝐫𝐧𝐢𝐧𝐠 𝐏𝐨𝐬𝐢𝐭𝐢𝐯𝐞 — The bleeding has stopped on the cash front. Adjusted Free Cash Flow swung from negative $58.8M in 25Q1 to positive $25.3M this quarter. Management is reiterating guidance of >$100M FCF for the year.
• 𝐅&𝐁 𝐒𝐭𝐫𝐚𝐭𝐞𝐠𝐲 𝐖𝐨𝐫𝐤𝐢𝐧𝐠 — Food and Beverage revenue increased 6.4% to $214.1M, pushing its share of total revenue up 300 basis points to 38.3%. Menu and value execution are gaining traction.
🐻 𝐁𝐞𝐚𝐫 𝐂𝐚𝐬𝐞
• 𝐂𝐨𝐫𝐞 𝐀𝐦𝐮𝐬𝐞𝐦𝐞𝐧𝐭 𝐢𝐬 𝐅𝐚𝐢𝐥𝐢𝐧𝐠 — Entertainment revenue fell from $366.6M to $345.1M. If the arcade doesn't draw foot traffic, the restaurant cannot sustain the entire business long-term.
• 𝐏𝐫𝐨𝐟𝐢𝐭𝐚𝐛𝐢𝐥𝐢𝐭𝐲 𝐒𝐪𝐮𝐞𝐞𝐳𝐞 — Despite roughly flat total revenue (-1.5%), Net Income collapsed 73% and Adjusted EBITDA margin contracted 200 bps. High fixed operating and payroll costs are severely punishing the bottom line in a negative comp environment.
⚖️ 𝐕𝐞𝐫𝐝𝐢𝐜𝐭: 🔴
Bearish. Management claims 'the right momentum,' but the data shows a 5.4% comp decline and collapsing net income. FCF improvements are driven by capital expenditure cuts, not operational leverage.
𝐊𝐞𝐲 𝐓𝐡𝐞𝐦𝐞𝐬
🔴 𝐍𝐚𝐫𝐫𝐚𝐭𝐢𝐯𝐞 𝐂𝐨𝐧𝐭𝐫𝐚𝐝𝐢𝐜𝐭𝐬 𝐒𝐒𝐒 𝐑𝐞𝐚𝐥𝐢𝐭𝐲 [NEW]
CEO Tarun Lal stated the strategy has the 'right momentum', yet the headline numbers clearly tell a different story. Same-store sales fell 5.4% YoY. This is a noticeable deceleration from 25Q4 (-3.3%) and 25Q2 (-3.0%). The recovery trajectory is reversing, exposing a severe traffic problem that marketing and remodels have not yet fixed.
🔴🔴 𝐄𝐧𝐭𝐞𝐫𝐭𝐚𝐢𝐧𝐦𝐞𝐧𝐭 𝐒𝐞𝐠𝐦𝐞𝐧𝐭 𝐖𝐞𝐚𝐤𝐧𝐞𝐬𝐬 [NEW]
Dave & Buster's primary hook—its games—is losing ground. Entertainment revenue dropped 5.8% YoY to $345.1M, shrinking from 64.6% of total revenue to 61.7%. Management previously acknowledged underinvestment in amusements as a 'clear executional failure,' but this quarter proves the heavily promoted new game pipeline has not yet stimulated a traffic turnaround.
🟢 𝐅𝐨𝐨𝐝 & 𝐁𝐞𝐯𝐞𝐫𝐚𝐠𝐞 𝐑𝐞𝐯𝐢𝐯𝐚𝐥 [NEW]
F&B is the sole growth engine right now, accelerating 6.4% YoY to $214.1M. The successful reintroduction of popular entrees and the execution of the Eat & Play combo are driving higher attachment rates. The food business is structurally lower margin than games, but it is currently preventing a catastrophic top-line collapse.
🟢 𝐃𝐢𝐬𝐜𝐢𝐩𝐥𝐢𝐧𝐞𝐝 𝐂𝐚𝐩𝐢𝐭𝐚𝐥 𝐒𝐨𝐮𝐫𝐜𝐢𝐧𝐠 & 𝐑𝐞𝐦𝐨𝐝𝐞𝐥𝐬 [NEW]
The company has throttled back wasteful capital expenditures. Adjusted Free Cash Flow reversed entirely, jumping from -$58.8M to $25.3M. Concurrently, the refreshed remodel program is progressing with 6 locations completed this year. By spending less but focusing on higher ROI visual updates, management is prioritizing financial stability.
⚪ 𝐈𝐧𝐭𝐞𝐫𝐧𝐚𝐭𝐢𝐨𝐧𝐚𝐥 𝐅𝐫𝐚𝐧𝐜𝐡𝐢𝐬𝐞 𝐄𝐱𝐩𝐚𝐧𝐬𝐢𝐨𝐧
A capital-light growth vector is accelerating. Dave & Buster's opened its fifth and sixth international franchise locations in May and June, with at least one more expected this year. This represents pure, high-margin royalty flow without the heavy CapEx burden of domestic company-owned builds.
🔴 𝐎𝐩𝐞𝐫𝐚𝐭𝐢𝐧𝐠 𝐋𝐞𝐯𝐞𝐫𝐚𝐠𝐞 𝐢𝐬 𝐁𝐫𝐞𝐚𝐤𝐢𝐧𝐠 [NEW]
A 1.5% drop in total revenue resulted in a 73% drop in Net Income ($21.7M down to $5.7M). Operating payroll and benefits rose to 25.1% of revenue (up 130 bps), and depreciation expenses jumped 12%. When foot traffic drops, Dave & Buster's immense fixed-cost footprint mercilessly destroys operating margins.
𝐎𝐭𝐡𝐞𝐫 𝐊𝐏𝐈𝐬
𝐀𝐝𝐣𝐮𝐬𝐭𝐞𝐝 𝐄𝐁𝐈𝐓𝐃𝐀: $123.2 million
Decelerating. Down 9.4% YoY from $136.1M in 25Q1. Margin compressed to 22.0% from 24.0% due to deleverage on labor and a mix shift toward the lower-margin F&B segment.
𝐀𝐯𝐚𝐢𝐥𝐚𝐛𝐥𝐞 𝐋𝐢𝐪𝐮𝐢𝐝𝐢𝐭𝐲: $499.1 million
Stable. Up from $482.9M in 25Q4. Supported by the strong $25.3M of adjusted free cash flow generated in the quarter, ensuring the company has ample runway to fund its remodel program and weather near-term traffic headwinds.
𝐆𝐮𝐢𝐝𝐚𝐧𝐜𝐞
𝐅𝐘𝟐𝟔 𝐀𝐝𝐣𝐮𝐬𝐭𝐞𝐝 𝐅𝐫𝐞𝐞 𝐂𝐚𝐬𝐡 𝐅𝐥𝐨𝐰: >$100 million
Accelerating relative to prior years. Management reiterated high confidence in generating over $100M in FCF. Reaching this target depends strictly on maintaining the current severe CapEx discipline.
𝐅𝐘𝟐𝟔 𝐂𝐨𝐦𝐩𝐚𝐫𝐚𝐛𝐥𝐞 𝐒𝐭𝐨𝐫𝐞 𝐒𝐚𝐥𝐞𝐬 (𝐑𝐞𝐬𝐭 𝐨𝐟 𝐘𝐞𝐚𝐫): Positive
Reversing. Despite printing a -5.4% in Q1, CEO Tarun Lal explicitly guided to positive comps for the remainder of the year. This is a massive promise that requires immediate traffic inflection driven by new game IP and summer promotions.
𝐊𝐞𝐲 𝐐𝐮𝐞𝐬𝐭𝐢𝐨𝐧𝐬
𝐀𝐦𝐮𝐬𝐞𝐦𝐞𝐧𝐭 𝐓𝐫𝐚𝐟𝐟𝐢𝐜 𝐃𝐢𝐬𝐜𝐨𝐧𝐧𝐞𝐜𝐭
F&B is growing over 6%, yet Entertainment is shrinking by nearly 6%. Are guests walking in just to eat and completely bypassing the Midway, or are game pricing changes dampening spend per head?
𝐁𝐫𝐢𝐝𝐠𝐞 𝐭𝐨 𝐏𝐨𝐬𝐢𝐭𝐢𝐯𝐞 𝐂𝐨𝐦𝐩𝐬
With Q1 comps at -5.4%, the guidance implies a sharp V-shaped recovery to positive comps for the rest of the year. What specific leading indicators in late May/June give you the confidence to make this aggressive projection?
𝐎𝐩𝐞𝐫𝐚𝐭𝐢𝐧𝐠 𝐋𝐞𝐯𝐞𝐫𝐚𝐠𝐞 𝐅𝐥𝐨𝐨𝐫
Net income collapsed on a minimal 1.5% revenue decline. Where is the floor on store-level margins if comps remain negative, and can pricing alone offset the rising payroll burden?
771

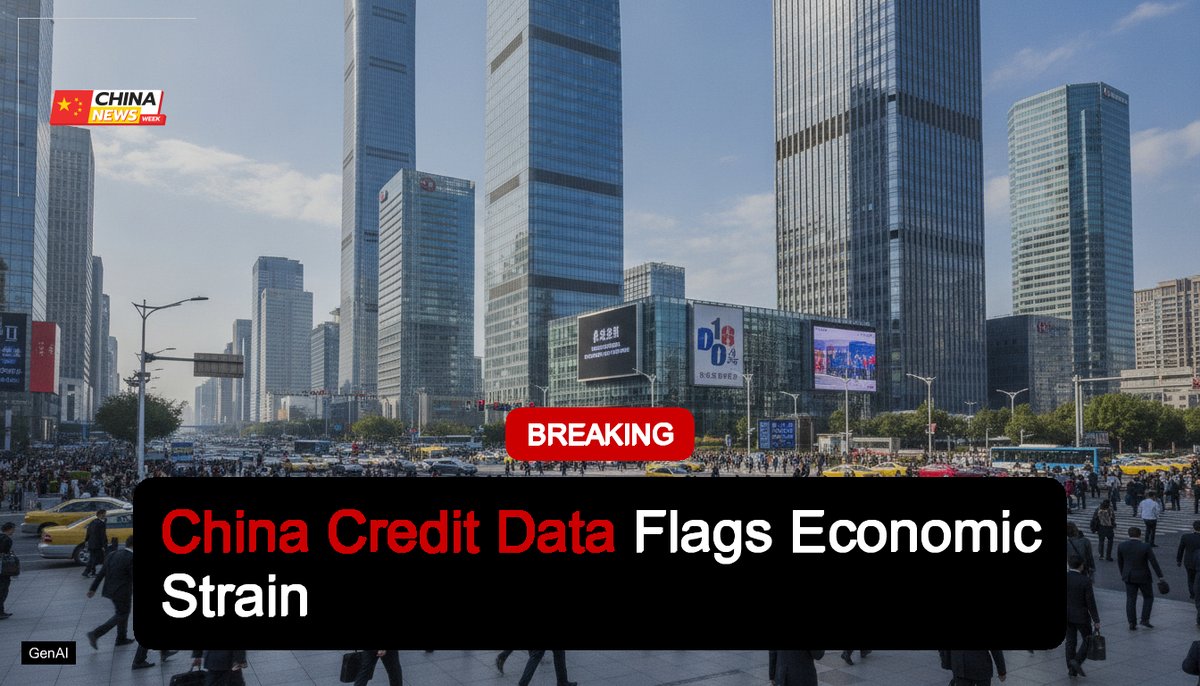
China Credit Data Flags Economic Strain
China credit figures show weak demand as households deleverage and investment stays sluggish, testing Beijings efforts to lift growth.
Deleveraging or stimulus next
chinanewsweek.com/china-econ…
#chinanews #china
6

You can’t go long without someone going short.
It’s a zero sum game.
The person you take from is exposed opposite to you.
There’s an Auto deleverage system that matches exposure to cancel it out in turbulent times.
The system cannot go insolvent it’s a core value prop.
20

Jun 15
Your perp loss is someone's win. Spot margin has no other side.
Before you open any leveraged trade, ask one question: who's on the other side?
On most venues the answer is uncomfortable. A counterparty, a market maker, or the protocol's own deleveraging engine sits opposite your position — and does better when you do worse. We built Lavarage so that's not the deal you're taking.
No counterparty, no ADL.
On Lavarage you borrow from on-chain lenders. A lender earns one thing — interest — and wants one thing: the loan repaid.
They're not the other side of your trade, and no auto-deleveraging engine can close your winner to balance someone else's book. It's borrowing, not a bet against the house.
You hold the real token.
A perp gives you a synthetic position. Lavarage gives you the real token, on-chain, in your own isolated account — borrowed against, but yours.
Each position is its own account: no shared pool, no insurance fund socializing your losses onto other traders.
Leverage set by people, not a casino dial.
Leverage here isn't a slider tuned to liquidate you. Lenders set the terms on each market — and because they're pricing to get repaid, the incentives skew toward sane leverage, not a dial built to wick you out on the first red candle.
Liquidation is real. Here's how you stay ahead of it.
Let's be straight: liquidation is real, and more leverage brings it closer. No leverage product changes that.
What we control is the tools to manage it before the candle, not after — repay to cut your borrow, trim risk, or split a position, all live today. Auto stop-loss is live for Privy wallets; auto-deleverage is on the way.
And tools only help if they fire: the V2 rebuild took transaction success from ~60% to 95% , so a stop or repay lands when you need it.
Built for the long term.
A blown account doesn't come back to trade. We're building Lavarage for traders who last: no one across the table, the real asset in your hands, sane leverage, and the tools to stay in the game.
The market can still liquidate you. Our model just isn't built to profit when it does.
Full write-up 👇
bit.ly/medium-your-perp-loss
2
1
11
745

Jun 15
🟡 Craftsman Automation Ltd (CRAFTSMAN)
💰 EGM Approves Fundraising Up to Rs. 2000 Crores
Craftsman Automation's EGM approved an enabling resolution to raise up to Rs. 2000 Crores, a move that comes as the company carries an elevated net debt of ~Rs. 3,120 Cr and a debt-equity ratio of 1.02x following an aggressive capex and acquisition cycle.
⚡ The resolution, passed with 97.71% promoter support, grants flexibility to tap equity or debt markets to deleverage and fund future growth.
🚀 The approval provides strategic capital allocation flexibility while supporting future expansion and balance sheet optimization.
📊 Fundraise / MCap: 9.6%
💰 MCap: Rs. 20,735 Cr
📈 EV/EBITDA: 18.60
🎯 ROCE: 14.15%

1
327

Jun 15
6/10 — Advanta Seeds IPO
UPL has filed for Advanta Seeds IPO — its high growth seeds business.
This is a strategic move to unlock hidden value and further deleverage the balance sheet.
If executed well, this could be a significant re-rating trigger for the stock.
1
1
8

Only thing I’m not getting is the event. Need to deleverage market etc. offer solution/flip to new system
But that seems weird going into midterms.
Which makes me think we aren’t really having midterms.
🤷
1
46


Jun 15
Literally makers are manipulating US markets,, it’s high time for global markets to deleverage from US markets direction..
2
14

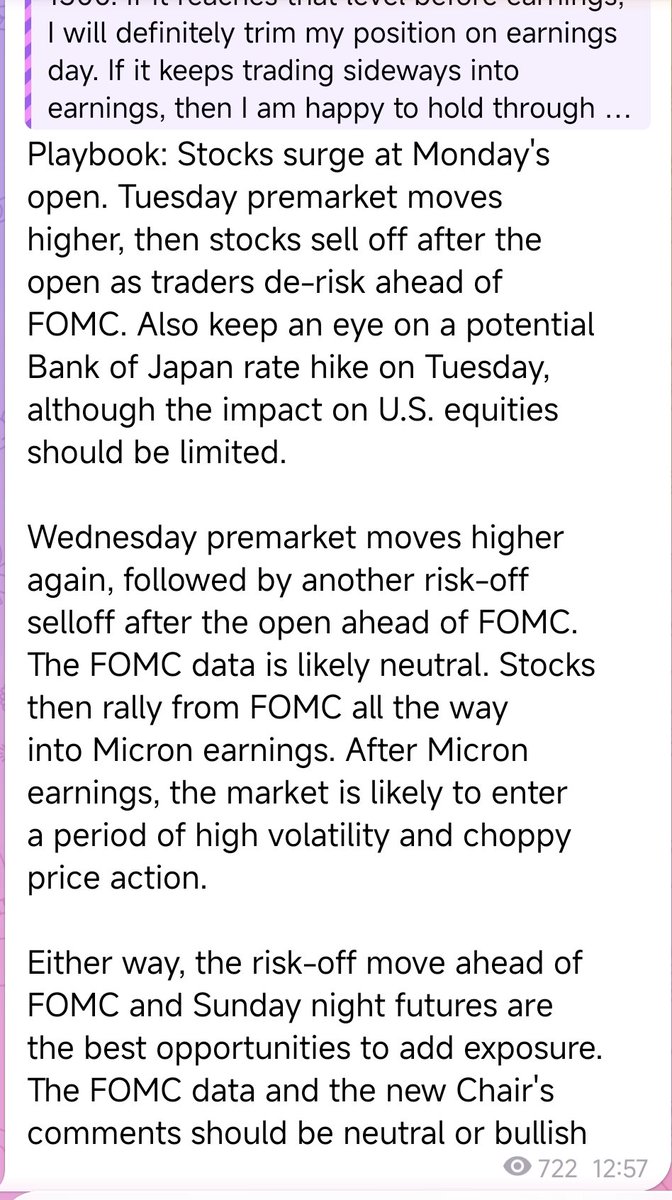
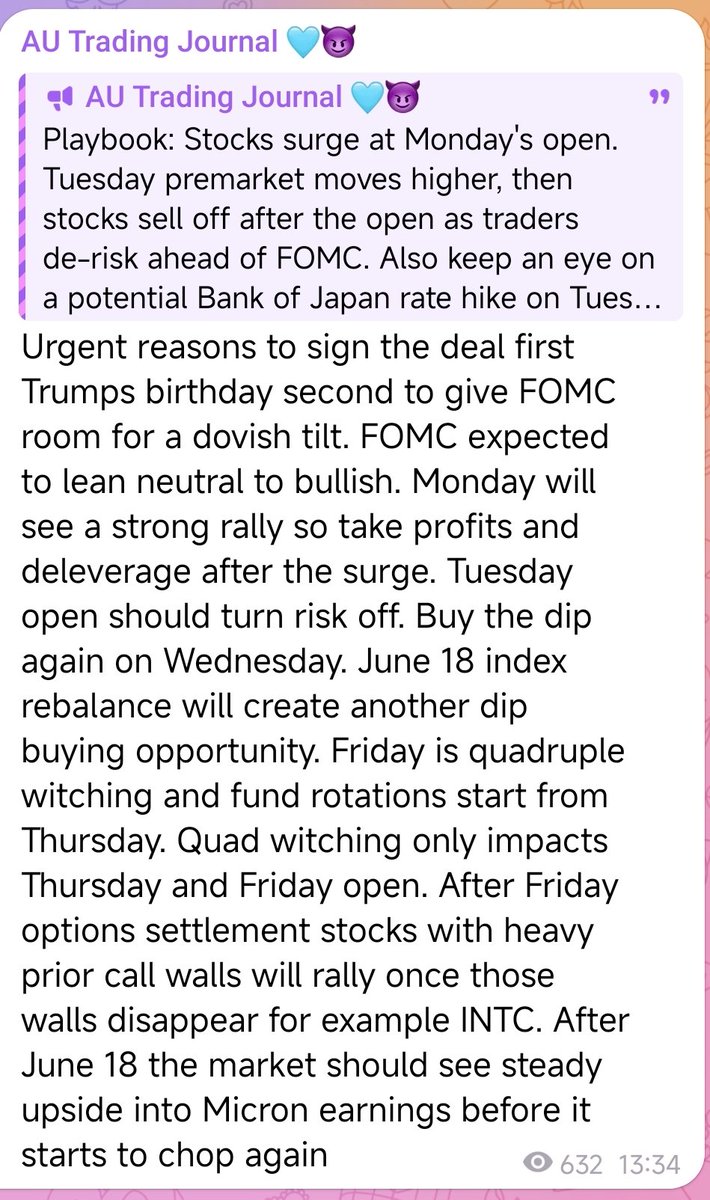
Playbook: Stocks surge at Monday's open. Tuesday premarket moves higher, then stocks sell off after the open as traders de-risk ahead of FOMC. Also keep an eye on a potential Bank of Japan rate hike on Tuesday, although the impact on U.S. equities should be limited.
Wednesday premarket moves higher again, followed by another risk-off selloff after the open ahead of FOMC. The FOMC data is likely neutral. Stocks then rally from FOMC all the way into Micron earnings. After Micron earnings, the market is likely to enter a period of high volatility and choppy price action.
Either way, the risk-off move ahead of FOMC and Sunday night futures are the best opportunities to add exposure. The FOMC data and the new Chair's comments should be neutral or bullish
Urgent reasons to sign the deal first Trumps birthday second to give FOMC room for a dovish tilt. FOMC expected to lean neutral to bullish. Monday will see a strong rally so take profits and deleverage after the surge. Tuesday open should turn risk off. Buy the dip again on Wednesday. June 18 index rebalance will create another dip buying opportunity. Friday is quadruple witching and fund rotations start from Thursday. Quad witching only impacts Thursday and Friday open. After Friday options settlement stocks with heavy prior call walls will rally once those walls disappear for example INTC. After June 18 the market should see steady upside into Micron earnings before it starts to chop again
5
1
21
2,695

Jun 14
135M $USDC just moved off Aave to an unknown wallet. flagged by my engine 8 minutes ago.
that is not a small deleverage. that is someone pulling serious dry powder out of a lending protocol and pointing it somewhere.
last time i tracked a move this size off Aave, it preceded a major spot entry within 48 hours. correlation, not causation. but 135M does not move without a reason.
wallet is untagged. watching where it goes next.
184