


May 14
DOCSIS 4.0 takes an ecosystem. A closer look at how @MediacomCable, AOI, and Digicomm International are aligning smart amplifier technology, DAA architecture, and distribution logistics to bring gigabit-class broadband to nearly 1M homes.
See more: aoinc.co/43dei6g $AAOI
5
68
5,202

$AAOI 重點整理(2026/5/13 Needham 會議)
1. 整體投資論點轉變
- 需求已非問題:需求遠超過產能,至少到 2027 年中仍供不應求。
- 核心風險轉為執行力:能否快速將陡峭產能擴張轉化為合格、高良率、具獲利能力的量產。
- Q1 2026 數據印證轉型:總營收 1.511 億美元(YoY 51%),資料中心營收 8,140 萬美元(YoY 154%),占比已達 53.9%。
2. 營收展望與挑戰
- Q2 指引:1.80–1.98 億美元(中位數 1.89 億)。
- 全年指引約 11 億美元 → H2 需貢獻約 7.6 億美元(平均每季約 3.8 億,約為 Q2 的 2 倍)。
- Q2 為關鍵轉型季:必須證明製造準備度,否則 H2 大幅成長將有執行風險。
3. 需求與客戶動能(正面)
- 已取得兩家 800G 客戶資格認證,第二家客戶已下單 1.6T(>2 億美元初始訂單,Q3 晚期開始出貨)。
- 800G 被定位為「主力戰馬」,不會被 1.6T 快速取代。
- 1.6T 與 800G 客戶群重疊、產線共通(僅最終測試不同),大幅降低轉換風險。
- 產業背景:TrendForce 預估 2026 年 AI 光纖市場成長 >57%。
4. 產能擴張計畫
- Q1 結束時:800G 月產能 ≈10 萬台。
- 2026 年底目標:800G 1.6T 月產能 >50 萬台。
- 時間表:
‧台灣新產能:未來幾個月全面投產(支援 Q3)。
‧德州新廠(21.1 萬平方英尺):8–9 月投產(貢獻 Q4)。
‧另兩棟廠房(38.8 萬平方英尺):2027 年擴張。
- 優勢:德州為「複製貼上」台灣自動化流程,非全新製程,風險較低。
5. 雷射垂直整合(最大優勢)
- 所有雷射自製(Sugar Land 廠),掌握關鍵瓶頸。
- 磷化銦基板目前以 4 吋為主,6 吋轉換預計 2027 年底逐步進行。
- 供應能見度約 1 年,但仍受地緣政治與設備交期影響。
6. 毛利率展望
- Q1 非 GAAP 毛利率 29.2%,Q2 指引 29–30%。
- 目標:2026 年底中 30% 幾,2027 年底 40%。
- 驅動因素:產品組合轉向 800G → 1.6T 產能利用率提升。
- 風險:目前仍在吸收擴產成本(折舊、良率、存貨),需順利進入量產才會顯現改善。
7. 資本密集度與風險
- 每 10 萬台/月產能 ≈ 需投資 1.2 億美元,可帶來年化 4.8–6 億美元營收(紙上 payback 8–9 個月)。
- 但實際現金流會因存貨、應收、設備訂金而落後。
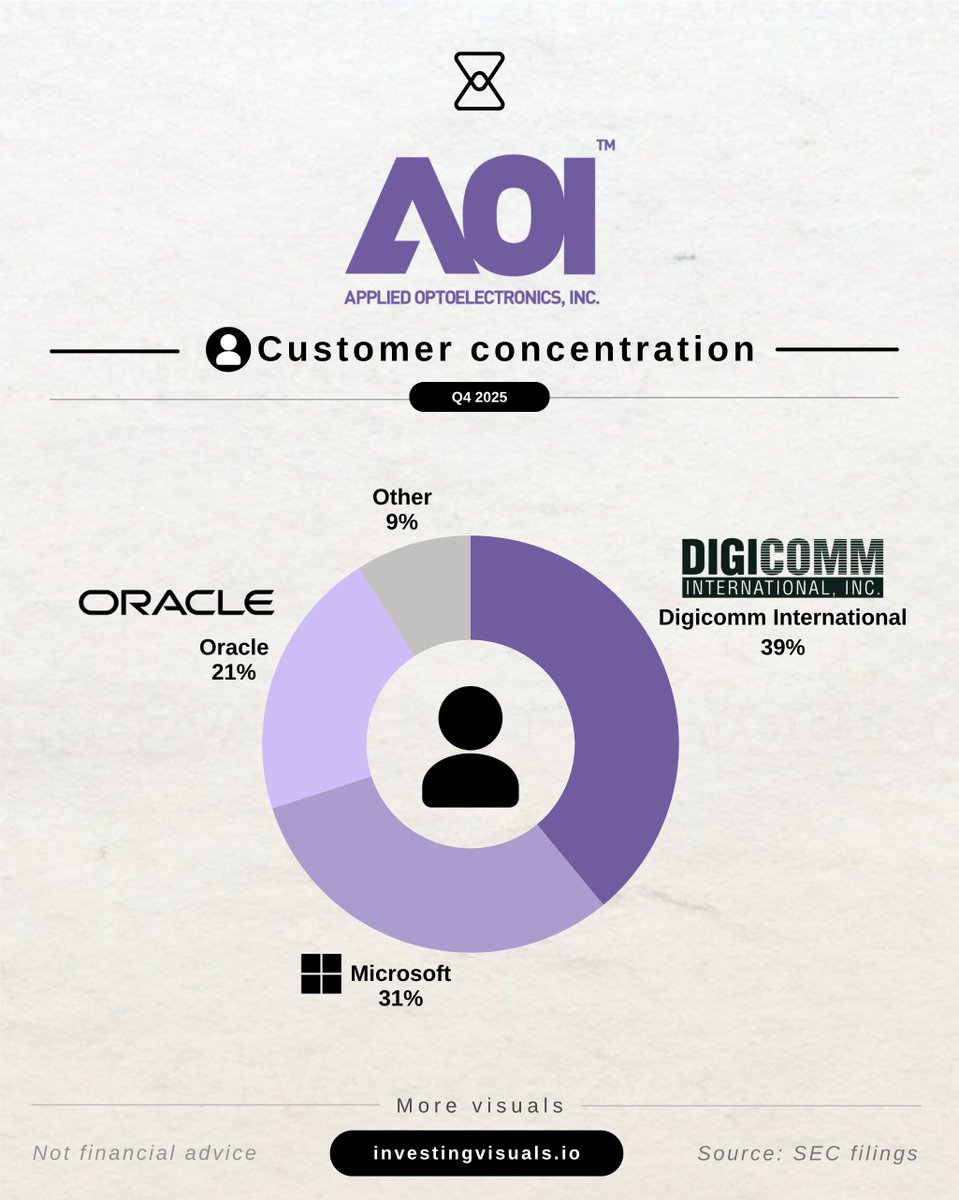
- 客戶集中風險高(前十大客戶 98%,其中Digicomm 占 44%)。
- Amazon 認股權證帶來稀釋(最高 794.5 萬股)。
- 無長期合約承諾,需求主要來自訂單與預測。
May 13

$AAOI cc: @CitronResearch - don't short the optical networking names. I'm long AAOI 1/21/28 calls.
EXECUTIVE OVERVIEW - NEEDHAM CONFERENCE CALL 5/13/26
The Needham transcript materially improves the credibility of the constructive AAOI investment case, but it also narrows the central underwriting question to execution, not demand. Management described demand as exceeding capacity through at least mid-2027, positioned Q2 2026 as a transition quarter before a large H2 2026 ramp, disclosed qualification progress with 2 800G customers, and indicated that the 2nd 800G customer has also placed 1.6T orders expected to begin shipping in late Q3 2026. Official Q1 2026 disclosures corroborate the inflection: revenue was $151.1M, up from $99.9M y/y; data center revenue was $81.4M, 154.0% y/y and 53.9% of total revenue; and CATV revenue was $66.8M, 3.6% y/y and 44.2% of total revenue. The investment debate has therefore moved beyond whether AAOI has exposure to the AI optical cycle; it is now whether AAOI can convert an unusually steep capacity ramp into qualified, shippable, high-yielding, margin-accretive volume quickly enough to justify the current valuation and capital intensity. (Applied Optoelectronics, Inc.)
The near-term setup is powerful but unforgiving. Q2 2026 revenue guidance of $180M-$198M implies a midpoint of $189M, which, combined with Q1 revenue of $151.1M, produces an H1 2026 revenue base of approximately $340.1M. Against management’s raised FY 2026 guide of roughly $1.1B, H2 2026 must contribute approximately $759.9M, or about $380.0M per quarter on average. That implies the H2 quarterly average must be approximately 2.0x the Q2 midpoint. This math is not inherently unrealistic given the customer demand signals and capacity additions described, but it means the 2026 model is highly sensitive to timing slippage in line commissioning, customer qualification, yield learning, final-test availability, laser supply, and working-capital conversion. The Q2 transition framing should therefore be treated as a critical inflection point: it is not merely a normal sequential growth quarter, but the quarter in which manufacturing readiness must be proven before the revenue base steps up by hundreds of millions of dollars in H2. (Applied Optoelectronics, Inc.)
DEMAND SIGNALS AND CUSTOMER MOMENTUM
The demand commentary was unambiguously positive. Management stated that demand is not the constraint, that the company has more demand than it can supply, and that demand is expected to exceed capacity until at least mid-2027, possibly beyond. This is a meaningful statement because the largest risk in historical optical component cycles has often been abrupt demand normalization, customer inventory digestion, or hyperscaler capex digestion. In this case, the near-term bottleneck appears to be supply rather than order availability. That distinction supports a more favorable revenue visibility framework, provided the demand is backed by enforceable purchase orders, customer forecasts, and qualification status rather than non-binding indications alone. The existence of a >$200M initial 1.6T order from a major hyperscale customer, with shipments expected to begin in early Q3 2026 and complete in Q4 2026, provides important evidence that at least part of the 1.6T ramp is order-backed rather than purely aspirational. (Applied Optoelectronics, Inc.)
The 800G trajectory is the most important near-term product variable. Management disclosed first 800G shipments in Q1, completion of 800G qualification with 1 customer and another customer, and expected near-term shipments to the 2nd customer. The transcript also pushes back against the view that 1.6T will rapidly cannibalize 800G, with management characterizing 800G as a “workhorse” that customers expect to remain important for a prolonged period. This is significant because a premature investor fixation on 1.6T could understate the magnitude and duration of 800G demand. The 800G cycle should be analyzed as a substantial standalone revenue ramp, not merely as a bridge technology. A slower 1.6T transition would benefit AAOI if 800G qualification and yields are already improving, because it would allow the company to amortize learning curves, line investments, and customer qualification costs over a larger base.
The 1.6T setup appears incrementally de-risked by product architecture and customer overlap. Management indicated that the 1.6T customer base is expected to be largely similar to the 800G customer base, reducing the customer-specific qualification burden. The company also designed 800G and 1.6T products to run on substantially the same manufacturing lines, with the principal distinction being final testing: 800G operates at 100G per lane, while 1.6T operates at 200G per lane. This manufacturing commonality is strategically important because it reduces stranded-capacity risk, smooths technology migration, and improves the probability that incremental capex can serve multiple generations of product demand. However, final test is not a trivial difference at 200G per lane; adequate test capacity, thermal control, signal-integrity validation, and customer reliability data will remain key gating factors for 1.6T conversion.
Industry conditions also support management’s demand narrative. TrendForce estimates the global AI optical transceiver market will grow from $16.5B in 2025 to $26B in 2026, >57% growth, with sharply rising demand for 800G and above. The same industry commentary highlights tightness in EML and CW lasers, optical alignment complexity, power consumption, and thermal constraints as key supply-chain issues. AAOI’s internal laser capability and automated manufacturing strategy are therefore directionally aligned with the most important bottlenecks in the broader optical ecosystem. The strategic value of domestic, vertically integrated optical capacity rises materially in an environment where hyperscalers require volume, redundancy, and geopolitical supply-chain diversification. (TrendForce)
CAPACITY RAMP AND MANUFACTURING CREDIBILITY
The capacity ramp is the core determinant of whether the FY 2026 and FY 2027 investment case works. Official Q1 commentary stated that AAOI exited Q1 with nearly 100,000 units per month of 800G transceiver production capacity and that additional Houston-area capacity expansion was underway. Separately, the company’s 1.6T order announcement stated that capacity additions in Taiwan and Sugar Land are expected to drive combined 800G and 1.6T capacity to >500,000 units per month by the end of 2026. The Needham transcript adds more detail: Taiwan capacity is expected to be fully commissioned over the next couple months, enabling the Q3 revenue ramp; the 211,000 square foot Texas facility leased across the street from the existing Sugar Land facility is expected to come online in August or September 2026 and contribute to Q4 revenue; and 2 additional Houston-area buildings totaling 388,000 square feet have been purchased for the 2027 expansion. (Applied Optoelectronics, Inc.)
The most positive manufacturing point is that AAOI is not describing a greenfield process invention. Management emphasized that the Texas expansion is effectively a copy-and-paste of automated production processes already deployed in Taiwan, with a large internal engineering and technician base that has designed, installed, and refined much of the production equipment. This reduces the risk of process novelty and suggests the expansion challenge is more about execution tempo, equipment installation, yield stabilization, and factory transfer than fundamental manufacturability. The strategic rationale is also coherent: automation is the enabling condition for US production to be economically viable in a labor-intensive optical assembly market, and if the company can produce at competitive costs in Texas, it becomes a differentiated Western supplier in a market historically dominated by Asian manufacturing scale.
The negative manufacturing point is that the ramp remains aggressive. Management’s own commentary implies that every major 2026 target is capacity-gated. Rapid movement from roughly 100,000 units per month exiting Q1 to >500,000 units per month by year-end requires tight coordination across optical assembly, laser chip capacity, PIC supply, clean-room buildout, final test, labor training, customer audits, and component procurement. Even modest line delays can have an outsized P&L impact because the H2 revenue requirement is so large. The August/September timing for the first incremental Texas facility also leaves limited margin for construction delays, tool installation issues, qualification bottlenecks, or yield excursions if Q4 revenue contribution is expected. The ramp can be credible and still carry high variance.
LASER SUPPLY, INDIUM PHOSPHIDE, AND VERTICAL INTEGRATION
AAOI’s laser position is arguably the most strategically important part of the transcript. Management framed the company as fundamentally a laser company, with origins in advanced semiconductor laser processes and materials, and stated that all lasers used in AAOI transceivers are manufactured in-house. The company’s 10-Q similarly describes AAOI as a vertically integrated provider whose manufacturing process begins with lasers and states that laser chips are manufactured in Sugar Land using MBE and MOCVD tools. This matters because laser availability is one of the industry’s most important constraints, especially as 800G, 1.6T, and future CPO architectures require higher volumes and, in some cases, higher power. In-house laser production provides greater control over supply, design iteration, cost, and product yield, while also creating a customer-access advantage: hyperscalers that want access to AAOI laser capacity must effectively procure AAOI transceivers rather than buying the lasers separately. (Applied Optoelectronics, Inc.)
The laser advantage is not absolute. Management acknowledged that laser-capacity expansion requires standard semiconductor processing tools such as MOCVD and coating equipment, and that much of this equipment has long lead times. Orders have already been placed for a large quantity of equipment, with deliveries expected over the next year or so. This suggests that management has been planning the expansion proactively, but it also means the company is exposed to the cadence of semiconductor equipment deliveries, installation, process qualification, and wafer-level yield learning. The distinction between having an existing indium phosphide fab and having sufficient incremental capacity for 800G, 1.6T, and CPO is important. AAOI does not appear to face the same strategic supply dependency as a transceiver assembler relying wholly on external lasers, but it is still exposed to the physical and temporal constraints of scaling compound semiconductor manufacturing.
The indium phosphide substrate discussion was more balanced than purely promotional. Management stated that AAOI is primarily on 4-inch wafers today, with some remaining 3-inch and legacy 2-inch production, and that 6-inch migration will occur only when yield economics justify the transition. The company expects a significant portion of manufacturing to move to 6-inch by the end of 2027, but also acknowledged that 6-inch yields are currently not equivalent for AAOI and may not be equivalent for competitors. This is important because 6-inch migration is not automatically accretive; the cost-per-good-die benefit depends on equivalent or sufficiently comparable yield. The positive factor is that AAOI’s equipment and processes are described as capable of supporting both 4-inch and 6-inch production, reducing binary transition risk. The negative factor is that yield uncertainty remains a real variable, particularly if industry investors assume 6-inch transition economics before the process is proven at scale.
Substrate availability remains a diligence item rather than a fully resolved risk. Management stated that AAOI has line of sight for approximately the next year based on inventory and supplier agreements, and characterized the broader indium phosphide substrate issue as more political than structural, driven by US-China trade frictions rather than an absolute global shortage of substrate capacity. That view is plausible, but it should not be treated as a full mitigation. A political bottleneck can reverse quickly, but it can also worsen quickly. Western supply expansion may take time, and the entire optical industry is simultaneously attempting to scale. The prudent interpretation is that AAOI appears better positioned than many less vertically integrated peers, but it is not immune from substrate, tool, or geopolitical constraints.
GROSS MARGIN TRAJECTORY
The gross margin bridge is credible but still unproven at current scale. Q1 2026 non-GAAP gross margin was 29.2%, while Q2 2026 guidance calls for non-GAAP gross margin of 29%-30%. Management’s target is a mid-30% gross margin by the end of 2026 and 40% by the end of 2027. The stated driver is data-center product mix: legacy 40G and 100G are small but high margin, 400G is the lowest-margin data-center product, 800G should be meaningfully higher than 400G, and 1.6T should be meaningfully higher than 800G. If the revenue mix shifts rapidly from 400G toward 800G and then 1.6T, while manufacturing utilization rises and fixed-cost absorption improves, the margin target has a rational basis. (Applied Optoelectronics, Inc.)
The margin risk is that the current P&L does not yet show the target-state economics. The 10-Q shows Q1 2026 gross margin of 29.1%, down from 30.6% y/y, with higher direct materials, labor, manufacturing costs, inventory reserves, lower production efficiency, and higher depreciation associated with capacity expansion. This indicates that the business is currently absorbing the cost of ramping ahead of revenue. Management’s target therefore depends on a successful transition from capacity-build inefficiency to volume-production leverage. If yields, labor efficiency, line uptime, or customer acceptance lag, gross margin could remain below the mid-30% target even if revenue growth is strong. This distinction is crucial: revenue acceleration alone is insufficient if it is accompanied by under-absorbed depreciation, scrap, rework, expedited freight, or customer-specific engineering costs. (Applied Optoelectronics, Inc.)
Pricing power also appears limited. Management did not claim a meaningful price premium from US production or heritage. Instead, it stated that AAOI is generally within 5%-10% of competitors on pricing and that any small US cost adder is blended with Asian production so customers do not see a dramatic price increase. This suggests the gross margin case is driven more by product mix, vertical integration, yield, and scale than by explicit pricing premiums. That is a reasonable strategy in a hyperscaler procurement environment, but it also means pricing pressure from Chinese or other scaled suppliers could limit margin expansion if industry capacity catches up with demand before AAOI fully ramps. The company’s supply-chain diversity value may help win allocation, but it should not be modeled as durable price premium without further evidence.
CAPITAL INTENSITY AND UNIT ECONOMICS
The capex economics described by management are compelling on paper. Management stated that approximately $120M of investment is required to build 100,000 units per month of 800G or 1.6T transceiver capacity. That same 100,000 units per month is described as capable of producing approximately $40M-$50M of monthly revenue, potentially more if the mix is entirely 1.6T, at mid-30% to close to 40% gross margin. On those assumptions, 100,000 units per month equates to approximately $480M-$600M of annualized revenue capacity and approximately $168M-$240M of annualized gross profit at 35%-40% gross margin, implying a rapid payback relative to the $120M capex base before opex, working capital, taxes, customer warrants, depreciation timing, and ramp inefficiency. Management’s 8-9 month payback framing is therefore mathematically consistent with its stated assumptions.
The critical caveat is that capacity economics are not the same as free-cash-flow economics. Q1 2026 investing cash outflow was $68.1M, including $58.2M of capex, with $26.6M in the US, $9.9M in Taiwan, and $21.7M in China. The 10-Q states that capex will be materially higher in 2026 than in 2025 and that expansion is expected to continue through the end of 2027, particularly to support additional capacity for 800G and 1.6T products. Inventory increased by $25.3M in Q1 due to production ramp and demand planning, including longer component lead times. This means that the company is absorbing not only equipment capex, but also significant working-capital demands. Free cash flow may lag the apparent unit economics materially if receivables, inventory, customer qualification inventory, and tool deposits increase ahead of revenue recognition. (Applied Optoelectronics, Inc.)
The balance sheet is stronger than the historical AAOI profile, but future funding risk has not disappeared. At March 31, 2026, cash and restricted cash totaled approximately $449.4M, while total loans excluding convertible notes were $41.2M and available borrowing capacity was $61.7M. The 10-Q also shows convertible notes of $129.5M. Management has indicated that future expansion may be supported by operating cash flow, additional debt, and potentially equity markets. The relevant risk is not near-term solvency; it is dilution, capital-allocation discipline, and the possibility that capex commitments continue to accelerate ahead of realized customer revenue. Given the magnitude of the planned ramp and the need for laser fab expansion, the equity story remains capital intensive even if operating cash generation improves during H2 2026. (Applied Optoelectronics, Inc.)
CUSTOMER CONCENTRATION AND WARRANT STRUCTURE
Customer concentration is a major structural risk. The 10-Q shows that AAOI’s top 10 customers represented 98% of revenue in Q1 2026, while Digicomm represented $66.7M, or 44.1% of consolidated revenue, primarily tied to CATV. Digicomm also represented 74.5% of accounts receivable at quarter-end, reflecting extended payment terms and a concentration of working-capital exposure. This degree of concentration is not unusual for optical component suppliers selling into hyperscalers and large distribution channels, but it raises the risk that any change in a top customer’s purchasing schedule, qualification status, pricing behavior, or inventory strategy can materially affect revenue and cash conversion. (Applied Optoelectronics, Inc.)
The Amazon warrant structure is also important. In Q1 2026, AAOI issued warrants to purchase up to approximately 7.945M shares at an exercise price of $23.6956 per share, with 1.324M shares immediately exercisable and the remaining 6.621M shares vesting over 10 years based on purchases of up to $4B by Amazon and its affiliates. The company recognized $38.0M of revenue in Q1 2026 under arrangements including the warrant issuance. Economically, this structure can validate customer alignment and improve demand visibility, but it also introduces dilution and affects the true economics of the customer relationship. Revenue tied to warrant-bearing agreements should be evaluated with explicit consideration of equity value transfer, gross margin, and working capital, not just headline sales growth. (Applied Optoelectronics, Inc.)
Another important risk is the absence of long-term customer purchase commitments. The 10-Q states that AAOI does not have long-term purchase commitments, defined as >1 year, with any customers. This is a standard feature of many hyperscaler supply relationships, but it matters because management’s demand visibility is likely based on purchase orders, forecasts, allocation discussions, and customer roadmaps rather than hard contractual minimums extending across the full investment period. The difference between forecast-driven demand and contractually committed demand becomes especially important when a company is investing >$1B of cumulative capital toward nearly 1M monthly transceiver capacity by the end of the next year. (Applied Optoelectronics, Inc.)
2
33
5,452

May 13
$AAOI cc: @CitronResearch - don't short the optical networking names. I'm long AAOI 1/21/28 calls.
EXECUTIVE OVERVIEW - NEEDHAM CONFERENCE CALL 5/13/26
The Needham transcript materially improves the credibility of the constructive AAOI investment case, but it also narrows the central underwriting question to execution, not demand. Management described demand as exceeding capacity through at least mid-2027, positioned Q2 2026 as a transition quarter before a large H2 2026 ramp, disclosed qualification progress with 2 800G customers, and indicated that the 2nd 800G customer has also placed 1.6T orders expected to begin shipping in late Q3 2026. Official Q1 2026 disclosures corroborate the inflection: revenue was $151.1M, up from $99.9M y/y; data center revenue was $81.4M, 154.0% y/y and 53.9% of total revenue; and CATV revenue was $66.8M, 3.6% y/y and 44.2% of total revenue. The investment debate has therefore moved beyond whether AAOI has exposure to the AI optical cycle; it is now whether AAOI can convert an unusually steep capacity ramp into qualified, shippable, high-yielding, margin-accretive volume quickly enough to justify the current valuation and capital intensity. (Applied Optoelectronics, Inc.)
The near-term setup is powerful but unforgiving. Q2 2026 revenue guidance of $180M-$198M implies a midpoint of $189M, which, combined with Q1 revenue of $151.1M, produces an H1 2026 revenue base of approximately $340.1M. Against management’s raised FY 2026 guide of roughly $1.1B, H2 2026 must contribute approximately $759.9M, or about $380.0M per quarter on average. That implies the H2 quarterly average must be approximately 2.0x the Q2 midpoint. This math is not inherently unrealistic given the customer demand signals and capacity additions described, but it means the 2026 model is highly sensitive to timing slippage in line commissioning, customer qualification, yield learning, final-test availability, laser supply, and working-capital conversion. The Q2 transition framing should therefore be treated as a critical inflection point: it is not merely a normal sequential growth quarter, but the quarter in which manufacturing readiness must be proven before the revenue base steps up by hundreds of millions of dollars in H2. (Applied Optoelectronics, Inc.)
DEMAND SIGNALS AND CUSTOMER MOMENTUM
The demand commentary was unambiguously positive. Management stated that demand is not the constraint, that the company has more demand than it can supply, and that demand is expected to exceed capacity until at least mid-2027, possibly beyond. This is a meaningful statement because the largest risk in historical optical component cycles has often been abrupt demand normalization, customer inventory digestion, or hyperscaler capex digestion. In this case, the near-term bottleneck appears to be supply rather than order availability. That distinction supports a more favorable revenue visibility framework, provided the demand is backed by enforceable purchase orders, customer forecasts, and qualification status rather than non-binding indications alone. The existence of a >$200M initial 1.6T order from a major hyperscale customer, with shipments expected to begin in early Q3 2026 and complete in Q4 2026, provides important evidence that at least part of the 1.6T ramp is order-backed rather than purely aspirational. (Applied Optoelectronics, Inc.)
The 800G trajectory is the most important near-term product variable. Management disclosed first 800G shipments in Q1, completion of 800G qualification with 1 customer and another customer, and expected near-term shipments to the 2nd customer. The transcript also pushes back against the view that 1.6T will rapidly cannibalize 800G, with management characterizing 800G as a “workhorse” that customers expect to remain important for a prolonged period. This is significant because a premature investor fixation on 1.6T could understate the magnitude and duration of 800G demand. The 800G cycle should be analyzed as a substantial standalone revenue ramp, not merely as a bridge technology. A slower 1.6T transition would benefit AAOI if 800G qualification and yields are already improving, because it would allow the company to amortize learning curves, line investments, and customer qualification costs over a larger base.
The 1.6T setup appears incrementally de-risked by product architecture and customer overlap. Management indicated that the 1.6T customer base is expected to be largely similar to the 800G customer base, reducing the customer-specific qualification burden. The company also designed 800G and 1.6T products to run on substantially the same manufacturing lines, with the principal distinction being final testing: 800G operates at 100G per lane, while 1.6T operates at 200G per lane. This manufacturing commonality is strategically important because it reduces stranded-capacity risk, smooths technology migration, and improves the probability that incremental capex can serve multiple generations of product demand. However, final test is not a trivial difference at 200G per lane; adequate test capacity, thermal control, signal-integrity validation, and customer reliability data will remain key gating factors for 1.6T conversion.
Industry conditions also support management’s demand narrative. TrendForce estimates the global AI optical transceiver market will grow from $16.5B in 2025 to $26B in 2026, >57% growth, with sharply rising demand for 800G and above. The same industry commentary highlights tightness in EML and CW lasers, optical alignment complexity, power consumption, and thermal constraints as key supply-chain issues. AAOI’s internal laser capability and automated manufacturing strategy are therefore directionally aligned with the most important bottlenecks in the broader optical ecosystem. The strategic value of domestic, vertically integrated optical capacity rises materially in an environment where hyperscalers require volume, redundancy, and geopolitical supply-chain diversification. (TrendForce)
CAPACITY RAMP AND MANUFACTURING CREDIBILITY
The capacity ramp is the core determinant of whether the FY 2026 and FY 2027 investment case works. Official Q1 commentary stated that AAOI exited Q1 with nearly 100,000 units per month of 800G transceiver production capacity and that additional Houston-area capacity expansion was underway. Separately, the company’s 1.6T order announcement stated that capacity additions in Taiwan and Sugar Land are expected to drive combined 800G and 1.6T capacity to >500,000 units per month by the end of 2026. The Needham transcript adds more detail: Taiwan capacity is expected to be fully commissioned over the next couple months, enabling the Q3 revenue ramp; the 211,000 square foot Texas facility leased across the street from the existing Sugar Land facility is expected to come online in August or September 2026 and contribute to Q4 revenue; and 2 additional Houston-area buildings totaling 388,000 square feet have been purchased for the 2027 expansion. (Applied Optoelectronics, Inc.)
The most positive manufacturing point is that AAOI is not describing a greenfield process invention. Management emphasized that the Texas expansion is effectively a copy-and-paste of automated production processes already deployed in Taiwan, with a large internal engineering and technician base that has designed, installed, and refined much of the production equipment. This reduces the risk of process novelty and suggests the expansion challenge is more about execution tempo, equipment installation, yield stabilization, and factory transfer than fundamental manufacturability. The strategic rationale is also coherent: automation is the enabling condition for US production to be economically viable in a labor-intensive optical assembly market, and if the company can produce at competitive costs in Texas, it becomes a differentiated Western supplier in a market historically dominated by Asian manufacturing scale.
The negative manufacturing point is that the ramp remains aggressive. Management’s own commentary implies that every major 2026 target is capacity-gated. Rapid movement from roughly 100,000 units per month exiting Q1 to >500,000 units per month by year-end requires tight coordination across optical assembly, laser chip capacity, PIC supply, clean-room buildout, final test, labor training, customer audits, and component procurement. Even modest line delays can have an outsized P&L impact because the H2 revenue requirement is so large. The August/September timing for the first incremental Texas facility also leaves limited margin for construction delays, tool installation issues, qualification bottlenecks, or yield excursions if Q4 revenue contribution is expected. The ramp can be credible and still carry high variance.
LASER SUPPLY, INDIUM PHOSPHIDE, AND VERTICAL INTEGRATION
AAOI’s laser position is arguably the most strategically important part of the transcript. Management framed the company as fundamentally a laser company, with origins in advanced semiconductor laser processes and materials, and stated that all lasers used in AAOI transceivers are manufactured in-house. The company’s 10-Q similarly describes AAOI as a vertically integrated provider whose manufacturing process begins with lasers and states that laser chips are manufactured in Sugar Land using MBE and MOCVD tools. This matters because laser availability is one of the industry’s most important constraints, especially as 800G, 1.6T, and future CPO architectures require higher volumes and, in some cases, higher power. In-house laser production provides greater control over supply, design iteration, cost, and product yield, while also creating a customer-access advantage: hyperscalers that want access to AAOI laser capacity must effectively procure AAOI transceivers rather than buying the lasers separately. (Applied Optoelectronics, Inc.)
The laser advantage is not absolute. Management acknowledged that laser-capacity expansion requires standard semiconductor processing tools such as MOCVD and coating equipment, and that much of this equipment has long lead times. Orders have already been placed for a large quantity of equipment, with deliveries expected over the next year or so. This suggests that management has been planning the expansion proactively, but it also means the company is exposed to the cadence of semiconductor equipment deliveries, installation, process qualification, and wafer-level yield learning. The distinction between having an existing indium phosphide fab and having sufficient incremental capacity for 800G, 1.6T, and CPO is important. AAOI does not appear to face the same strategic supply dependency as a transceiver assembler relying wholly on external lasers, but it is still exposed to the physical and temporal constraints of scaling compound semiconductor manufacturing.
The indium phosphide substrate discussion was more balanced than purely promotional. Management stated that AAOI is primarily on 4-inch wafers today, with some remaining 3-inch and legacy 2-inch production, and that 6-inch migration will occur only when yield economics justify the transition. The company expects a significant portion of manufacturing to move to 6-inch by the end of 2027, but also acknowledged that 6-inch yields are currently not equivalent for AAOI and may not be equivalent for competitors. This is important because 6-inch migration is not automatically accretive; the cost-per-good-die benefit depends on equivalent or sufficiently comparable yield. The positive factor is that AAOI’s equipment and processes are described as capable of supporting both 4-inch and 6-inch production, reducing binary transition risk. The negative factor is that yield uncertainty remains a real variable, particularly if industry investors assume 6-inch transition economics before the process is proven at scale.
Substrate availability remains a diligence item rather than a fully resolved risk. Management stated that AAOI has line of sight for approximately the next year based on inventory and supplier agreements, and characterized the broader indium phosphide substrate issue as more political than structural, driven by US-China trade frictions rather than an absolute global shortage of substrate capacity. That view is plausible, but it should not be treated as a full mitigation. A political bottleneck can reverse quickly, but it can also worsen quickly. Western supply expansion may take time, and the entire optical industry is simultaneously attempting to scale. The prudent interpretation is that AAOI appears better positioned than many less vertically integrated peers, but it is not immune from substrate, tool, or geopolitical constraints.
GROSS MARGIN TRAJECTORY
The gross margin bridge is credible but still unproven at current scale. Q1 2026 non-GAAP gross margin was 29.2%, while Q2 2026 guidance calls for non-GAAP gross margin of 29%-30%. Management’s target is a mid-30% gross margin by the end of 2026 and 40% by the end of 2027. The stated driver is data-center product mix: legacy 40G and 100G are small but high margin, 400G is the lowest-margin data-center product, 800G should be meaningfully higher than 400G, and 1.6T should be meaningfully higher than 800G. If the revenue mix shifts rapidly from 400G toward 800G and then 1.6T, while manufacturing utilization rises and fixed-cost absorption improves, the margin target has a rational basis. (Applied Optoelectronics, Inc.)
The margin risk is that the current P&L does not yet show the target-state economics. The 10-Q shows Q1 2026 gross margin of 29.1%, down from 30.6% y/y, with higher direct materials, labor, manufacturing costs, inventory reserves, lower production efficiency, and higher depreciation associated with capacity expansion. This indicates that the business is currently absorbing the cost of ramping ahead of revenue. Management’s target therefore depends on a successful transition from capacity-build inefficiency to volume-production leverage. If yields, labor efficiency, line uptime, or customer acceptance lag, gross margin could remain below the mid-30% target even if revenue growth is strong. This distinction is crucial: revenue acceleration alone is insufficient if it is accompanied by under-absorbed depreciation, scrap, rework, expedited freight, or customer-specific engineering costs. (Applied Optoelectronics, Inc.)
Pricing power also appears limited. Management did not claim a meaningful price premium from US production or heritage. Instead, it stated that AAOI is generally within 5%-10% of competitors on pricing and that any small US cost adder is blended with Asian production so customers do not see a dramatic price increase. This suggests the gross margin case is driven more by product mix, vertical integration, yield, and scale than by explicit pricing premiums. That is a reasonable strategy in a hyperscaler procurement environment, but it also means pricing pressure from Chinese or other scaled suppliers could limit margin expansion if industry capacity catches up with demand before AAOI fully ramps. The company’s supply-chain diversity value may help win allocation, but it should not be modeled as durable price premium without further evidence.
CAPITAL INTENSITY AND UNIT ECONOMICS
The capex economics described by management are compelling on paper. Management stated that approximately $120M of investment is required to build 100,000 units per month of 800G or 1.6T transceiver capacity. That same 100,000 units per month is described as capable of producing approximately $40M-$50M of monthly revenue, potentially more if the mix is entirely 1.6T, at mid-30% to close to 40% gross margin. On those assumptions, 100,000 units per month equates to approximately $480M-$600M of annualized revenue capacity and approximately $168M-$240M of annualized gross profit at 35%-40% gross margin, implying a rapid payback relative to the $120M capex base before opex, working capital, taxes, customer warrants, depreciation timing, and ramp inefficiency. Management’s 8-9 month payback framing is therefore mathematically consistent with its stated assumptions.
The critical caveat is that capacity economics are not the same as free-cash-flow economics. Q1 2026 investing cash outflow was $68.1M, including $58.2M of capex, with $26.6M in the US, $9.9M in Taiwan, and $21.7M in China. The 10-Q states that capex will be materially higher in 2026 than in 2025 and that expansion is expected to continue through the end of 2027, particularly to support additional capacity for 800G and 1.6T products. Inventory increased by $25.3M in Q1 due to production ramp and demand planning, including longer component lead times. This means that the company is absorbing not only equipment capex, but also significant working-capital demands. Free cash flow may lag the apparent unit economics materially if receivables, inventory, customer qualification inventory, and tool deposits increase ahead of revenue recognition. (Applied Optoelectronics, Inc.)
The balance sheet is stronger than the historical AAOI profile, but future funding risk has not disappeared. At March 31, 2026, cash and restricted cash totaled approximately $449.4M, while total loans excluding convertible notes were $41.2M and available borrowing capacity was $61.7M. The 10-Q also shows convertible notes of $129.5M. Management has indicated that future expansion may be supported by operating cash flow, additional debt, and potentially equity markets. The relevant risk is not near-term solvency; it is dilution, capital-allocation discipline, and the possibility that capex commitments continue to accelerate ahead of realized customer revenue. Given the magnitude of the planned ramp and the need for laser fab expansion, the equity story remains capital intensive even if operating cash generation improves during H2 2026. (Applied Optoelectronics, Inc.)
CUSTOMER CONCENTRATION AND WARRANT STRUCTURE
Customer concentration is a major structural risk. The 10-Q shows that AAOI’s top 10 customers represented 98% of revenue in Q1 2026, while Digicomm represented $66.7M, or 44.1% of consolidated revenue, primarily tied to CATV. Digicomm also represented 74.5% of accounts receivable at quarter-end, reflecting extended payment terms and a concentration of working-capital exposure. This degree of concentration is not unusual for optical component suppliers selling into hyperscalers and large distribution channels, but it raises the risk that any change in a top customer’s purchasing schedule, qualification status, pricing behavior, or inventory strategy can materially affect revenue and cash conversion. (Applied Optoelectronics, Inc.)
The Amazon warrant structure is also important. In Q1 2026, AAOI issued warrants to purchase up to approximately 7.945M shares at an exercise price of $23.6956 per share, with 1.324M shares immediately exercisable and the remaining 6.621M shares vesting over 10 years based on purchases of up to $4B by Amazon and its affiliates. The company recognized $38.0M of revenue in Q1 2026 under arrangements including the warrant issuance. Economically, this structure can validate customer alignment and improve demand visibility, but it also introduces dilution and affects the true economics of the customer relationship. Revenue tied to warrant-bearing agreements should be evaluated with explicit consideration of equity value transfer, gross margin, and working capital, not just headline sales growth. (Applied Optoelectronics, Inc.)
Another important risk is the absence of long-term customer purchase commitments. The 10-Q states that AAOI does not have long-term purchase commitments, defined as >1 year, with any customers. This is a standard feature of many hyperscaler supply relationships, but it matters because management’s demand visibility is likely based on purchase orders, forecasts, allocation discussions, and customer roadmaps rather than hard contractual minimums extending across the full investment period. The difference between forecast-driven demand and contractually committed demand becomes especially important when a company is investing >$1B of cumulative capital toward nearly 1M monthly transceiver capacity by the end of the next year. (Applied Optoelectronics, Inc.)
Apr 17
$AAOI is expansionmaxxing. Don’t short the optical networking names.
CC: @CitronResearch
Applied Optoelectronics announced plans to expand its Houston-area footprint through the addition of two adjacent buildings in Pearland, Texas, adding approximately 388,000 square feet of manufacturing capacity. The expansion builds on AOI's existing U.S. operations, which include a 210,000-square-foot manufacturing facility currently under development near its Sugar Land headquarters, where the company operates 135,000 square feet of capacity, as well as a recently leased 154,000-square-foot building at Blue Ridge Commerce Center.
2
2
22
13,069

미디어콤, AOI와 협력하여 DOCSIS 4.0 네트워크 업그레이드 가속화 $AAOI
미국 내 5위 케이블 사업자인 미디어콤(Mediacom)이 광학 및 HFC(광동축혼합망) 네트워킹 제품 선도 기업인 AOI의 '퀀텀(Quantum)' 대역폭 기술을 도입해 차세대 초고속 인터넷망 구축에 속도를 냅니다.
1. 주요 목표 및 계획
목표: 2026년 말까지 100만 가구에 초고속 업로드 및 다운로드 속도 제공.
기술적 기반: DOCSIS 4.0 기술, 분산 액세스 아키텍처(DAA), 광섬유 확장, 그리고 eero 7 기술 기반의 전 집안 Wi-Fi 솔루션 활용.
진행 상황: 이미 아이오와, 일리노이, 미네소타 등 주요 시장에서 배포를 완료했으며, 2026년까지 전체 서비스 지역으로 확대할 예정입니다.
2. AOI의 역할 및 핵심 공급 제품
AOI는 미디어콤의 기존 증폭기 시스템(Gainmaker 및 Motorola)을 업그레이드하는 주요 벤더로 선정되었으며, 다음의 핵심 제품을 공급합니다.
QuantumLink™: 원격 관리 및 모니터링 소프트웨어.
Quantum18™ MB: 1.8GHz 시스템 증폭기.
Quantum18™ BLE: 1.8GHz 라인 익스텐더(선로 연장기).
참고: AOI의 독점 유통 파트너인 Digicomm International이 물류와 재고 공급을 지원하며, 이미 지난 12간 수십만 대의 1.8GHz 증폭기를 북미 운영사들에 공급한 바 있습니다.
3. 기대 효과
성능 향상: 기존 동축 케이블을 활용하면서도 광통신(Fiber)에 맞먹는 기가비트 속도와 성능 구현.
효율성: 네트워크 용량 증대, 신호 품질 개선, 서비스 신뢰도 향상과 동시에 운영 비용 절감.
고객 경험: 가입자들이 전면적인 광케이블 공사를 기다릴 필요 없이, 기존 인프라를 통해 즉각적으로 향상된 인터넷 환경을 경험할 수 있습니다.
2
10
1,314

May 12
📢 𝐉𝐔𝐒𝐓 𝐈𝐍: $AAOI Applied Optoelectronics Partners With Mediacom on DOCSIS 𝟒.𝟎 Upgrade
👉 𝐊𝐞𝐲 𝐇𝐢𝐠𝐡𝐥𝐢𝐠𝐡𝐭𝐬:
➤ Applied Optoelectronics working with 𝐌𝐞𝐝𝐢𝐚𝐜𝐨𝐦 to expand broadband infrastructure.
➤ Mediacom targets upgraded service for 𝟏𝐌 homes by end of 𝟐𝟎𝟐𝟔.
➤ Deployment leverages 𝐃𝐎𝐂𝐒𝐈𝐒 𝟒.𝟎, fiber expansion, and eero 7 Wi-Fi.
➤ AOI named primary vendor for legacy 𝐆𝐚𝐢𝐧𝐦𝐚𝐤𝐞𝐫 and Motorola amplifier systems.
➤ Products include 𝐐𝐮𝐚𝐧𝐭𝐮𝐦𝟏𝟖™ 1.8GHz amplifiers and monitoring software.
➤ Digicomm shipped 𝐡𝐮𝐧𝐝𝐫𝐞𝐝𝐬 𝐨𝐟 𝐭𝐡𝐨𝐮𝐬𝐚𝐧𝐝𝐬 of AOI amplifiers in past year.
➤ Partnership aims to deliver 𝐠𝐢𝐠𝐚𝐛𝐢𝐭 broadband over existing coax networks.
4
24
3,177

Apr 29
2025 was mathematically not normal. In a normal growth year, cash flow follows revenue. For $AAOI , revenue grew 83%, but Operating Cash Flow plummeted 150% to –$174M.
The "Dirt" Factor: They target a $4.5B ARR by mid-2027, but the physical factory they need to build those units had its groundbreaking on February 10, 2026. You cannot reach multi-billion dollar output in 15 months from a dirt site when clean-room commissioning takes 12–18 months minimum. The "targets" are narrative placeholders to keep the share price up while they dump stock.
DSO Escalation: A jump in Days Sales Outstanding from 80 days to 195 days is a clear signal of "Channel Inventory Bloat." Digicomm isn't buying product because customers want it; they are warehousing it because AAOI needs to book the "sales."
2
72
Apr 28
2025 Digicomm revenue concentration: 53.1% 2025 Digicomm A/R concentration: 71.6% Estimated dollar exposure: ~$175M
The key question is not booked revenue. The key question is cash collection.
AAOI’s working-capital stress got worse as the story got bigger:
2023 DSO: ~80.6 days 2024 DSO: ~171 days 2025 DSO: ~195.8 days
That is not what clean cash conversion looks like.
1
2
154

Sunil Gupta, Co-founder, MD & CEO, #Yotta, will take the stage at the @ConnectCOAI – Digicomm Summit 2026 to share insights on strengthening India’s #digital ecosystem.
It will be a take on investments, collaboration, and the road ahead for #India’s digital growth.

6
245

Apr 12
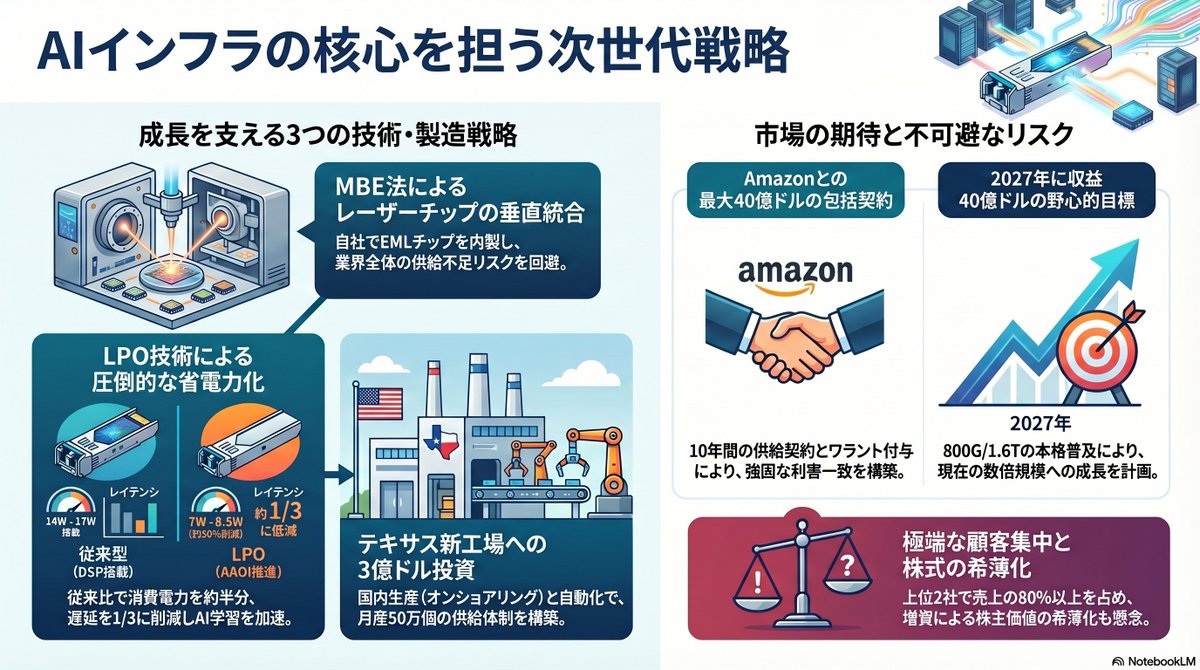
【$AAOI(Applied Optoelectronics)今後の展望 】
800G/1.6T次世代光トランシーバのTier-1プレイヤーへ!🚀
🔥 強みの核心
・垂直統合の最強武器:自社MBEでInPレーザーチップを内製
→ EMLチップ不足の業界ボトルネックを完全回避✅
・LPO:DSP排除で消費電力40-50%削減、レイテンシ1/3に
・CPO/NPOへの布石:OFC 2026で25dBm超高出力ELSFPを発表し、3.2T以降も射程📈
📈 爆発的な受注実績(2026年)
・800G:特定ハイパースケーラー(Microsoft/Oracle推定)から1億2,400万ドル追加受注
・1.6T:2億ドル超の初量産受注(2026 Q3出荷開始)
・Amazon(AWS)と最大40億ドル・10年契約+ワラント(794万株)
→ 発注すればするほどAmazonの含み益も増える完璧な利害一致構造🤝
🏭 製造戦略
・テキサス州シュガーランドに3億ドル投下で新AI専用工場建設中(2026夏稼働)
・台湾・中国既存拠点と合わせ800G/1.6T月産50万個体制へ
・米国オンショアリングで地政学リスク排除&「Trusted Domestic Supplier」獲得🇺🇸
💰 財務・事業ポートフォリオ
CATV(DOCSIS 4.0アップグレード)事業が絶好調
→ 2025年売上2億4,500万ドル(前年3倍)、総売上の53.8%を占め安定キャッシュカウ
2026年目標:売上10億ドル超、非GAAP営業利益1.2億ドル超
2027年野心目標:40億ドル🚀
⚠️ リスク
・顧客集中(Digicomm+Microsoftだけで80%超)
・ATM増資による株式希薄化(最大5億ドル枠)
・製造実行リスク(歩留まり・納期)
総括
AAOIはAI光通信サイクルの構造的勝者になる可能性大!💎
技術・受注・製造・資金の全てが揃った今、
残るはただ一つ(完璧な実行力)🔑
2026年後半の1.6T本格出荷と黒字化が全ての鍵
成功すれば2027年40億ドルは現実味大!
AI投資が続く限り、AAOIはまだまだ目が離せない銘柄👀
Apr 11

2
463


#shujuiworks
Digicomm are still open! feel free to send a dm
canva.com/design/DAHETMjqA9Y…
t. seventeen digital commissions digicomm wts lfb lf enhypen nct cortis maki bini svt
#UntilIFoundGYU
#SNICKERSwithMINGYU

1
2
3
1,532

Mar 24
$AAOI EXECUTIVE OVERVIEW
The OFC transcript is important because it shifts the AAOI debate away from simple “AI exposure” and toward a more demanding question of industrial execution. The company is no longer presenting itself primarily as a cyclical merchant-optics beneficiary. The claim being made is more ambitious: internal laser supply, proprietary automation, and expanding U.S.-based transceiver production can together create a structurally advantaged position in 800G, 1.6T, and eventually CPO-adjacent products. That is a materially different investment proposition. The strategic logic is coherent, and much of the operating outline is corroborated by the filed investor deck, the Q4 2025 earnings release, and subsequent SEC financing filings. At the same time, the Bloomberg transcript includes inaudible passages and some numeric inconsistency versus the filed deck, so precision should be anchored to filed materials rather than every live remark.   
The most important conclusion is that the transcript increases confidence that AAOI is building around a real manufacturing thesis rather than merely participating in AI enthusiasm. It does not, however, prove that the economics will accrue efficiently to shareholders. The central issues are now customer-backed volume commitments, qualification timing, wafer-fab scaling, DSP and substrate availability, and capital discipline. The company may be creating a strategically relevant U.S.-based AI optics manufacturing asset. It is not yet proven that the combination of capex, working-capital intensity, and dilution will leave the upside intact on a per-share basis.  
CURRENT OPERATING BASE
AAOI enters this phase from a meaningfully improved operating base. Q4 2025 revenue was $134.3M. Data center revenue was $74.9M, or about 56% of quarterly sales, and non-GAAP gross margin was 31.4%. The midpoint of Q1 2026 guidance is $157.5M, implying another roughly 17% sequential increase from Q4. Management also guided to more than $1B of revenue in 2026 with more than $120M of non-GAAP operating profit. Those figures indicate that the company is no longer in an early proof-of-concept phase for AI optics; it is attempting a full operating inflection.  
The transition is still incomplete, and that distinction matters. Full-year 2025 revenue was $455.7M, but CATV remained the largest business at $245.1M, or 53.8% of total revenue, while data center contributed $195.7M, or 42.9%. Quarterly mix crossed into data-center majority in Q4, but the full-year business was still not an AI-pure-play revenue model. That means the market is being asked to underwrite not only growth in AI optics, but a rapid migration of earnings power away from a historically cyclical CATV base and toward a much more concentrated hyperscale optics base.  
The FY26 guide is aggressive, but it is not mathematically incoherent. 2025 GAAP operating expense was $191.5M. At a revenue level of $1B, a gross margin in roughly the low-30s is already sufficient to approach the stated operating-profit objective, even before moving from GAAP to non-GAAP. In other words, the company does not need an extraordinary margin regime change to make the guide numerically possible. It mainly needs volume, utilization, and product mix to scale as planned. That is analytically important because it means the core debate is not “can margins ever get high enough,” but “can the volume ramp be delivered with acceptable execution friction.” 
Balance-sheet evidence indicates that the buildout is already real rather than conceptual. Year-end cash was $216.0M. Working capital was $418M. Net property, plant, and equipment rose to $376M from $219M a year earlier. Accounts receivable reached $244.4M and inventory reached $183.1M. That profile is consistent with a company already committing balance-sheet resources to a ramp. It also means the story is inherently capital- and working-capital-intensive before it becomes durably cash generative.  
MANUFACTURING THESIS
The strongest element of the presentation is the manufacturing thesis. The filed deck describes a 2016-2025 internally developed automation stack rather than generic off-the-shelf factory automation. It shows 14 of 17 major process steps using in-house designed equipment, a phase progression from manual lines to a closed-loop “Phase 3” architecture with automated loading, unloading, and material transport, AI-enabled in-process inspection trained on a 9-year dataset, and a proprietary test system that management says increases throughput by 20x. Those are the kinds of details that distinguish a genuine manufacturing capability from a simple cost-reduction narrative.  
The reported operating outcomes are also economically meaningful if they hold in production. The deck claims 3% to 5% yield improvement, more than 35% lower manufacturing cycle time, more than 90% lower labor hours, and DPPM well below 50 for multi-lane single-mode 800G transceivers. Those metrics directly support the company’s broader claim that the manufacturing process is becoming more location-agnostic and therefore more transferable into higher-cost geographies such as the U.S. without fully losing competitiveness. That is the foundation of the entire onshoring argument. Without these automation metrics, the U.S. manufacturing thesis would be far less credible.  
The vertical-integration component strengthens that argument. The deck states that AAOI has 600 engineers across the U.S., Taiwan, and China, a 100% in-house laser fab in the U.S., in-house PCBA, and an internal manufacturing flow that management says has reduced time to market from 2 years to 9 months. Even if the exact time-to-market claim should be treated as directional rather than audited, the strategic implication is clear: the company is attempting to control both photonics content and manufacturing transfer rather than depend on an externally fragmented supply chain. In the current AI-optics environment, where bottlenecks can migrate from lasers to substrates to DSPs to final module assembly, that integration matters. 
U.S. MANUFACTURING AND GEOGRAPHIC POSITIONING
The geographic strategy appears substantive. The filed deck lists Houston at 349,450 sqft across 2 facilities, Taipei at 755,690 sqft across 3 facilities, Ningbo at 1,205,800 sqft across 2 facilities, and Atlanta at 36,000 sqft, with total headcount of about 4,800. It separately discloses a $150M Sugar Land expansion announced on Oct. 28, 2025, including a new 210,000 sqft manufacturing facility focused on AI data-center transceivers and targeted for completion by summer 2026. The strategic point is not that AAOI is abandoning Asia. The strategic point is that incremental AI transceiver capacity is being directed toward the U.S. at a moment when customers increasingly value geopolitical resilience, tariff flexibility, and shorter supply chains.  
The live remarks on aggregate square footage differed somewhat from the filed deck, which is not unusual in conference settings but does argue for relying on the deck for exact figures. That discrepancy does not change the conclusion. The company is clearly trying to create a domestic manufacturing option that is large enough to matter commercially, not just symbolically. The transcript’s most economically relevant claim on this point was management’s statement that U.S. production at scale could be only around 10% to 15% more expensive than Asia on an all-in basis including current tariffs. That statement is not externally verified and should be treated as management opinion, but it is the key bridge between the automation story and the commercial story. If true, that differential is small enough for hyperscalers to pay in exchange for supply-chain resilience.  
The tariff and geopolitical backdrop makes the strategy more logical. AAOI’s 10-K explicitly discusses the company’s exposure to trade-policy changes affecting Chinese-origin goods and reciprocal measures touching Chinese and Taiwanese products, while also noting that a substantial portion of property, plant, and equipment remains located in China and Taiwan. U.S. manufacturing is therefore both an offensive share-gain strategy and a defensive hedge against policy volatility. It reduces risk, but it does not eliminate it, because the supply chain is still transnational and upstream photonics materials remain globally sourced. 
HOW DIFFERENTIATED IS AAOI REALLY
AAOI may be differentiated, but it is not unique. That distinction is essential. Coherent explicitly markets itself as the industry’s most vertically integrated datacom transceiver supplier and describes fully automated high-volume manufacturing plus internal InP and SiP capabilities, including multiple U.S. and European InP fabs. Lumentum also markets a broad datacom portfolio, including transceivers, CW lasers, and 100G and 200G EMLs built on InP, and has publicly stated that it is shipping 200 Gbps/lane EMLs at scale while expanding capacity. The existence of these peers means the investment case cannot rest on a simplistic assumption that AAOI alone has vertical integration or advanced optical manufacturing capability.  
AAOI’s real advantage, if it exists, is narrower and more specific. It is the combination of a Texas laser fab, an explicit U.S.-based transceiver-manufacturing buildout, and an automation architecture intended to compress the normal domestic labor-cost penalty. That is a potentially valuable niche because it maps directly to current hyperscaler priorities. However, it is not the same as owning the technology roadmap. The appropriate relative view is that AAOI may be positioned better than many module assemblers on manufacturing locus and automation, but not necessarily better than the leading photonics incumbents on breadth, balance-sheet depth, or ecosystem leverage.   
CAPACITY RAMP AND ITS IMPLICATIONS
The published capacity ramp is extremely ambitious. The deck shows monthly 800G OSFP capacity rising from 138,000 units in Q2 2026 to 420,000 in Q4 2026 and 550,000 by Q4 2027. Monthly 1.6T OSFP rises from 10,000 to 230,000 and then 380,000. ELSFP rises from 5,000 in Q4 2026 to 50,000 in Q2 2027 and 400,000 by Q4 2027. Combined 800G plus 1.6T capacity therefore rises from 148,000 units per month in Q2 2026 to 650,000 in Q4 2026 and 930,000 in Q4 2027. Those are very large numbers relative to the current revenue base and imply that nominal module assembly throughput is not intended to be the binding constraint. 
That point has several consequences. First, if those capacity figures are directionally real, the bottleneck in 2026 and 2027 is less likely to be physical floor space and more likely to be qualification timing, wafer output, DSP allocation, firmware interoperability, customer readiness, and final demand absorption. Second, the model will become much more sensitive to utilization than many investors may appreciate. A factory system built for nearly 1M units per month of 800G plus 1.6T output can create excellent economics at high utilization and very poor economics at low utilization. Third, the company’s margin story is therefore tightly linked to the credibility of customer-backed commitments, not merely the existence of market demand.  
Using management’s own live Q&A rule-of-thumb of roughly $50M to $80M of transceiver-manufacturing equipment for each additional 100,000 units of monthly capacity, the move from 148,000 to 930,000 monthly 800G plus 1.6T capacity implies a transceiver-equipment requirement on the order of roughly $391M to $626M before separately accounting for the wafer-fab expansion that management described as operating on a different cadence. That estimate is not company guidance. It is an analytical inference based on management’s own framework. The significance of the estimate is that it explains why management could be highly specific on capacity targets while remaining much less specific on exact capex timing and funding mix. The company appears to have a clearer view on the production architecture than on the final capital schedule.  
FINANCING, LIQUIDITY, AND DILUTION
The financing response has been pragmatic and clearly dilutive. As of Feb. 25, 2026, AAOI had 75,198,817 shares outstanding. The company established a new $250M ATM on Feb. 26, 2026, and by Mar. 12, 2026 it had already sold 2,476,307 shares for essentially $250M, then upsized the facility to $500M total. That initial post-year-end issuance diluted the Feb. 25 base by only about 3.3%, implying unusually efficient capital raising because the stock traded dramatically above the $58.12 reference price cited in the Feb. 26 prospectus. The positive interpretation is that liquidity has been materially de-risked. The less positive interpretation is that management has demonstrated a very low threshold for issuing equity when market conditions allow it. 
The broader dilution pattern is already substantial. The 10-K shows repeated ATM usage during 2025, including a fourth ATM that sold about 6.698M shares at an average price of $26.87 for $176.4M of net proceeds. Additional latent dilution remains meaningful. The Amazon customer warrant can reach 7,945,399 shares. The 2030 convertible notes are convertible at about $43.31 into roughly 2.9M shares at the current conversion rate. Existing RSUs and PSUs add further share pressure. On the Feb. 25, 2026 share base, these instruments collectively represent material prospective dilution even before any further ATM issuance under the expanded 2026 facility. The company’s operating narrative has strengthened at exactly the same time its willingness to expand the share count has become unmistakable. 
Liquidity itself is not the near-term problem. The company stated in the 10-K that existing cash, expected cash flow from operations, and current credit facilities are believed sufficient for at least the next 12 months, and it also disclosed about $60.7M of unused borrowing capacity. The real issue is the medium-term funding of a much larger wafer-fab and transceiver-capacity build while preserving per-share economics. Equity issuance can solve the corporate liquidity problem quickly. It does not automatically solve the shareholder-return problem. 
CUSTOMER CONCENTRATION AND REVENUE QUALITY
The revenue base is more concentrated than the OFC messaging might lead some investors to infer. The 2025 10-K identifies Digicomm International at 53.1% of total revenue and Microsoft at 28.8%. That is an extremely concentrated profile by any standard and means current results are still vulnerable to customer timing, program pauses, or internal allocation changes. Management’s statement that the company serves 3 of the top 5 hyperscalers may be directionally correct in terms of engagement, qualification, or shipments, but diversified revenue quality is not yet visible in reported financials.
The Amazon warrant is also economically important because it changes the quality of nominal revenue from that customer. The warrant can vest against up to $4B of aggregate purchases over 10 years, and its grant-date fair value is recorded as a reduction of Amazon revenue as goods and services are transferred. That does not invalidate the strategic relationship. It does mean that reported revenue and margin should be interpreted carefully if Amazon becomes a larger customer. A portion of commercial success with Amazon is effectively rebated through equity. That is rational if it secures demand and lowers go-to-market friction, but it is not neutral for reported economics. 
PRODUCT ROADMAP: 800G, 1.6T, 3.2T, AND CPO
The near-term roadmap is directionally credible because it matches the industry’s migration path rather than trying to invent a separate one. AAOI’s filed roadmap points to 200G/lane optics in mass production, multiple 1.6T OSFP variants, 800G OSFP DR4/FR4, alpha work on 400G/lane optics using TFLN, SiN, and InP, and eventual 6.4T NPO/OBO plus ELSFP. That roadmap maps onto the same bandwidth transitions being discussed by the broader ecosystem around GB200, GB300, Spectrum-X 1600, and Tomahawk 6 generation platforms. 
Broader industry signals support the plausibility of that direction but also highlight the level of competition. Broadcom introduced the industry’s first 400G/lane optical PAM4 DSP in Mar. 2026 and paired it with 400G EML/PD technology, explicitly framing this as the path from 1.6T to 3.2T optics. Lumentum used OFC 2026 to present a 1.6T DR4 OSFP prototype built around 400G differential EMLs and also introduced an 800mW high-power laser for CPO or light-source architectures. The implication is that AAOI is pointed in the correct technical direction, but several larger players are already moving aggressively on the same path with broader installed bases and stronger balance sheets.  
That makes the 800G and 1.6T discussion investable, but it makes the 3.2T and especially ELSFP/CPO discussion much more conditional. The former sits inside an already developing commercial ramp. The latter remains largely an option on future architecture migration. It should not yet carry substantial present valuation weight absent clearer evidence of qualification, socket wins, and economics. The company’s plan to reach 400,000 ELSFP units per month by Q4 2027 is highly ambitious, particularly because management itself suggested that customers probably do not need large ELSFP volumes until sometime in 2027. The correct framing is that ELSFP could become strategically important, but it is not yet a de-risked earnings pillar.  
CPO AND EXTERNAL LASER SOURCE CONTEXT
The architectural logic around external laser sources is sound. NVIDIA’s silicon-photonics materials describe systems that combine integrated silicon photonics with external laser arrays in order to reduce component count and failure points versus pluggables while improving power efficiency, latency, signal integrity, and serviceability. Broadcom already markets a pluggable laser source for its own CPO systems. That external context is important because it validates that AAOI’s ELSFP concept is not promotional novelty. It is part of an industry-level shift toward separating light generation from the highest-density switching silicon.  
However, architectural relevance and investable revenue timing are not the same thing. Even if ELSFP becomes a real category, the value capture will depend on 3 separate questions: which switch architectures win, how many suppliers qualify as preferred light-source vendors, and whether external light-source economics are meaningfully better than pluggables after accounting for lower DSP content and higher laser complexity. The transcript implied that these products could carry better margin than conventional pluggables, which is plausible, but there is not yet enough disclosed evidence to underwrite that assumption aggressively. The right stance is that ELSFP provides upside optionality on architecture change, not near-term earnings certainty.  
SUPPLY CHAIN, INDIUM PHOSPHIDE, AND DSP RISK
Supply-chain control is one of the more compelling reasons to take the AAOI story seriously. Independent industry analysis has highlighted shortages in 100G EMLs and timing pushouts in 1.6T deployments, showing that transceiver demand is not the only variable that matters. Upstream component bottlenecks can slow revenue conversion even in strong end markets. That directly strengthens the strategic value of internal laser manufacturing and management’s emphasis on being less dependent on external allocation. 
The indium phosphide discussion is especially important. AXT, a major substrate supplier, explicitly stated in early 2026 that fewer Chinese export permits for indium phosphide than expected constrained its Q4 2025 revenue, and it subsequently described strong AI-related demand and a plan to double InP manufacturing capacity in 2026. SIA’s Mar. 2026 submission to USTR also emphasized that indium-based compound semiconductors are strategically important, that more than 70% of indium supply is sourced from China, and that qualifying alternative supply takes substantial time and testing. That evidence supports management’s contention that the constraint is largely geopolitical and industrial rather than simply geological scarcity. It also means the problem is real. Internal laser fabrication does not remove dependence on qualified substrate and precursor supply.  
DSP supply remains another meaningful risk. Management stated in the live Q&A that the company currently procures DSPs itself but may eventually move toward customer consignment or customer-managed allocation because hyperscalers want better control across multiple vendors. That comment is analytically significant. It suggests that even if AAOI solves its own laser and assembly constraints, DSP availability could still gate shipments. In other words, the company is trying to control the parts of the stack it can control, but it is not operating in a fully closed system. That limits how confidently capacity numbers can be translated into revenue without further information on secured supply. 
CYCLE RISK AND MARKET-SIZE CLAIMS
The demand backdrop is unquestionably strong, but it should not be treated as linear. The company cites Omdia for a $55B 2029 market for 100G-plus transceivers, which is directionally supportive, but the same deck also explicitly states that third-party market data is not guaranteed. Independent industry work has additionally warned that the current AI-optics upcycle can still produce the classic optical-industry pattern of bottlenecks, double-ordering, eventual digestion, and later inventory correction, including a possible soft landing around 2027. For valuation purposes, TAM growth is therefore a necessary condition for upside, not a sufficient one. Share capture, manufacturing execution, and capital efficiency remain the decisive variables.   
This is particularly important because AAOI’s own capacity targets run ahead of current revenue by a very large margin. If the company builds for a future demand state that arrives 2 to 4 quarters late, the incremental underutilization can materially weaken margins and cash flow even if the long-term strategic thesis remains intact. That asymmetry is one of the central risks in the story. The same operational leverage that creates upside in a tight market can work in reverse if qualification or customer deployment schedules shift.  
OVERALL INVESTMENT INTERPRETATION
The OFC transcript should be viewed as a positive piece of evidence on strategic relevance and a mixed piece of evidence on investability. It is positive because it shows a company with a real factory thesis, real process detail, real balance-sheet deployment, real financing access, and at least some credible customer pull at 800G and 1.6T. It is mixed because the same presentation also makes clear how many variables still need to align: customer concentration remains extreme, product ramps remain qualification-sensitive, wafer-fab scaling is not yet quantified with precision, upstream supply can still interfere, and equity dilution has become a routine financing tool rather than a last resort.   
The bull case is straightforward. AAOI becomes a preferred U.S.-based AI optics supplier with internally controlled lasers, flexible automation, and enough onshore scale to win premium share with hyperscalers that increasingly value resilience, tariff flexibility, and speed of capacity transfer. In that scenario, 800G and 1.6T ramps absorb fixed cost quickly, gross margin stays around the low-30s or better, and future CPO-adjacent light-source products create an additional option value layer. The bear case is equally straightforward. Management extrapolates hot-cycle demand into fixed-capital commitments, 1.6T and ELSFP timing slips, customer concentration remains acute, peers close any manufacturing-locus gap, and the share count expands faster than per-share earnings power.  
The most balanced conclusion is that the transcript materially improves confidence in AAOI’s physical capability to participate in the AI optics buildout, but it does not yet close the loop on per-share value creation. The company now looks less like a speculative AI beneficiary and more like a serious but still high-risk manufacturing scale story. Strategic relevance appears to be increasing. Proof of durable, shareholder-friendly economics still needs to be earned.  
5
68
7,317

Feb 22
New Website Inspiration:
Lovely photography and storytelling scroll experience in this One Pager for LAVA dental Studio.
Credit: DigiComm
Typeface: Josefin Sans, Neue Montreal
→ onepagelove.com/lava-dental-…


8
566