
Disclaimer: Educational analysis only. Not a recommendation to buy or sell. Always do your own research.
#StockMarket #EleconEngineering #TechnicalAnalysis #Investing #BreakoutTrading
1
20

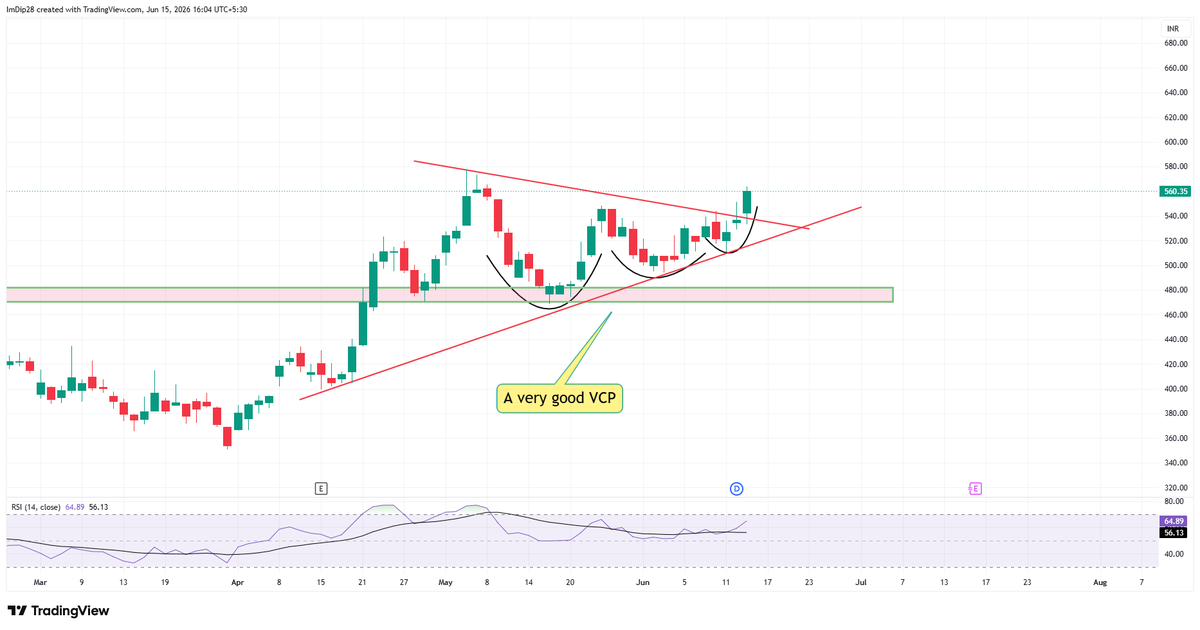
ELECON | Pennant Breakout In Focus
📊 Elecon is trading above its 20 and 50-day EMAs, indicating improving trend strength.
⚖️ The stock is currently consolidating within a pennant pattern, with repeated rejection near the upper boundary.
🚀 The 540 mark emerges as the key breakout level to watch.
📈 A decisive move above 540 can trigger a continuation move and strengthen the ongoing reversal setup.
🎯 Until then, the stock remains in a consolidation phase, with the breakout confirmation being crucial.
#EleconEngineering #BreakoutStocks #StockMarketIndia #TechnicalAnalysis #StocksToWatch
1
357

Jun 11
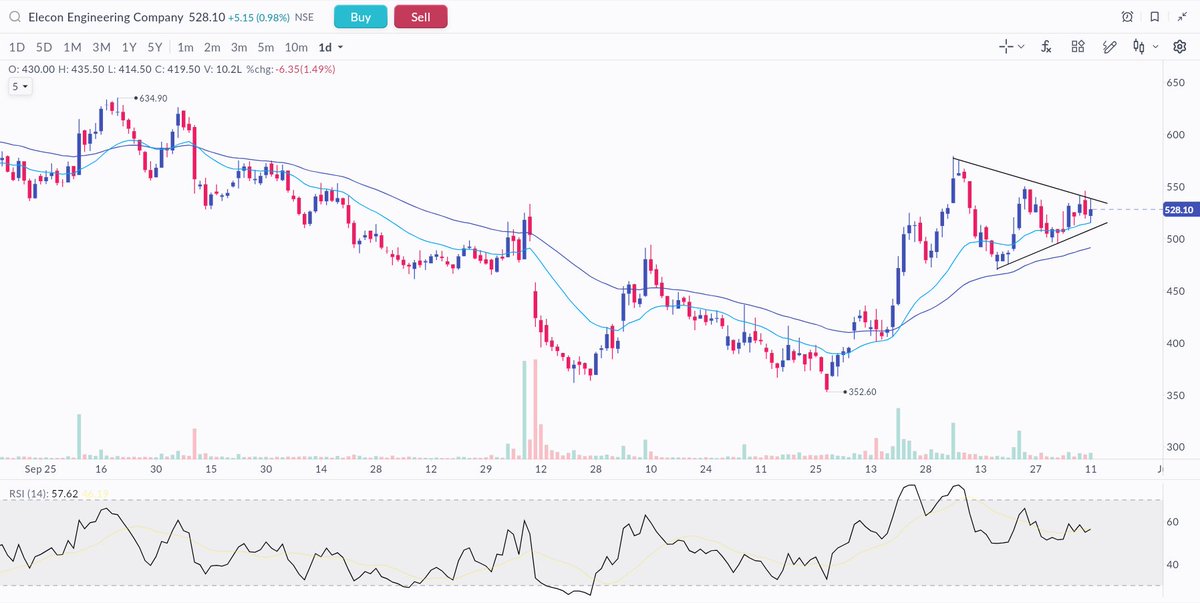
🚀 Elecon Engineering – Swing Setup Alert 📈
Strong technical structure backed by steady momentum and relative strength. stock continues to hold key support zones while showing signs of trend continuation on higher timeframes.
#Elecon #EleconEngineering #BreakoutStocks

1
155

Jun 11
#VijayKedia
Top holdings
#AtulAuto ₹258 Cr,
#NeulandLaboratories ₹220 Cr, #EleconEngineering ₹118 Cr, #SudarshanChemical ₹87 Cr,
#Yatharthhopital ₹81 Cr,
#Vaibhavglobal ₹75 Cr,
#Mahendraholiday ₹46 Cr,
#websolenergy ₹41 Cr,
Showcasing his diversified long-term investment strategy across pharma, chemicals, engineering, healthcare and niche businesses.
Do you holding any stocks in this list
1
1
162

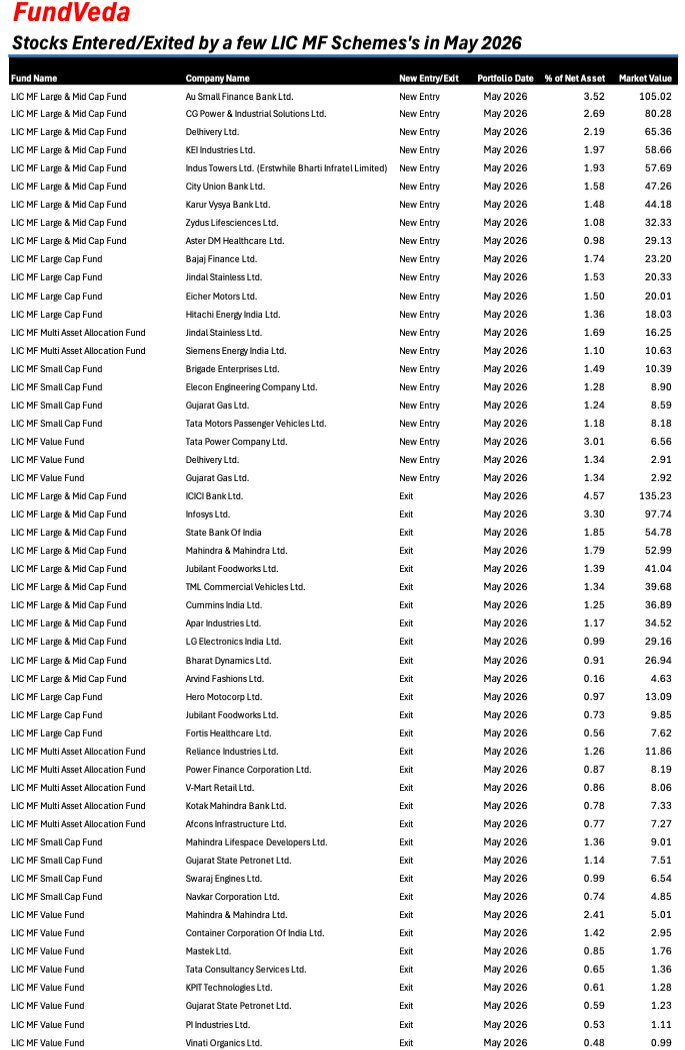
Lets see what stocks did some of the #LIC Equity MFs bought/sold in May 2026.
The trend is clear: Global-facing sectors out, Core Domestic Infrastructure in. 🇮🇳
Entries: LIC is aggresively entering core domestic capex, infrastructure proxies, and regional credit lenders.
🔹 Utilities & Power Grid: #KEIIndustries #HitachiEnergy #SiemensEnergy #TataPower #AparIndustries
🔹 Capex, Heavy Engineering & Defence: #CGPower #EleconEngineering #CumminsIndia #AfconsInfrastructure #BharatDynamics
🔹 Banking & NBFC Credit: #AuSmallFinanceBank #CityUnionBank #KarurVysyaBank #BajajFinance #PFC
🔹 Real Estate & Logistics Hubs: #BrigadeEnterprises #MahindraLifespaces #Delhivery #NavkarCorp #Concor
Exits: Systematically paring back global IT exposure, auto heavyweights, and defensive pharma lines to fund their infrastructure bets:
🔸 Global IT Services: #Infosys #TCS #Mastek #KPITTech
🔸 Automotive Ecosystem: #TataMotors #EicherMotors #Mahindra #HeroMotoCorp #SwarajEngines
🔸 Pharma & Healthcare: #ZydusLife #AsterDMHealthcare #FortisHealthcare
🔸 Materials & Speciality Chemicals: #JindalStainless #Reliance #PIIndustries #VinatiOrganics
🔸 Retail Consumption & City Gas: #JubilantFoodworks #LGElectronics #ArvindFashions #VMartRetail #GujaratGas #GSPL
1
1
360

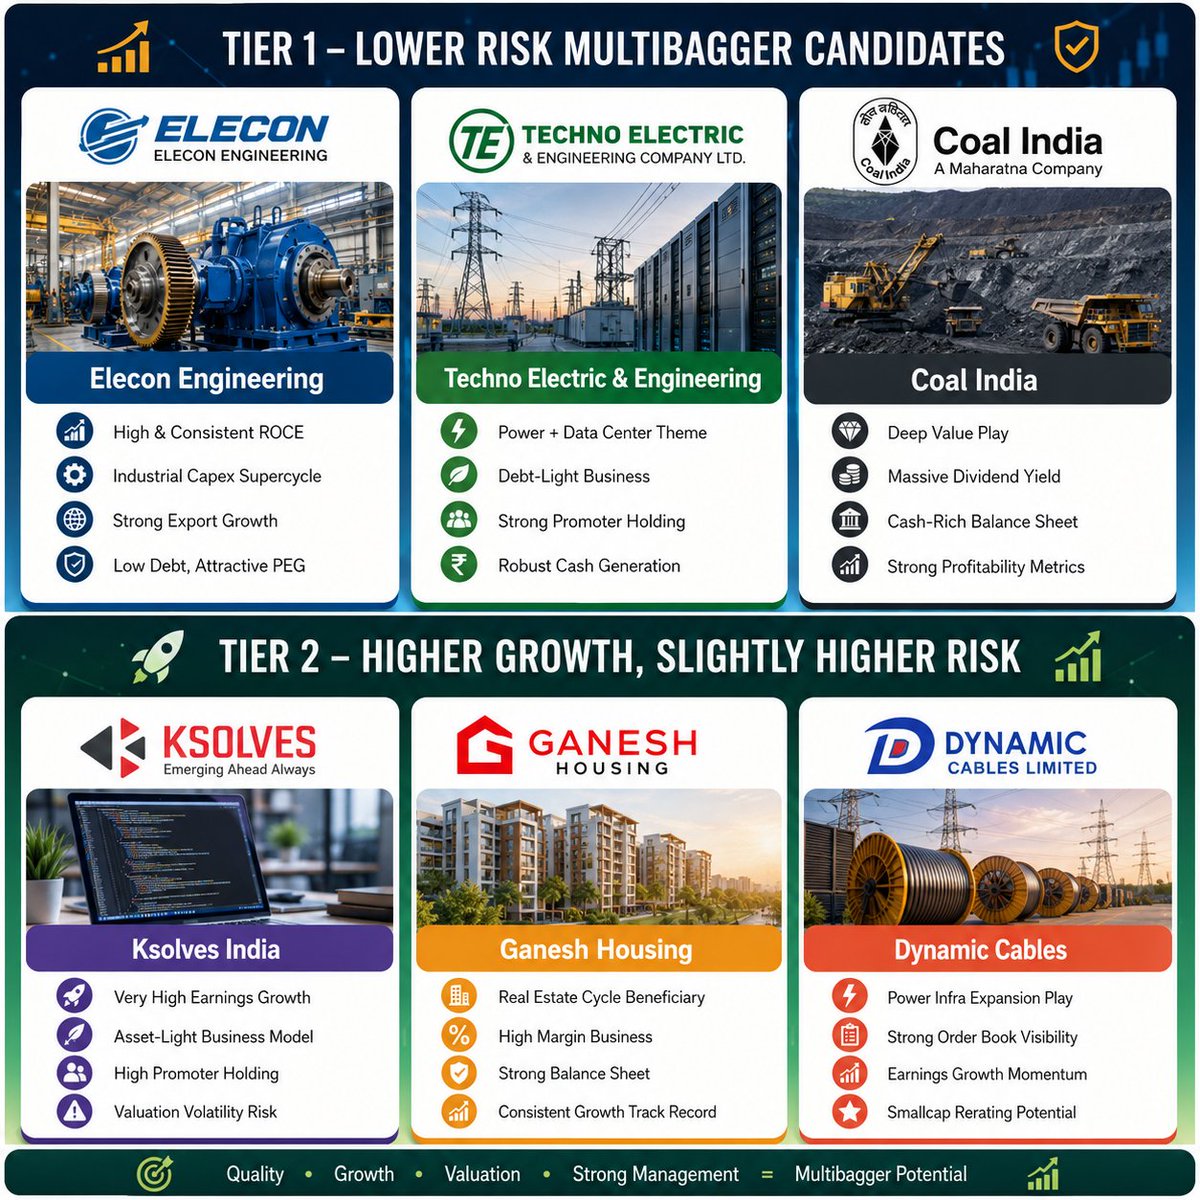
🚨 Potential Multibagger Suspects 🚀💰
🟢 Tier 1 — Lower Risk, Strong Fundamentals
#EleconEngineering
#TechnoElectric
#CoalIndia
🟠 Tier 2 — Higher Growth, Higher Potential
#KsolvesIndia
#GaneshHousing
#DynamicCables
Common Traits:
✅High ROE & ROCE
✅Low Debt
✅Strong Promoter Holding
✅PEG < 1
✅Strong 5Y Sales & Profit Growth
If you found Helpful - ♻️Repost | 📩 Share | 💖Like
#StockMarket #Multibagger #Stocks #Investing #IndianStocks #NSE #BSE #ValueInvesting #Smallcaps #Finance #nstox
4
21
787

Apr 27
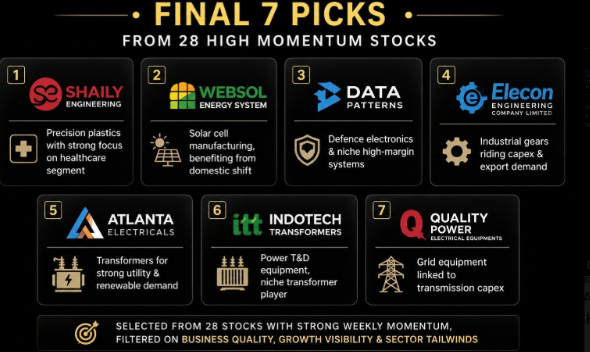
🚨💎 FINAL 7 PICKS FROM 28 HIGH MOMENTUM STOCKS — FILTERED FOR QUALITY, GROWTH & SECTOR TAILWINDS 🔥📊💥
28 stocks screened. 7 SURVIVED.
These are the ones WORTH watching RIGHT NOW 👀
🟢 Shaily Engineering
🟢 Websol Energy System
🟢 Data Patterns
🟢 Elecon Engineering
🟢 Atlanta Electricals
🟢 Indotech Transformers
🟢 Quality Power
#MomentumStocks #TopPicks #IndianStocks #NSE #BSE #Nifty50 #DefenceStocks #SolarEnergy #PowerSector #SmallCap #MidCap #DataPatterns #QualityPower #WebsolEnergy #EleconEngineering #StockMarket #IndiaInvesting #DalalStreet #HighMomentum #MultiBagger 🚀📈🔥
2
5
849

#chartwithyomik
CHART-303
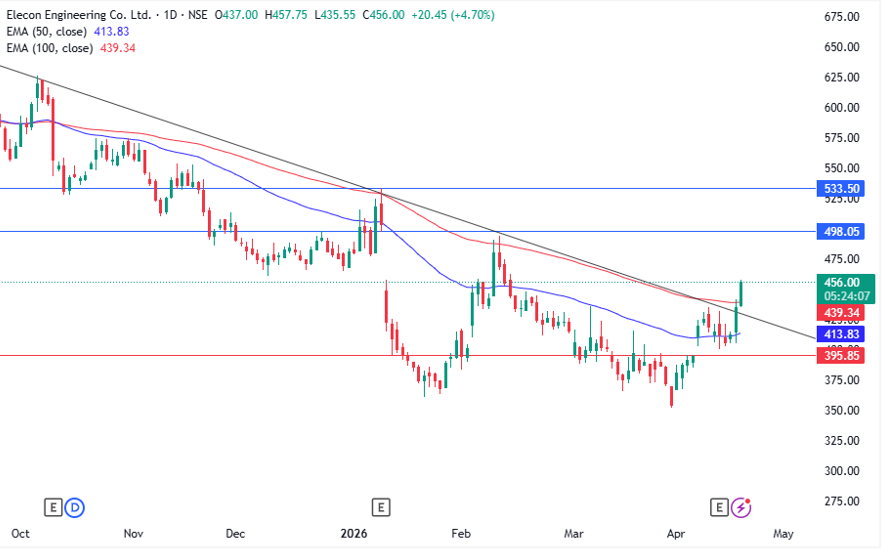
આજે વાત કરીશું ELECON ENGINEERING પર.
શેરમાં લાંબાગાળાની રેજિસ્ટન્સ ટ્રેન્ડલાઇનનું બ્રેકઆઉટ અને 100DEMAને પાર કારોબાર નીકળ્યો.
413ના સપોર્ટની સાથે 500 અને 533ના લેવલ શક્ય.
CMP - 453
#Eleconengineering #stocks #stockmarket (Educational Purpose)

#chartwithyomik
CHART-303
Today we will talk on ELECON ENGINEERING.
• Breakout from long-term resistance trendline
• Trading above the 100 DEMA shows positive momentum
• With support at 413, levels of 500 & 533 are possible.
CMP-453
#Stocks #StockMarket
(Educational Purpose)
2
287

Apr 18
Elecon Engineering Company Ltd Concall Summary for Q4FY26
Financial Performance
- Q4 revenue: Rs 746 cr (vs Rs 798 cr YoY — moderate contraction)
- Q4 EBITDA: Rs 158 cr; EBITDA margin: 21.2%
- Q4 PAT: Rs 108 cr (14.5% margin) — excludes one-time goodwill impairment of Rs 102 cr (old European acquisitions — Benzers & Radicon)
- Net cash balance: ~Rs 700 cr — balance sheet remains strong
Segment Performance
- Gear division: 63% of Q4 revenue; contracted 21% YoY due to dispatch deferments
- MHE division: 37% of Q4 revenue; grew 37% YoY — key growth driver
- FY26 product mix: 55% catalog (standard) 45% engineered (customized) products
Near-Term Headwinds
- Middle East geopolitical disruption caused Rs 70–77 cr revenue impact in March alone
- Customers deferred capex readiness — dispatch cycles disrupted across the value chain
- Receivables rose from Rs 610 cr to Rs 720 cr due to backend-heavy Feb–March sales
- ~Rs 45–46 cr of high-margin engineered product inventory sitting uninvoiced — margins of 25–30% pending recognition
FY27 Guidance Stance
- Management holding guidance — citing "cautious approach" amid macro & geopolitical uncertainty
- No specific growth % guidance given — but no degrowth expected vs FY26
- MHE inquiry pipeline: Rs 1,000 cr — strong visibility
Key Growth Drivers
- Mexico subsidiary established — serves Latin American market & bypasses certain US tariffs
- Indian Navy defense orders: RFP expected in Q1; major order anticipated by Q4FY27
- Capex plan: Rs 400 cr for FY26–FY28; Rs 95 cr spent in FY26; 80% focused on gear division capacity
- 4 patents granted; 3 more applied — active R&D pipeline
Competitive Positioning
- Leadership in India's organised industrial gear market; one of Asia's largest providers
- Large complex MHE systems — limited domestic competition; distinct competitive moat
- Pricing power higher in engineered/customised products — actively prioritising these to protect margins
Management Tone
- Candid about near-term headwinds; resolute on long-term prospects
- Gear division decline termed "transient" — external, not structural
- Notable shift: conservatism in guidance — chose to "hold" rather than risk inaccurate targets
Key Risks
- Execution volatility from geopolitical disruptions — revenue timing unpredictable
- Rising raw material & logistics costs — management baking these into new orders
- Geopolitical uncertainty classified as "fluid" — guidance visibility limited
#Eleconengineering #Q4FY26 #earnings #q4results #stockmarket

2
4
300

Apr 17
Best to worst results till 17 Apr 2026
==============================
RANK 1 — Kesar India Ltd
#KesarIndia
==============================
Revenue grew 108.9% YoY. Operating profit surged 528.9% YoY. Net profit jumped 806.2% YoY.
Total revenue at 84.8 cr vs 91.6 cr QoQ (Rs -6.80 cr -7.4%) and vs 40.6 cr YoY (Rs 44.20 cr 108.9%)
Operating profit at 20.0 cr vs 23.2 cr QoQ (Rs -3.20 cr -13.8%) and vs 3.18 cr YoY (Rs 16.82 cr 528.9%)
Net profit after tax at 14.5 cr vs 15.3 cr QoQ (Rs -0.80 cr -5.2%) and vs 1.6 cr YoY (Rs 12.90 cr 806.2%)
Operating profit margin at 23.6% vs 25.3% QoQ and vs 7.8% YoY
EPS at 5.09 vs 5.48 QoQ and vs 0.65 YoY
==============================
RANK 2 — Lloyds Luxuries
#LloydsLuxuries
==============================
Revenue grew 36.1% YoY. Operating profit turned positive from negative base. Net profit back in the black YoY.
Total revenue at 33.2 cr vs 27.6 cr QoQ (Rs 5.60 cr 20.3%) and vs 24.4 cr YoY (Rs 8.80 cr 36.1%)
Operating profit at 1.68 cr vs -0.71 cr QoQ (Rs 2.39 cr turnaround) and vs -2.64 cr YoY (Rs 4.32 cr turnaround)
Net profit after tax at 0.36 cr vs -34.7 cr QoQ (Rs 35.06 cr turnaround) and vs -4.78 cr YoY (Rs 5.14 cr turnaround)
Operating profit margin at 5.1% vs -2.6% QoQ and vs -10.8% YoY
EPS at 0.15 vs -14.55 QoQ and vs -2.0 YoY
==============================
RANK 3 — M B Agro Prod.
#MBAgro
==============================
Revenue grew 33.0% YoY. Operating profit grew 14.1% YoY. Net profit jumped 321.1% YoY.
Total revenue at 395 cr vs 612 cr QoQ (Rs -217.00 cr -35.5%) and vs 297 cr YoY (Rs 98.00 cr 33.0%)
Operating profit at 41.2 cr vs 66.5 cr QoQ (Rs -25.30 cr -38.0%) and vs 36.1 cr YoY (Rs 5.10 cr 14.1%)
Net profit after tax at 59.8 cr vs 31.8 cr QoQ (Rs 28.00 cr 88.1%) and vs 14.2 cr YoY (Rs 45.60 cr 321.1%)
Operating profit margin at 10.4% vs 10.9% QoQ and vs 12.2% YoY
EPS at 6.82 vs 3.62 QoQ and vs 1.63 YoY
==============================
RANK 4 — VST Industries
#VSTIndustries
==============================
Revenue grew 30.9% YoY. Operating profit surged 199.3% YoY. Net profit jumped 120.8% YoY.
Total revenue at 457 cr vs 373 cr QoQ (Rs 84.00 cr 22.5%) and vs 349 cr YoY (Rs 108.00 cr 30.9%)
Operating profit at 208 cr vs 85.9 cr QoQ (Rs 122.10 cr 142.1%) and vs 69.5 cr YoY (Rs 138.50 cr 199.3%)
Net profit after tax at 117 cr vs 60.2 cr QoQ (Rs 56.80 cr 94.4%) and vs 53 cr YoY (Rs 64.00 cr 120.8%)
Operating profit margin at 45.5% vs 23.0% QoQ and vs 19.9% YoY
EPS at 6.87 vs 3.55 QoQ and vs 3.12 YoY
==============================
RANK 5 — Bajaj Consumer
#BajajConsumer
==============================
Revenue grew 30.8% YoY. Operating profit surged 139.8% YoY. Net profit jumped 105.2% YoY.
Total revenue at 327 cr vs 306 cr QoQ (Rs 21.00 cr 6.9%) and vs 250 cr YoY (Rs 77.00 cr 30.8%)
Operating profit at 76.5 cr vs 56.1 cr QoQ (Rs 20.40 cr 36.4%) and vs 31.9 cr YoY (Rs 44.60 cr 139.8%)
Net profit after tax at 63.6 cr vs 46.4 cr QoQ (Rs 17.20 cr 37.1%) and vs 31 cr YoY (Rs 32.60 cr 105.2%)
Operating profit margin at 23.4% vs 18.3% QoQ and vs 12.8% YoY
EPS at 4.87 vs 3.55 QoQ and vs 2.26 YoY
==============================
RANK 6 — Krishana Phoschem
#KrishanaPhoschem
==============================
Revenue grew 59.6% YoY. Operating profit surged 59.0% YoY. Net profit jumped 152.6% YoY.
Total revenue at 755 cr vs 659 cr QoQ (Rs 96.00 cr 14.6%) and vs 473 cr YoY (Rs 282.00 cr 59.6%)
Operating profit at 89.5 cr vs 70.1 cr QoQ (Rs 19.40 cr 27.7%) and vs 56.3 cr YoY (Rs 33.20 cr 59.0%)
Net profit after tax at 83.1 cr vs 33.3 cr QoQ (Rs 49.80 cr 149.5%) and vs 32.9 cr YoY (Rs 50.20 cr 152.6%)
Operating profit margin at 11.9% vs 10.6% QoQ and vs 11.9% YoY
EPS at 13.72 vs 5.5 QoQ and vs 5.43 YoY
==============================
RANK 7 — SG Finserve
#SGFinserve
==============================
Revenue grew 94.1% YoY. Operating profit surged 99.0% YoY. Net profit jumped 77.7% YoY.
Total revenue at 105 cr vs 85.8 cr QoQ (Rs 19.20 cr 22.4%) and vs 54.1 cr YoY (Rs 50.90 cr 94.1%)
Operating profit at 99.1 cr vs 79.6 cr QoQ (Rs 19.50 cr 24.5%) and vs 49.8 cr YoY (Rs 49.30 cr 99.0%)
Net profit after tax at 42.3 cr vs 32.5 cr QoQ (Rs 9.80 cr 30.2%) and vs 23.8 cr YoY (Rs 18.50 cr 77.7%)
Operating profit margin at 94.4% vs 92.8% QoQ and vs 92.1% YoY
EPS at 6.48 vs 5.81 QoQ and vs 4.26 YoY
==============================
RANK 8 — Waaree Renewables
#WaareeRenewables
==============================
Revenue grew 131.0% YoY. Operating profit surged 64.3% YoY. Net profit jumped 66.3% YoY.
Total revenue at 1102 cr vs 851 cr QoQ (Rs 251.00 cr 29.5%) and vs 477 cr YoY (Rs 625.00 cr 131.0%)
Operating profit at 207 cr vs 159 cr QoQ (Rs 48.00 cr 30.2%) and vs 126 cr YoY (Rs 81.00 cr 64.3%)
Net profit after tax at 156 cr vs 120 cr QoQ (Rs 36.00 cr 30.0%) and vs 93.8 cr YoY (Rs 62.20 cr 66.3%)
Operating profit margin at 18.8% vs 18.7% QoQ and vs 26.4% YoY
EPS at 14.93 vs 11.52 QoQ and vs 9.0 YoY
==============================
RANK 9 — Anand Rathi Share
#AnandRathiShare
==============================
Revenue grew 28.1% YoY. Operating profit surged 51.8% YoY. Net profit jumped 125.8% YoY.
Total revenue at 255 cr vs 248 cr QoQ (Rs 7.00 cr 2.8%) and vs 199 cr YoY (Rs 56.00 cr 28.1%)
Operating profit at 111 cr vs 102 cr QoQ (Rs 9.00 cr 8.8%) and vs 73.1 cr YoY (Rs 37.90 cr 51.8%)
Net profit after tax at 42 cr vs 37.9 cr QoQ (Rs 4.10 cr 10.8%) and vs 18.6 cr YoY (Rs 23.40 cr 125.8%)
Operating profit margin at 43.5% vs 41.1% QoQ and vs 36.7% YoY
EPS at 6.69 vs 6.04 QoQ and vs 4.2 YoY
==============================
RANK 10 — Angel One
#AngelOne
==============================
Revenue grew 38.2% YoY. Operating profit surged 74.6% YoY. Net profit jumped 82.9% YoY.
Total revenue at 1459 cr vs 1335 cr QoQ (Rs 124.00 cr 9.3%) and vs 1056 cr YoY (Rs 403.00 cr 38.2%)
Operating profit at 599 cr vs 529 cr QoQ (Rs 70.00 cr 13.2%) and vs 343 cr YoY (Rs 256.00 cr 74.6%)
Net profit after tax at 320 cr vs 269 cr QoQ (Rs 51.00 cr 19.0%) and vs 175 cr YoY (Rs 145.00 cr 82.9%)
Operating profit margin at 41.1% vs 39.6% QoQ and vs 32.5% YoY
EPS at 3.52 vs 2.96 QoQ and vs 1.93 YoY
==============================
RANK 11 — CRISIL
#CRISIL
==============================
Revenue grew 30.1% YoY. Operating profit grew 37.5% YoY. Net profit grew 45.6% YoY.
Total revenue at 1058 cr vs 1082 cr QoQ (Rs -24.00 cr -2.2%) and vs 813 cr YoY (Rs 245.00 cr 30.1%)
Operating profit at 319 cr vs 340 cr QoQ (Rs -21.00 cr -6.2%) and vs 232 cr YoY (Rs 87.00 cr 37.5%)
Net profit after tax at 233 cr vs 242 cr QoQ (Rs -9.00 cr -3.7%) and vs 160 cr YoY (Rs 73.00 cr 45.6%)
Operating profit margin at 30.2% vs 31.4% QoQ and vs 28.5% YoY
EPS at 31.9 vs 33.02 QoQ and vs 21.86 YoY
==============================
RANK 12 — G M Breweries
#GMBreweries
==============================
Revenue grew 19.5% YoY. Operating profit surged 82.6% YoY. Net profit fell -10.6% YoY.
Total revenue at 202 cr vs 202 cr QoQ (flat) and vs 169 cr YoY (Rs 33.00 cr 19.5%)
Operating profit at 52.4 cr vs 52.6 cr QoQ (Rs -0.20 cr -0.4%) and vs 28.7 cr YoY (Rs 23.70 cr 82.6%)
Net profit after tax at 54.1 cr vs 42 cr QoQ (Rs 12.10 cr 28.8%) and vs 60.5 cr YoY (Rs -6.40 cr -10.6%)
Operating profit margin at 25.9% vs 26.0% QoQ and vs 17.0% YoY
EPS at 23.67 vs 18.39 QoQ and vs 26.46 YoY
==============================
RANK 13 — HDB Financial
#HDBFinancial
==============================
Revenue grew 11.2% YoY. Operating profit grew 14.1% YoY. Net profit grew 41.4% YoY.
Total revenue at 4745 cr vs 4674 cr QoQ (Rs 71.00 cr 1.5%) and vs 4266 cr YoY (Rs 479.00 cr 11.2%)
Operating profit at 2748 cr vs 2616 cr QoQ (Rs 132.00 cr 5.0%) and vs 2408 cr YoY (Rs 340.00 cr 14.1%)
Net profit after tax at 751 cr vs 644 cr QoQ (Rs 107.00 cr 16.6%) and vs 531 cr YoY (Rs 220.00 cr 41.4%)
Operating profit margin at 57.9% vs 56.0% QoQ and vs 56.4% YoY
EPS at 9.04 vs 7.76 QoQ and vs 6.67 YoY
==============================
RANK 14 — Anand Rathi Wealth
#AnandRathiWealth
==============================
Revenue grew 30.0% YoY. Operating profit declined -6.3% YoY. Net profit grew 40.9% YoY.
Total revenue at 277 cr vs 279 cr QoQ (Rs -2.00 cr -0.7%) and vs 213 cr YoY (Rs 64.00 cr 30.0%)
Operating profit at 83.1 cr vs 130 cr QoQ (Rs -46.90 cr -36.1%) and vs 88.7 cr YoY (Rs -5.60 cr -6.3%)
Net profit after tax at 102 cr vs 99.8 cr QoQ (Rs 2.20 cr 2.2%) and vs 72.4 cr YoY (Rs 29.60 cr 40.9%)
Operating profit margin at 30.0% vs 46.6% QoQ and vs 41.6% YoY
EPS at 12.31 vs 12.02 QoQ and vs 8.72 YoY
==============================
RANK 15 — Swaraj Engines
#SwarajEngines
==============================
Revenue grew 20.3% YoY. Operating profit grew 21.2% YoY. Net profit grew 20.3% YoY.
Total revenue at 546 cr vs 473 cr QoQ (Rs 73.00 cr 15.4%) and vs 454 cr YoY (Rs 92.00 cr 20.3%)
Operating profit at 75 cr vs 62 cr QoQ (Rs 13.00 cr 21.0%) and vs 61.9 cr YoY (Rs 13.10 cr 21.2%)
Net profit after tax at 54.6 cr vs 42.1 cr QoQ (Rs 12.50 cr 29.7%) and vs 45.4 cr YoY (Rs 9.20 cr 20.3%)
Operating profit margin at 13.7% vs 13.1% QoQ and vs 13.6% YoY
EPS at 44.91 vs 34.65 QoQ and vs 37.39 YoY
==============================
RANK 16 — ICICI AMC
#ICICIAMC
==============================
Revenue grew 19.5% YoY. Operating profit grew 29.8% YoY. Net profit grew 10.3% YoY.
Total revenue at 1517 cr vs 1515 cr QoQ (Rs 2.00 cr 0.1%) and vs 1269 cr YoY (Rs 248.00 cr 19.5%)
Operating profit at 1160 cr vs 1140 cr QoQ (Rs 20.00 cr 1.8%) and vs 894 cr YoY (Rs 266.00 cr 29.8%)
Net profit after tax at 763 cr vs 917 cr QoQ (Rs -154.00 cr -16.8%) and vs 692 cr YoY (Rs 71.00 cr 10.3%)
Operating profit margin at 76.5% vs 75.2% QoQ and vs 70.4% YoY
EPS at 15.45 vs 18.55 QoQ and vs 391.86 YoY
==============================
RANK 17 — Mastek
#Mastek
==============================
Revenue grew 3.6% YoY. Operating profit grew 8.6% YoY. Net profit grew 30.7% YoY.
Total revenue at 938 cr vs 906 cr QoQ (Rs 32.00 cr 3.5%) and vs 905 cr YoY (Rs 33.00 cr 3.6%)
Operating profit at 151 cr vs 152 cr QoQ (Rs -1.00 cr -0.7%) and vs 139 cr YoY (Rs 12.00 cr 8.6%)
Net profit after tax at 106 cr vs 108 cr QoQ (Rs -2.00 cr -1.9%) and vs 81.1 cr YoY (Rs 24.90 cr 30.7%)
Operating profit margin at 16.1% vs 16.8% QoQ and vs 15.4% YoY
EPS at 34.24 vs 34.96 QoQ and vs 26.2 YoY
==============================
RANK 18 — TCS
#TCS
==============================
Revenue grew 9.6% YoY. Operating profit grew 13.5% YoY. Net profit grew 12.1% YoY.
Total revenue at 70698 cr vs 67087 cr QoQ (Rs 3611 cr 5.4%) and vs 64479 cr YoY (Rs 6219 cr 9.6%)
Operating profit at 19276 cr vs 18269 cr QoQ (Rs 1007 cr 5.5%) and vs 16980 cr YoY (Rs 2296 cr 13.5%)
Net profit after tax at 13784 cr vs 10720 cr QoQ (Rs 3064 cr 28.6%) and vs 12293 cr YoY (Rs 1491 cr 12.1%)
Operating profit margin at 27.3% vs 27.2% QoQ and vs 26.3% YoY
EPS at 37.92 vs 29.45 QoQ and vs 33.79 YoY
==============================
RANK 19 — ICICI Lombard
#ICICILombard
==============================
Revenue grew 12.8% YoY. Operating profit grew 12.6% YoY. Net profit grew 7.3% YoY.
Total revenue at 6825 cr vs 6905 cr QoQ (Rs -80 cr -1.2%) and vs 6051 cr YoY (Rs 774 cr 12.8%)
Operating profit at 686 cr vs 854 cr QoQ (Rs -168 cr -19.7%) and vs 609 cr YoY (Rs 77 cr 12.6%)
Net profit after tax at 547 cr vs 659 cr QoQ (Rs -112 cr -17.0%) and vs 510 cr YoY (Rs 37 cr 7.3%)
Operating profit margin at 10.1% vs 12.4% QoQ and vs 10.1% YoY
EPS at 10.96 vs 13.23 QoQ and vs 10.28 YoY
==============================
RANK 20 — HDFC AMC
#HDFCAMC
==============================
Revenue grew 16.5% YoY. Operating profit grew 15.7% YoY. Net profit fell -2.5% YoY.
Total revenue at 1050 cr vs 1074 cr QoQ (Rs -24 cr -2.2%) and vs 901 cr YoY (Rs 149 cr 16.5%)
Operating profit at 846 cr vs 877 cr QoQ (Rs -31 cr -3.5%) and vs 731 cr YoY (Rs 115 cr 15.7%)
Net profit after tax at 623 cr vs 770 cr QoQ (Rs -147 cr -19.1%) and vs 639 cr YoY (Rs -16 cr -2.5%)
Operating profit margin at 80.6% vs 81.7% QoQ and vs 81.1% YoY
EPS at 14.55 vs 17.98 QoQ and vs 14.94 YoY
==============================
RANK 21 — Wipro
#Wipro
==============================
Revenue grew 7.7% YoY. Operating profit grew 6.2% YoY. Net profit fell -1.8% YoY.
Total revenue at 24236 cr vs 23556 cr QoQ (Rs 680 cr 2.9%) and vs 22504 cr YoY (Rs 1732 cr 7.7%)
Operating profit at 4909 cr vs 4296 cr QoQ (Rs 613 cr 14.3%) and vs 4624 cr YoY (Rs 285 cr 6.2%)
Net profit after tax at 3522 cr vs 3145 cr QoQ (Rs 377 cr 12.0%) and vs 3588 cr YoY (Rs -66 cr -1.8%)
Operating profit margin at 20.3% vs 18.2% QoQ and vs 20.5% YoY
EPS at 3.34 vs 2.97 QoQ and vs 3.41 YoY
==============================
RANK 22 — Nuvoco Vistas
#NuvocoVistas
==============================
Revenue grew 8.7% YoY. Operating profit grew 6.5% YoY. Net profit fell -15.1% YoY.
Total revenue at 3307 cr vs 2701 cr QoQ (Rs 606 cr 22.4%) and vs 3042 cr YoY (Rs 265 cr 8.7%)
Operating profit at 588 cr vs 384 cr QoQ (Rs 204 cr 53.1%) and vs 552 cr YoY (Rs 36 cr 6.5%)
Net profit after tax at 141 cr vs 49.4 cr QoQ (Rs 91.6 cr 185.4%) and vs 166 cr YoY (Rs -25 cr -15.1%)
Operating profit margin at 17.8% vs 14.2% QoQ and vs 18.1% YoY
EPS at 3.94 vs 1.37 QoQ and vs 4.63 YoY
==============================
RANK 23 — Media Matrix
#MediaMatrix
==============================
Revenue grew 10.7% YoY. Operating profit grew 0.6% YoY. Net profit turned positive from negative base.
Total revenue at 301 cr vs 336 cr QoQ (Rs -35 cr -10.4%) and vs 272 cr YoY (Rs 29 cr 10.7%)
Operating profit at 5.41 cr vs 4.08 cr QoQ (Rs 1.33 cr 32.6%) and vs 5.38 cr YoY (Rs 0.03 cr 0.6%)
Net profit after tax at 2.08 cr vs 2.07 cr QoQ (Rs 0.01 cr 0.5%) and vs -0.48 cr YoY (Rs 2.56 cr turnaround)
Operating profit margin at 1.8% vs 1.2% QoQ and vs 2.0% YoY
EPS at 0.01 vs 0.01 QoQ and vs 0 YoY
==============================
RANK 24 — Infollion Research
#InfollionResearch
==============================
Revenue grew 16.9% YoY. Operating profit declined -21.2% YoY. Net profit fell -17.2% YoY.
Total revenue at 49.2 cr vs 51.1 cr QoQ (Rs -1.90 cr -3.7%) and vs 42.1 cr YoY (Rs 7.10 cr 16.9%)
Operating profit at 5.85 cr vs 8.47 cr QoQ (Rs -2.62 cr -30.9%) and vs 7.42 cr YoY (Rs -1.57 cr -21.2%)
Net profit after tax at 5.34 cr vs 7.18 cr QoQ (Rs -1.84 cr -25.6%) and vs 6.45 cr YoY (Rs -1.11 cr -17.2%)
Operating profit margin at 11.9% vs 16.6% QoQ and vs 17.6% YoY
EPS at 5.5 vs 7.4 QoQ and vs 6.65 YoY
==============================
RANK 25 — Just Dial
#JustDial
==============================
Revenue grew 6.2% YoY. Operating profit grew 3.1% YoY. Net profit fell -36.7% YoY.
Total revenue at 307 cr vs 306 cr QoQ (Rs 1 cr 0.3%) and vs 289 cr YoY (Rs 18 cr 6.2%)
Operating profit at 88.8 cr vs 95.2 cr QoQ (Rs -6.40 cr -6.7%) and vs 86.1 cr YoY (Rs 2.70 cr 3.1%)
Net profit after tax at 100 cr vs 118 cr QoQ (Rs -18 cr -15.3%) and vs 158 cr YoY (Rs -58 cr -36.7%)
Operating profit margin at 28.9% vs 31.1% QoQ and vs 29.8% YoY
EPS at 11.76 vs 13.87 QoQ and vs 18.53 YoY
==============================
RANK 26 — Parin Enterprises
#ParinEnterprises
==============================
Revenue grew 6.1% YoY. Operating profit declined -19.1% YoY. Net profit fell -25.5% YoY.
Total revenue at 139 cr vs 109 cr QoQ (Rs 30 cr 27.5%) and vs 131 cr YoY (Rs 8 cr 6.1%)
Operating profit at 12.3 cr vs 9.21 cr QoQ (Rs 3.09 cr 33.6%) and vs 15.2 cr YoY (Rs -2.90 cr -19.1%)
Net profit after tax at 4.32 cr vs 3.02 cr QoQ (Rs 1.30 cr 43.0%) and vs 5.8 cr YoY (Rs -1.48 cr -25.5%)
Operating profit margin at 8.8% vs 8.4% QoQ and vs 11.6% YoY
EPS at 3.42 vs 2.25 QoQ and vs 4.67 YoY
==============================
RANK 27 — Rel. Indl. Infra
#RelIndlInfra
==============================
Revenue declined -32.6% YoY. Operating losses narrowing. Net profit broadly flat YoY.
Total revenue at 8.43 cr vs 12.4 cr QoQ (Rs -3.97 cr -32.0%) and vs 12.5 cr YoY (Rs -4.07 cr -32.6%)
Operating profit at -1.25 cr vs -2.37 cr QoQ (Rs 1.12 cr improving) and vs -3.54 cr YoY (Rs 2.29 cr improving)
Net profit after tax at 3.22 cr vs 3.01 cr QoQ (Rs 0.21 cr 7.0%) and vs 3.2 cr YoY (Rs 0.02 cr 0.6%)
Operating profit margin at -14.8% vs -19.1% QoQ and vs -28.3% YoY
EPS at 2.13 vs 1.99 QoQ and vs 2.12 YoY
==============================
RANK 28 — Eimco Elecon
#EimcoElecon
==============================
Revenue grew 4.0% YoY. Operating profit declined -29.1% YoY. Net profit fell -57.3% YoY.
Total revenue at 66.9 cr vs 63.1 cr QoQ (Rs 3.80 cr 6.0%) and vs 64.3 cr YoY (Rs 2.60 cr 4.0%)
Operating profit at 12.9 cr vs 12.5 cr QoQ (Rs 0.40 cr 3.2%) and vs 18.2 cr YoY (Rs -5.30 cr -29.1%)
Net profit after tax at 6.36 cr vs 12.5 cr QoQ (Rs -6.14 cr -49.1%) and vs 14.9 cr YoY (Rs -8.54 cr -57.3%)
Operating profit margin at 19.3% vs 19.8% QoQ and vs 28.3% YoY
EPS at 11.03 vs 21.7 QoQ and vs 25.78 YoY
==============================
RANK 29 — HDFC Life
#HDFCLife
==============================
Revenue declined -17.8% YoY. Operating profit declined -71.4% YoY. Net profit grew 4.6% YoY.
Total revenue at 19890 cr vs 29428 cr QoQ (Rs -9538 cr -32.4%) and vs 24191 cr YoY (Rs -4301 cr -17.8%)
Operating profit at 108 cr vs 271 cr QoQ (Rs -163 cr -60.1%) and vs 377 cr YoY (Rs -269 cr -71.4%)
Net profit after tax at 497 cr vs 418 cr QoQ (Rs 79 cr 18.9%) and vs 475 cr YoY (Rs 22 cr 4.6%)
Operating profit margin at 0.5% vs 0.9% QoQ and vs 1.6% YoY
EPS at 2.31 vs 1.94 QoQ and vs 2.21 YoY
==============================
RANK 30 — Den Networks
#DenNetworks
==============================
Revenue declined -2.8% YoY. Operating profit declined -46.1% YoY. Net profit fell -39.2% YoY.
Total revenue at 241 cr vs 251 cr QoQ (Rs -10 cr -4.0%) and vs 248 cr YoY (Rs -7 cr -2.8%)
Operating profit at 15.3 cr vs 13.1 cr QoQ (Rs 2.20 cr 16.8%) and vs 28.4 cr YoY (Rs -13.10 cr -46.1%)
Net profit after tax at 36.4 cr vs 40.4 cr QoQ (Rs -4.00 cr -9.9%) and vs 59.9 cr YoY (Rs -23.50 cr -39.2%)
Operating profit margin at 6.3% vs 5.2% QoQ and vs 11.5% YoY
EPS at 0.8 vs 0.8 QoQ and vs 1.3 YoY
==============================
RANK 31 — Elecon Engineering
#EleconEngineering
==============================
Revenue declined -6.5% YoY. Operating profit declined -19.0% YoY. Net profit fell -95.9% YoY.
Total revenue at 746 cr vs 552 cr QoQ (Rs 194 cr 35.1%) and vs 798 cr YoY (Rs -52 cr -6.5%)
Operating profit at 158 cr vs 109 cr QoQ (Rs 49 cr 45.0%) and vs 195 cr YoY (Rs -37 cr -19.0%)
Net profit after tax at 6 cr vs 72 cr QoQ (Rs -66 cr -91.7%) and vs 146 cr YoY (Rs -140 cr -95.9%)
Operating profit margin at 21.2% vs 19.7% QoQ and vs 24.4% YoY
EPS at 0.27 vs 3.21 QoQ and vs 6.53 YoY
==============================
RANK 32 — Sanathnagar Ent.
#SanathnagerEnt
==============================
No revenue operations. Operating losses stable. Net profit fell -47.5% YoY.
Operating profit at -0.08 cr vs -0.08 cr QoQ (flat) and vs -0.14 cr YoY (losses narrowing)
Net profit after tax at 0.21 cr vs -0.08 cr QoQ (turnaround QoQ) and vs 0.40 cr YoY (Rs -0.19 cr -47.5%)
EPS at 0.67 vs -0.25 QoQ and vs 1.27 YoY
==============================
RANK 33 — ICICI Pru Life
#ICICIPruLife
==============================
Revenue declined -79.7% YoY. Operating profit swung to a loss. Net profit jumped 62.1% YoY.
Total revenue at 3185 cr vs 22834 cr QoQ (Rs -19649 cr -86.1%) and vs 15687 cr YoY (Rs -12502 cr -79.7%)
Operating profit at -754 cr vs 741 cr QoQ (Rs -1495 cr swing to loss) and vs 415 cr YoY (Rs -1169 cr swing to loss)
Net profit after tax at 624 cr vs 387 cr QoQ (Rs 237 cr 61.2%) and vs 385 cr YoY (Rs 239 cr 62.1%)
Operating profit margin at -23.7% vs 3.2% QoQ and vs 2.6% YoY
EPS at 4.3 vs 2.67 QoQ and vs 2.67 YoY
==============================
RANK 34 — GTPL Hathway
#GTPLHathway
==============================
Revenue grew 3.7% YoY. Operating profit declined -23.4% YoY. Net profit swung to a loss YoY.
Total revenue at 924 cr vs 933 cr QoQ (Rs -9 cr -1.0%) and vs 891 cr YoY (Rs 33 cr 3.7%)
Operating profit at 80.4 cr vs 113 cr QoQ (Rs -32.60 cr -28.8%) and vs 105 cr YoY (Rs -24.60 cr -23.4%)
Net profit after tax at -13.9 cr vs 11.6 cr QoQ (Rs -25.50 cr swing to loss) and vs 10.8 cr YoY (Rs -24.70 cr swing to loss)
Operating profit margin at 8.7% vs 12.1% QoQ and vs 11.8% YoY
EPS at -1.34 vs 0.98 QoQ and vs 0.95 YoY
==============================
RANK 35 — Lotus Chocolate
#LotusChocolate
==============================
Revenue declined -19.1% YoY. Operating profit swung to a loss. Net profit swung to a loss YoY.
Total revenue at 127 cr vs 134 cr QoQ (Rs -7 cr -5.2%) and vs 157 cr YoY (Rs -30 cr -19.1%)
Operating profit at -12.2 cr vs -10.9 cr QoQ (Rs -1.30 cr -11.9%) and vs 5.66 cr YoY (Rs -17.86 cr swing to loss)
Net profit after tax at -4.47 cr vs 0.14 cr QoQ (Rs -4.61 cr swing to loss) and vs 1.42 cr YoY (Rs -5.89 cr swing to loss)
Operating profit margin at -9.6% vs -8.1% QoQ and vs 3.6% YoY
EPS at -3.48 vs 0.11 QoQ and vs 1.11 YoY
==============================
RANK 36 — Alok Industries
#AlokIndustries
==============================
Revenue grew 3.1% YoY. Operating profit turned positive from negative base. Net losses deepened -159.1% YoY.
Total revenue at 983 cr vs 858 cr QoQ (Rs 125 cr 14.6%) and vs 953 cr YoY (Rs 30 cr 3.1%)
Operating profit at 3.51 cr vs 0.08 cr QoQ (Rs 3.43 cr 4287.5%) and vs -23.2 cr YoY (Rs 26.71 cr turnaround)
Net profit after tax at -193 cr vs -218 cr QoQ (Rs 25 cr improving) and vs -74.5 cr YoY (Rs -118.50 cr -159.1%)
Operating profit margin at 0.4% vs 0.0% QoQ and vs -2.4% YoY
EPS at -0.39 vs -0.44 QoQ and vs -0.15 YoY
==============================
RANK 37 — Alka India
#AlkaIndia
==============================
No revenue base for YoY comparison. Both operating profit and net profit turned positive from negative base.
Total revenue at 2.5 cr vs 0 cr QoQ (new revenue this quarter)
Operating profit at 0.81 cr vs -0.11 cr QoQ (Rs 0.92 cr turnaround) and vs -0.38 cr YoY (Rs 1.19 cr turnaround)
Net profit after tax at 0.82 cr vs -0.11 cr QoQ (Rs 0.93 cr turnaround) and vs -0.38 cr YoY (Rs 1.20 cr turnaround)
EPS at 1.64 vs -0.22 QoQ and vs -0.01 YoY
==============================
RANK 38 — Tejas Networks
#TejasNetworks
==============================
Revenue declined -82.5% YoY. Operating losses deepened. Net losses worsened -193.9% YoY.
Total revenue at 333 cr vs 307 cr QoQ (Rs 26 cr 8.5%) and vs 1907 cr YoY (Rs -1574 cr -82.5%)
Operating profit at -118 cr vs -134 cr QoQ (Rs 16 cr improving QoQ) and vs 122 cr YoY (Rs -240 cr swing to loss)
Net profit after tax at -211 cr vs -197 cr QoQ (Rs -14 cr worsening) and vs -71.8 cr YoY (Rs -139.20 cr -193.9%)
Operating profit margin at -35.4% vs -43.6% QoQ and vs 6.4% YoY
EPS at -11.89 vs -11.07 QoQ and vs -4.07 YoY
1
3
450

Apr 15
Elecon Engineering Company Limited Q4 FY26 Results (Consolidated):
🔹Net Revenue from Operations: ₹745.61 Cr (-6.51% YoY | 35.14% QoQ)
🔹PBT: ₹40.39 Cr (-78.97% YoY | -57.02% QoQ)
🔹PAT: ₹6.00 Cr (-95.90% YoY | -91.67% QoQ)
🔹EPS: ₹0.27 vs ₹6.53 (-95.87% YoY)
Key Points:
Exceptional Item: Profit was impacted by an exceptional loss of ₹101.77 Cr during the quarter.
Dividend: The Board has recommended a final dividend of ₹1.50 (150%) per equity share for FY 2025-26.
#Q4FY26 #EleconEngineering #Stockmarket #Earnings
2
33

Apr 14
Q4 FY2026 Results (15th Apr):
🔹ICICI Lombard General Insurance Company
🔹HDB Financial Services
🔹Elecon Engineering Company
🔹Tejas Networks
🔹Reliance Industrial Infrastructure
🔹Lotus Chocolate Company
🔹GTPL Hathway
🔹SPEL Semiconductor
🔹Media Matrix Worldwide
🔹Citi Port Financial Services
🔹Nikki Global Finance
Source: Money Control
Enjoyed this post?
💬 Like it
📲 Share it
👥 Tag a friend who’d love this
And hit that follow button to stay in the loop with the latest market buzz!
#earnings #Q4FY26 #Q4Results #FY26 #Reliance #ICICILombard #TejasNetworks #LotusChocolate #Hathway #eleconengineering
3
447

⚠️ ELECON'S TRIPLE THREAT: Guidance Cut ✂️ Margin Crash 📉 CFO Exit 🚪
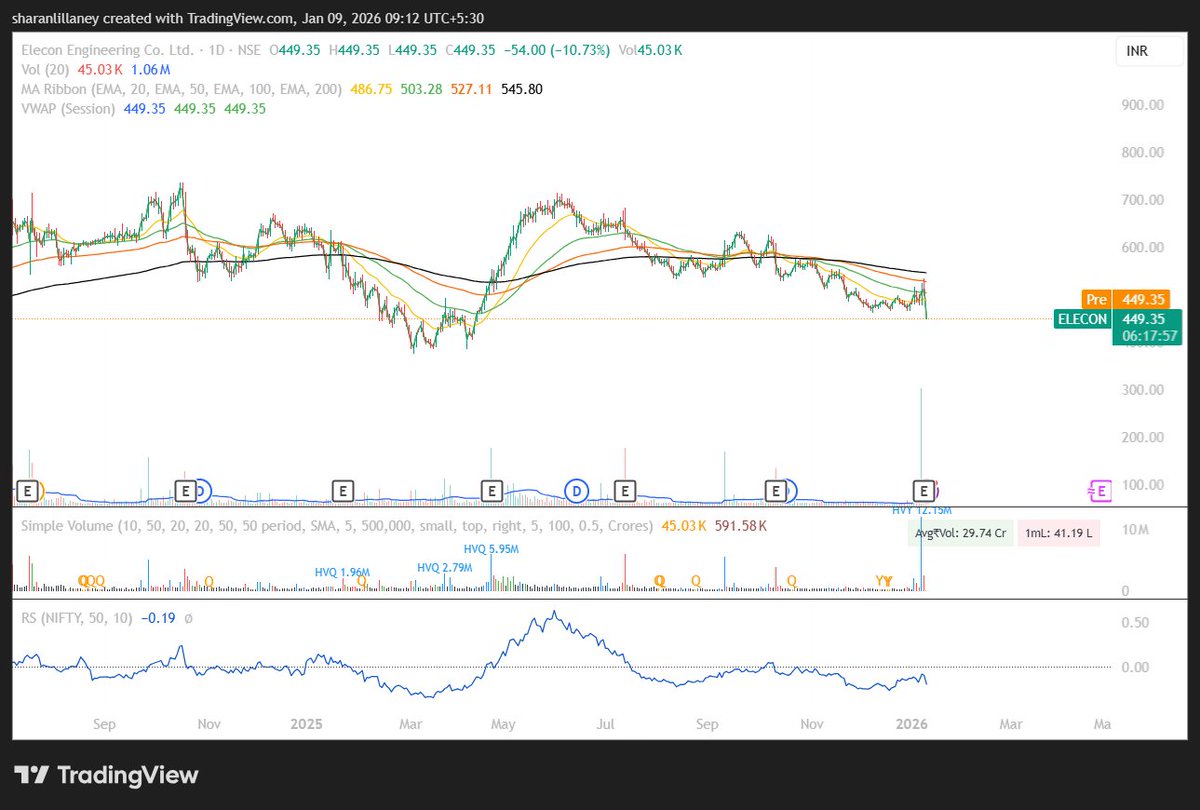
Elecon Engineering crashed 16% to ₹420 (9-month low) on Jan 9, 2026
The numbers LOOKED okay:
▪️ Q3 Revenue: ₹552cr ( 4% YoY)
▪️ Order Book: ₹1,372cr ( 24% YoY)
▪️ Order Intake: ₹701cr ( 7% YoY)
So why the panic selling?🤔🤔
Behind the "decent" revenue, profits COLLAPSED:
📉 PAT: ₹72cr (-33% YoY)
📉 EBITDA: ₹109cr (-23% YoY)
📉 EBIT Margin: 18.2% (Gear) vs 27.8% last year
😭Revenue up 4%, Profit down 33%
EBITDA Margin:
▪️Q3 FY25: 27.0%
▪️ Q3 FY26: 19.8%
🔴 Compression: 717 basis points
Gross Margin:
▪️Q3 FY25: 49.3%
▪️ Q3 FY26: 43.3%
🔴 Compression: 610 basis points
Multi-quarter LOW on both metrics!
This suggests:
✗ Pricing pressure from competition
✗ Higher raw material costs not passed on
✗ Structural shift to lower-margin business
Not easily reversible! ⚠️
THE GUIDANCE CUT:
🔻Mid-year guidance CUT announced:
FY26 Revenue:
Down ~5% from ₹2,650cr → ~₹2,518cr
THE CFO RESIGNATION : 💣
🔆 CFO Narasimhan Raghunathan RESIGNED (Effective: Jan 31, 2026)
🔆Announced: Same day as terrible results
🔆 Reason: "Personal commitments"
❌THE SECTOR HEADWINDS:❌
Capital goods sector facing tough FY26:
📉 Private capex flat/declining
📉 Government spending growth moderating
📉 Steel/cement expansion projects delayed
📉 Global demand muted
📉 Competition intensifying
This isn't just Elecon - it's SECTOR-WIDE 🏭
#EleconEngineering #StockMarket #IndianStocks #MarginCompression
#EarningsAnalysis #CapitalGoods #InvestingIndia #StockCrash
#NSE #BSE
1
3
298

Jan 9
Stocks In News | Elecon Engineering Q3 Results
- Revenue up marginally YoY, but EBITDA and profit decline
- Order book strong at ₹1,372 cr
- FY26 guidance trimmed: Revenue may be lower by up to 5%, EBITDA margin by up to 2%
@vinnii_motiwala
@CNBCTV18News
#StocksInNews #EleconEngineering #Earnings #OrderBook #Markets
2
1,581

Jan 9
#MarketsWithBS | #EleconEngineering tanks 13% on posting #Q3Results; check details here 👇
#markets #sharemarket #stockmarket #StockMarketNews
mybs.in/2g33lol
440

Nothing great happens below the 200 EMA – #Elecon is another live example.
After retesting its Oct ’24 highs in Jun ’25, the stock has been in a steady downtrend – lower highs, lower lows and RS sliding under zero. Today it opens ~10% down, extending the same trend rather than “surprising” anyone following the chart.
Price is now well below all key EMAs – 20/50/100/200 .
Immediate support sits around ₹440; if weakness continues, the next demand zone comes near ₹420–400.
On the upside, any bounce towards ₹480–500 will likely meet supply from the falling short-term MAs. The bigger trend only changes if the stock can reclaim and hold above the 200 EMA (~₹546).
Not invested. Educational post. Consult your financial advisor before investing.
#ELECON #PriceAction #TrendFollowing #NSEStocks #RiskManagement #stoploss #nifty #nifty50 #eleconengineering #banknity #Engineering #banknifty #trending #SwingTrading #TrendingNow #trump #Ashes2025 #Venezuela #Iran #taiwan #Dhurandar2 #ToxicTheMovie #niftyit #StocksToWatch #stocksinfocus #stockmarketindia
15
15
665
Jan 8
#EleconEngineering Q3 Results | Revenue up, net profit falls 33% on flat gear revenue, margin pressure
#3QWithCNBCTV18 | @jpullokaran
buff.ly/CVWGPOh

2
4
1,311

Elecon Engineering : Same picture even after 4 quarters.
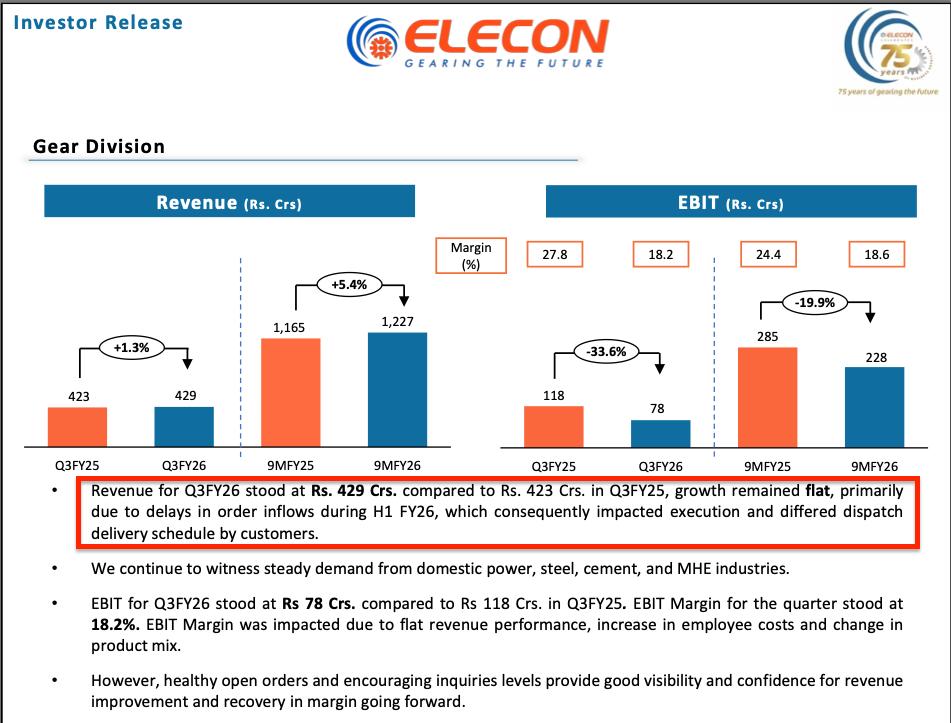
Gear division : Continue to the downward trajectory. Revenue is flat YoY & Margins down from high of 27.8% to 18.2% 👎
Reason : Order delays & deferred dispatches.
Not a buy/sell recommendation.
#elecon #EleconEngineering #Q3FY26
6
1,225

Jan 8
Stock In News | Elecon Engineering, LG Electronics & Tata Steel समेत आज कौन-से शेयर फोकस में रहेंगे?
किन खबरों के दम पर बाजार में रहेगा तगड़ा एक्शन?
जानिए #StockInNews में...
#StockMarket #LGelectronics #EleconEngineering @rainaswati @JanhaviLadda
3
17
2,599