
High-Temperature DIC & Video Extensometer: XTOP3D Full-Field Strain Measurement for Material Testing at Elevated Temperatures
linkedin.com/feed/update/urn…

1
2
18

19 Nov 2025
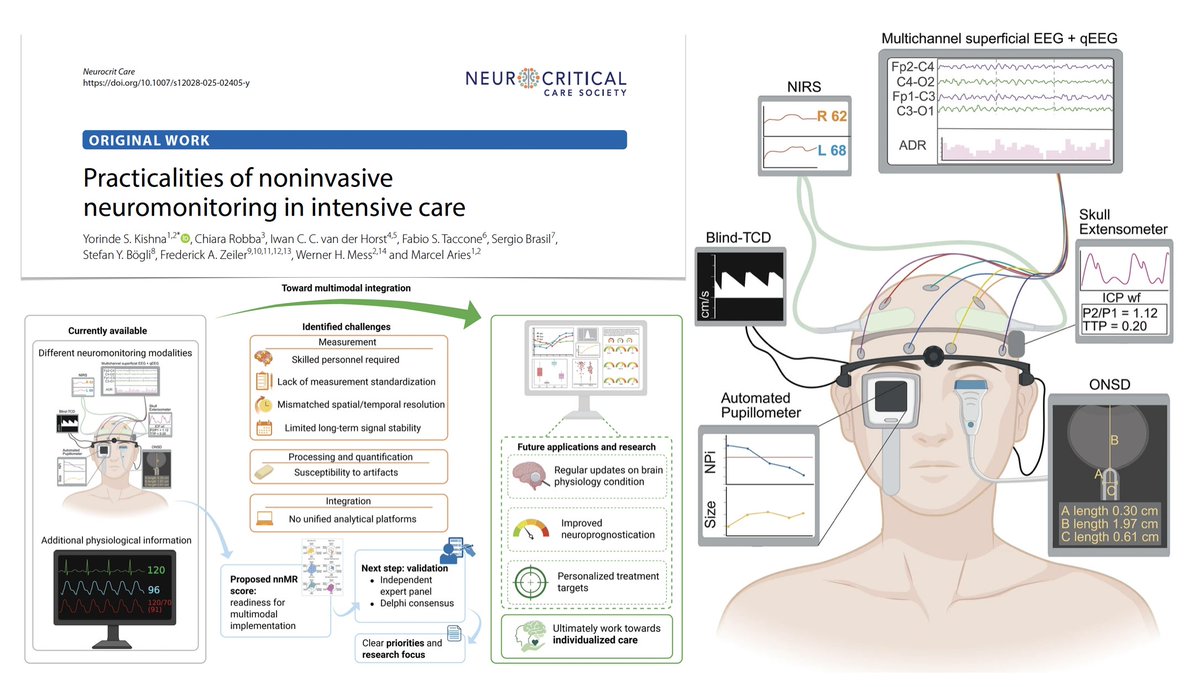
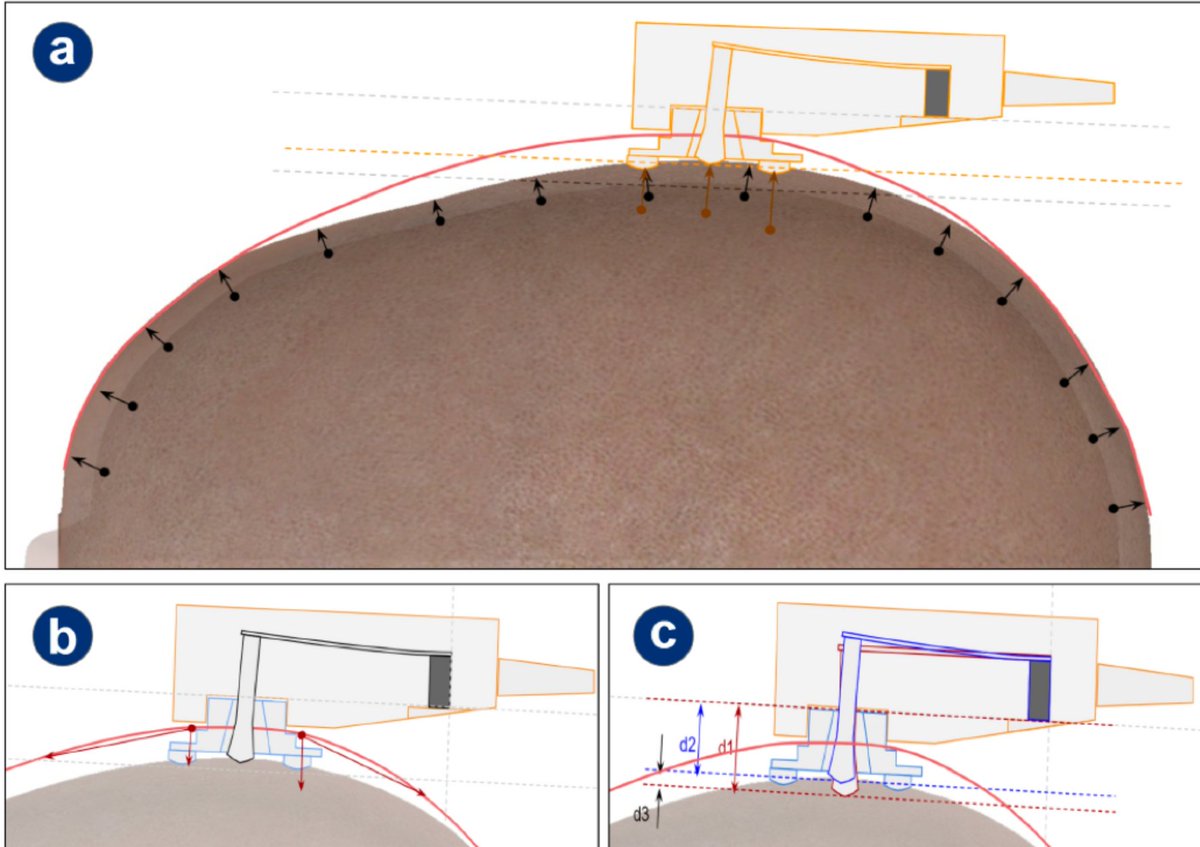
How to use noninvasive neuromonitoring in #ICU? Exploring practical matters/challenges of combining multiple noninvasive neuromonitoring modalities
🖥️ blind-TCD (traditional nonimaging TCD)
🖥️ OSND measurement
⚡️ multichannel continuous EEG
👁️ automated pupillometry
🚨 NIRS
💀 skull extensometer
🧮 non-invasive neuromonitoring multimodal readiness nnMR score
🛠️ trained personnel for montage, maintenance, processing
🚧 noncompliance/awakening, ICU environment and patient confounders
🔮 future perspectives
#FOAMcc @NeurocritCareJ
🔓 rdcu.be/eQOcT
47
145
7,055

16 Nov 2025
⛰️⛰️ Strain and #Deformation Analysis Using #3D #Geological Finite #Element Modeling with Comparison to Extensometer and Tiltmeter #Observations
✍️ Meng Li et al.
🔗 brnw.ch/21wXx3g

6
19
768

1 Oct 2025
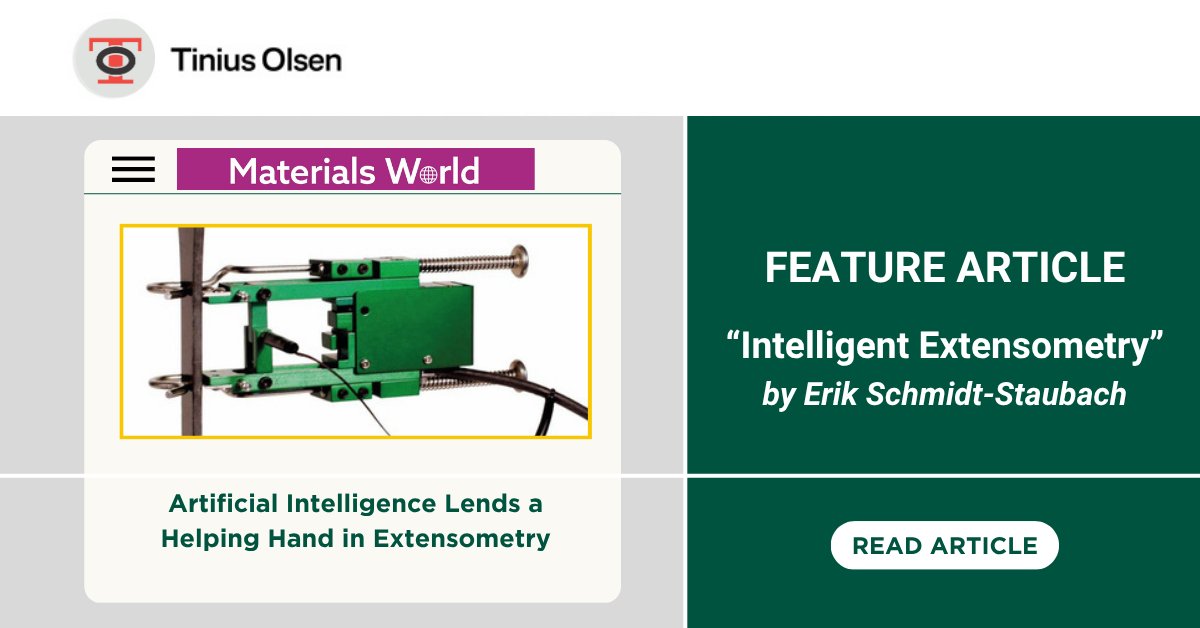
Digital AI-based extensometers provide better data, repeatable results & improved cost efficiencies
📰 Learn how non-contact extensometer systems enable the advancement of a digital, data-driven process in this @iom3 article iom3.org/resource/intelligen…
#extensometry #MaterialsTesting
1
2
46

12 Jun 2025
Instron launches new AVE3 Advanced Video Extensometer for testing battery materials zurl.co/68Qe7
-
@instron #electriccars #engineer

1
3
234
12 May 2025
New optical extensometer technology offers non-contact, high-accuracy measurement designed to overcome common challenges. Learn about Tinius Olsen’s updated Vector Extensometer designed to minimize manual errors in calculation.
tiniusolsen.com/new-extensom…
#extensometer #AI

1
2
50

25 Feb 2025
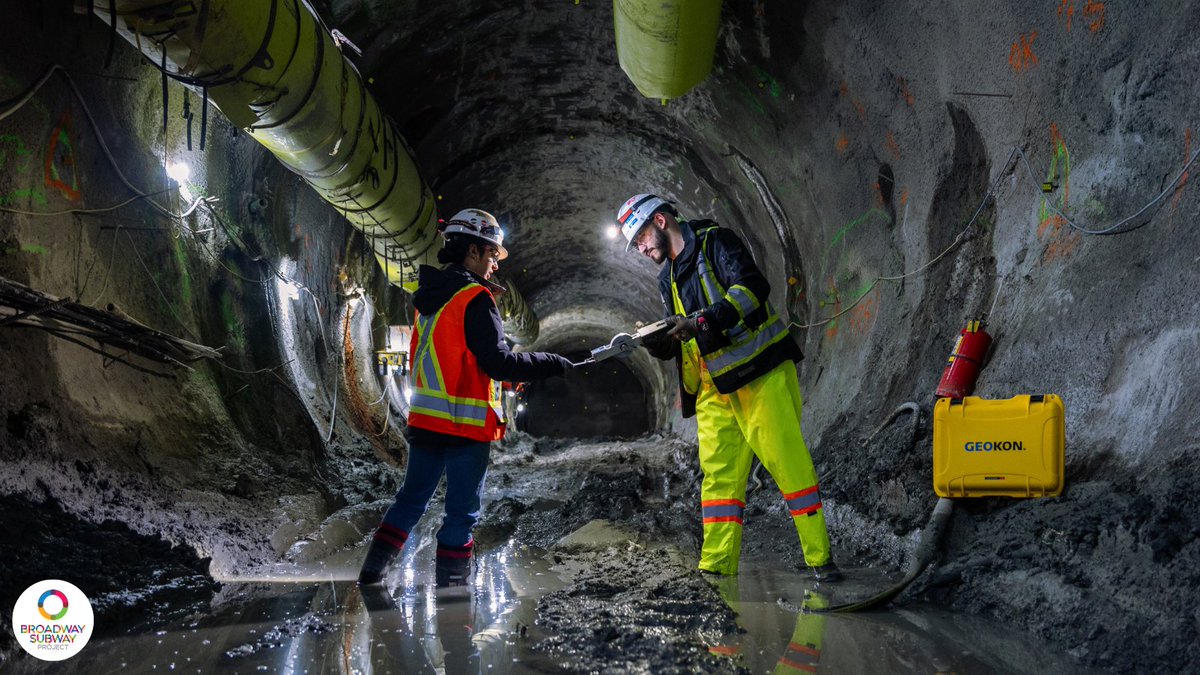
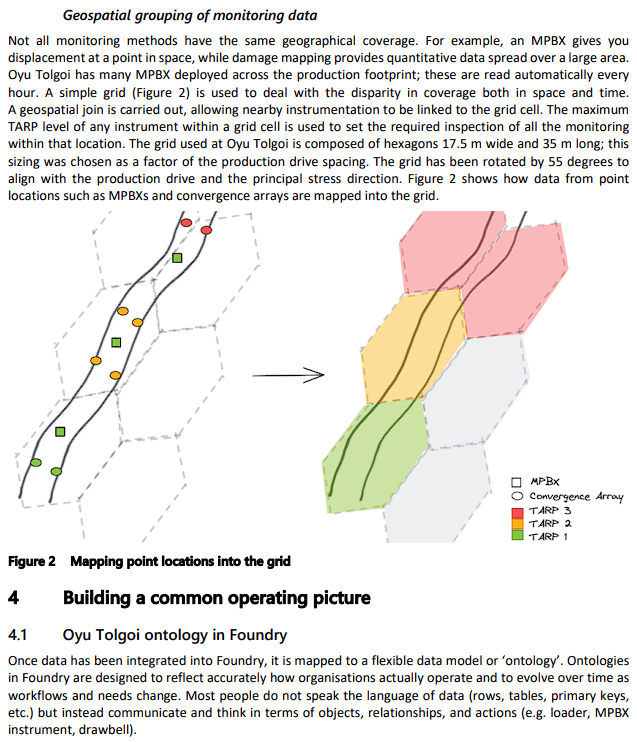
Here, geotechnical engineers survey the end of the tunnels at Arbutus Station.
Using a tape extensometer, they measure the precise distance between fixed points in the tunnel, which can detect changes in tunnel alignment. This ensures that the tunnels are constructed safely.
1
15
1,814

26 Jan 2025
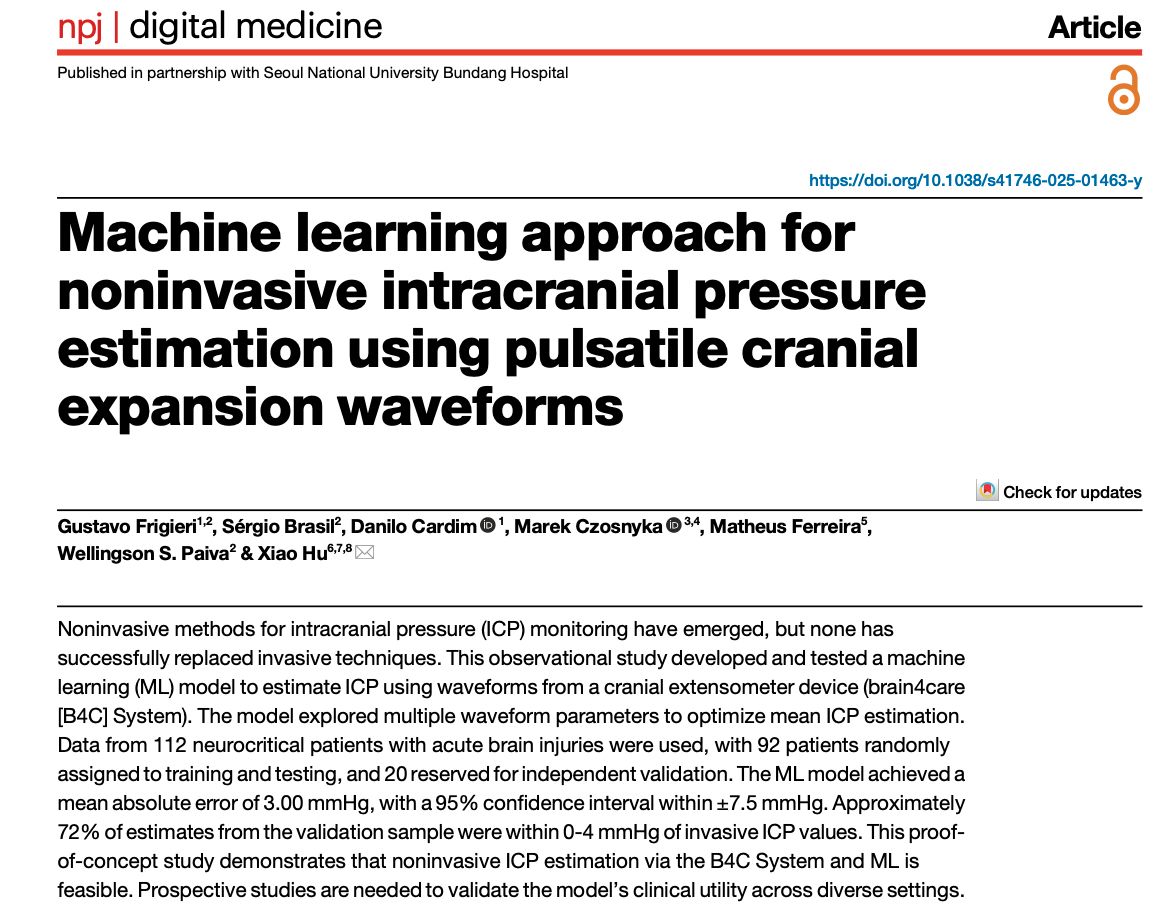
A machine learning model was developed by @brain4care @emoryuniversity to estimate intracranial pressure (ICP) using waveforms from a cranial extensometer device (brain4care [B4C] System), with findings suggesting that noninvasive ICP estimation via the B4C System is feasible, warranting further validation in diverse clinical settings. Read more: nature.com/articles/s41746-0…
1
3
7
755

15 Jan 2025
Pinar Uysal et al: Noninvasive Method Using Mechanical Extensometer for the Estimation of Intracranial Compliance by Repeated Measures Agreement Analysis
Link: ow.ly/2EQu50UuBVz
@neurocritical #neurocritcare
2
526

3 Nov 2024
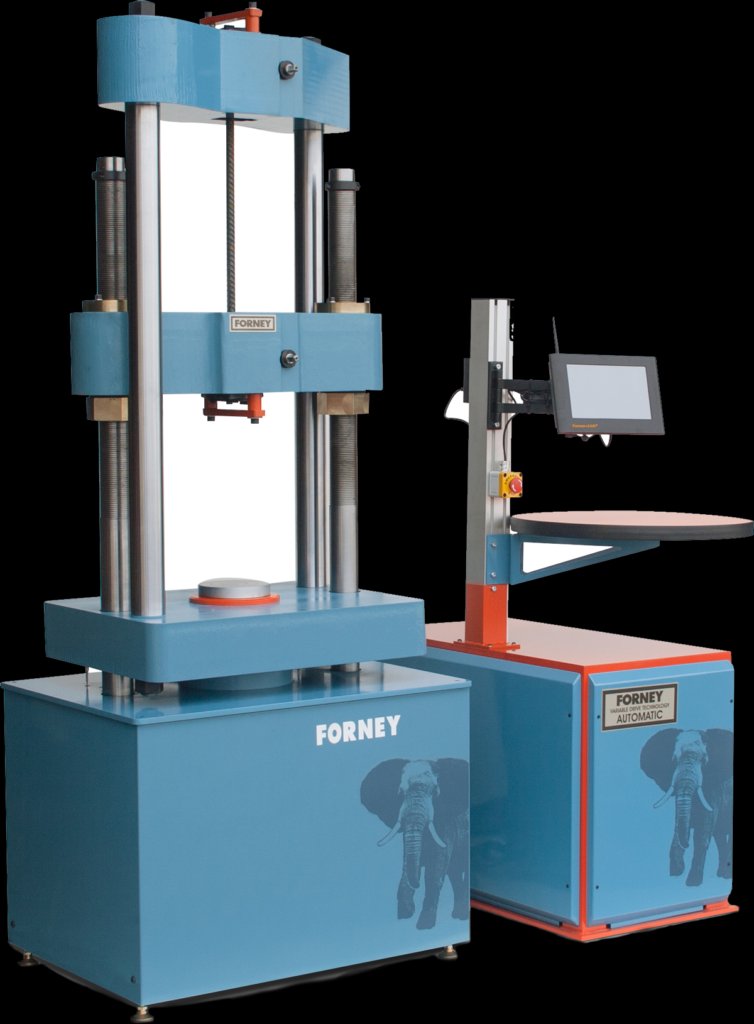
A Universal Testing Machine (UTM), also known as a universal tester, materials testing machine, or materials test frame, is a versatile piece of equipment used to test the mechanical properties of materials. Here's an overview:
Function:
UTMs are designed to perform various types of mechanical tests on materials, components, and structures. They can measure properties like:
Tensile Strength: How much force a material can withstand before breaking when stretched.
Compressive Strength: How much force a material can take before failing under compression.
Flexural Strength or Bend Test: Measures resistance to bending or flexing.
Shear Strength: The ability of a material to resist forces that cause internal layers to slide against each other.
Hardness: While not directly measured, related tests like indentation can be performed.
Fatigue: How well a material can perform under repeated loading and unloading cycles.
Components:
Load Frame: The main structural component that supports the test specimen and the loading mechanism.
Actuators: These apply the force to the specimen. Hydraulic or electromechanical systems can be used, with electromechanical often preferred for precise control in smaller or more precise tests.
Load Cell: Measures the force applied to the specimen.
Extensometer: Measures the elongation or deformation of the specimen during the test.
Control System: Allows the operator to control the speed and extent of the test, manage data acquisition, and sometimes even automate testing procedures.
Grips or Fixtures: Customized to hold the specimen appropriately for different types of tests.
Types of Universal Testing Machines:
Electromechanical: Use electric motors for applying force. They are quieter, cleaner, and offer very precise control, making them suitable for both tension and compression tests, especially at lower force levels.
Hydraulic: Typically used for higher force applications. They can apply large forces quickly but might be less precise for applications needing fine control.
Applications:
Material Science: For determining material properties for research or quality control.
Industry: From automotive to aerospace, testing components for safety and durability.
Construction: Testing building materials like concrete or steel for compliance with standards.
Education: Used in engineering and materials science courses for teaching mechanical properties.
Operation:
The specimen is mounted between the grips or fixtures.
The machine applies force at a controlled rate via the actuator.
Data like force, displacement, and time are recorded.
Results are analyzed to determine the material's properties.
Advantages:
Versatility: One machine can perform multiple types of tests by simply changing the fixtures and settings.
Precision: Modern UTMs are highly precise, allowing for detailed analysis of material behavior.
Standardization: Many tests performed by these machines align with international standards like ASTM, ISO, etc.
Universal Testing Machines are indispensable in environments where understanding the mechanical behavior of materials under different conditions is crucial for design, safety, and innovation.
6
2
8
119

9 Aug 2024
"The extensometer rod and the casing surrounding it weigh roughly 50,000 pounds combined.
By touching the bottom of the aquifer, Connock said the instrument will record evidence of sediment compaction that leads to sinking."
whro.org/environment/2024-08…
2
4
343

21 May 2024
🏗️ Struggling with Extensometer Setup for Strand Wire? Look no further! 🛠️
At Annoor Labs, we offer your one-stop solution for all civil engineering problems! Whether it's Extensometer Setup or any other challenge, we've got you covered!
📞 91 9908056677
📞 91 7093910033
3
37

20 May 2024
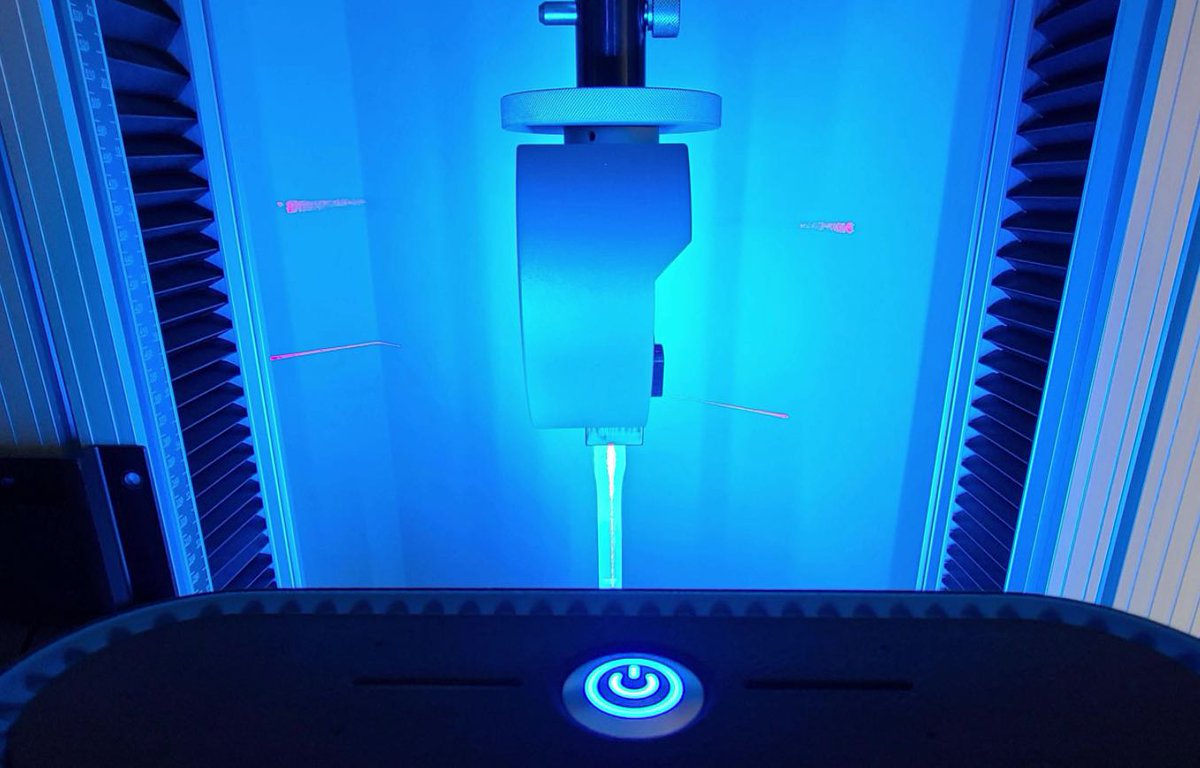
A tensile test to determine M.O.E. (Modulus of Elasticity)
One of the reasons the extensometer is used to measure elongation.
7
192
19 Mar 2024
VectorExtensometer's new U70 model meets the needs of metal industry materials with smaller FOV requirements. Talk to us about the latest groundbreaking extensometer technology and how to achieve record ROI time #testing #TiniusOlsen #VectorExtensometer
tiniusolsen.com/product/vect…
2
56

8 Jan 2024
Future of Global High-Precision Optical Extensometer Market During Geopolitical Unrest and Inflation 2024 to 2030 ift.tt/d5OPZH0 #marketresearch #marketanalysis #marketresearchreports #businessintelligence
2

@istanbuledutr
@iu_debien
@Kandilli_info
@TUBITAK_MAM
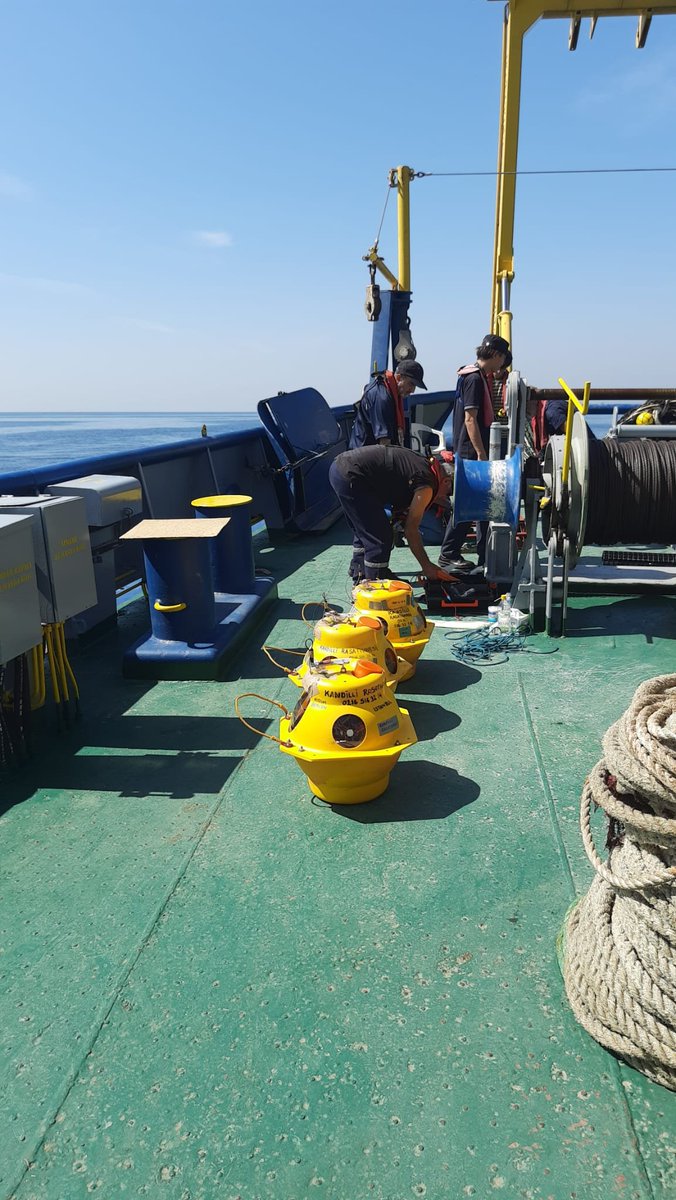
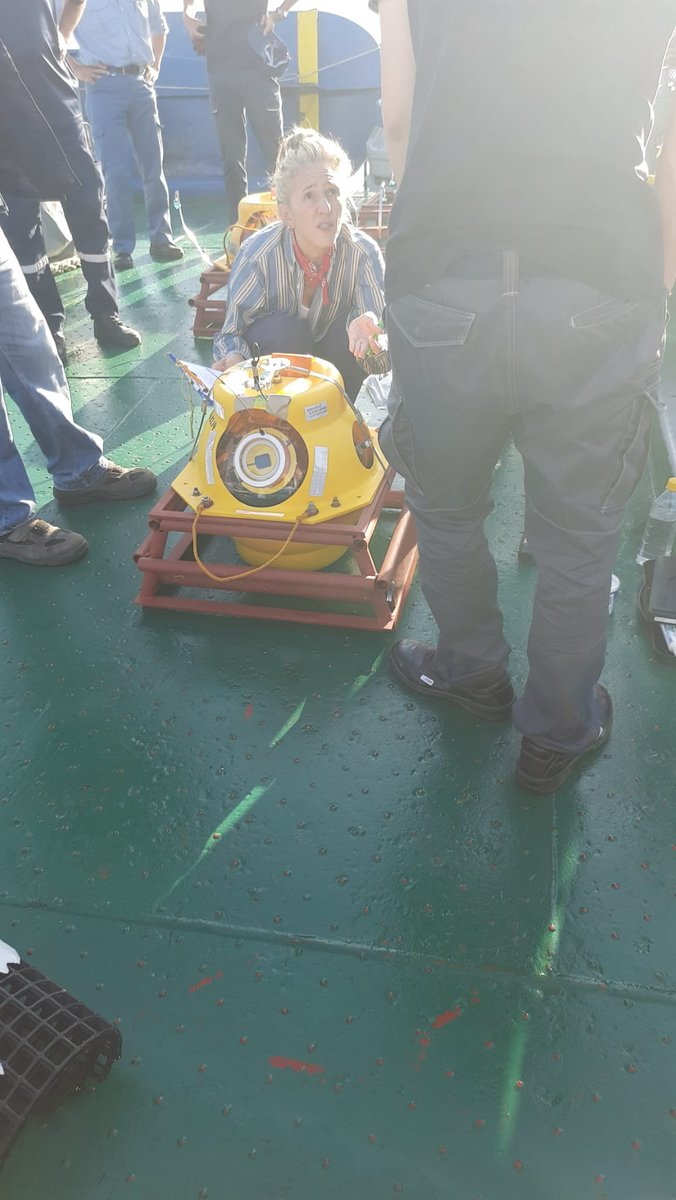
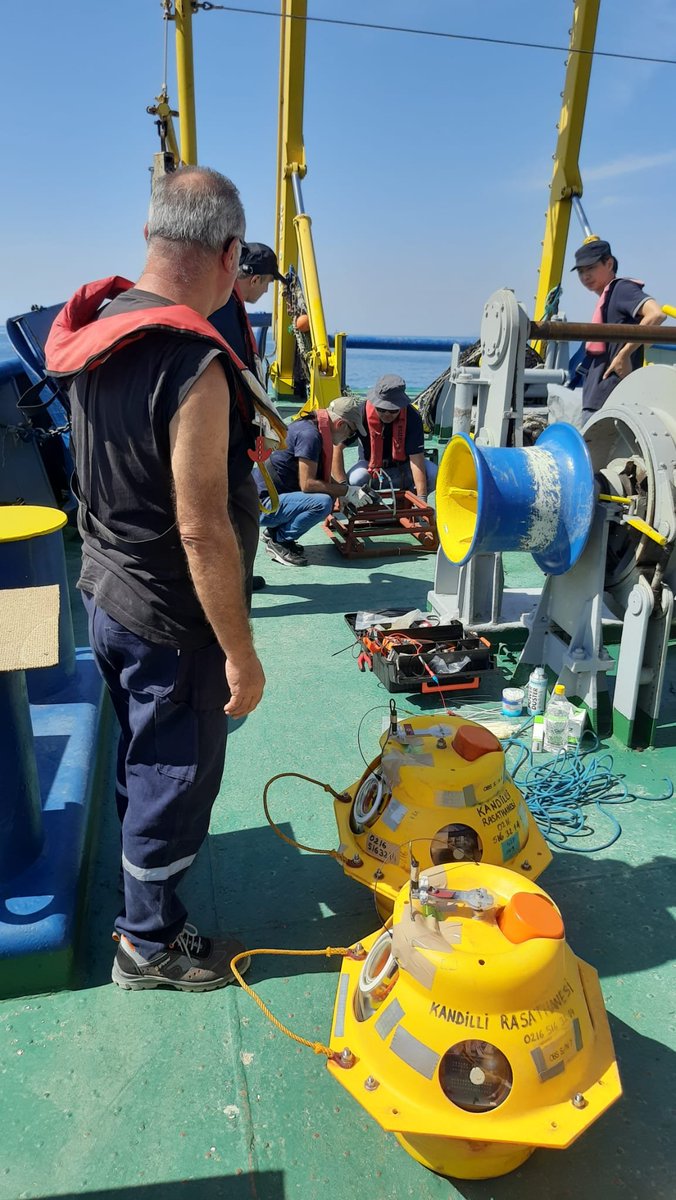
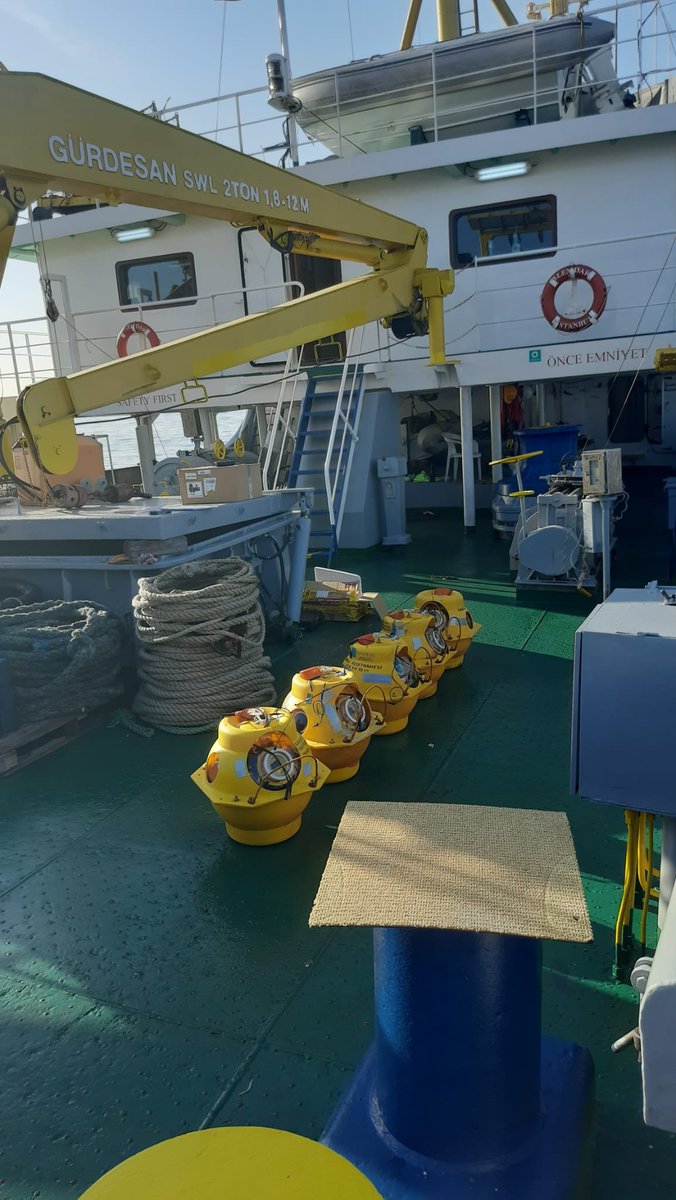
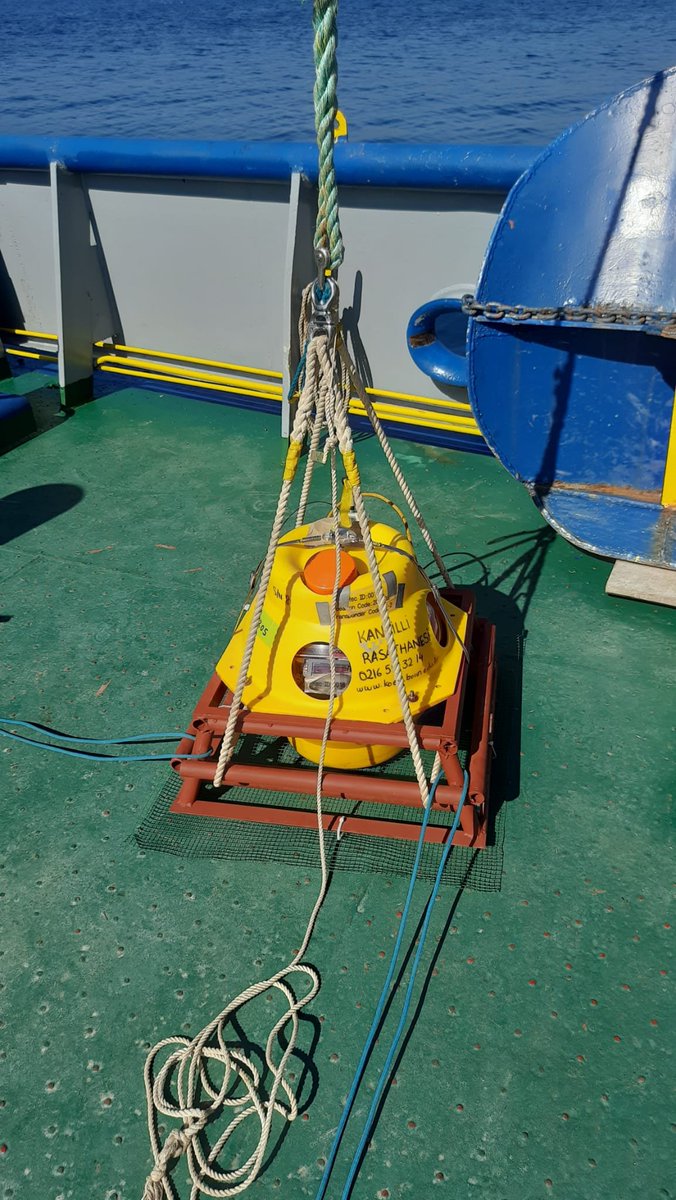
Marmara Denizi ' nin sismik hareketlerin takibini sağlayacak MARTEST OBS Extensometer Marmara Denizi tabanına yerleştiriyoruz. #rvalemdarII #bilimselbahriye
@gazioglu_cem
1
5
144
@istanbuledutr
@iu_debien
@Kandilli_info
@TUBITAK_MAM
Marmara Denizi ' nin sismik hareketlerin takibini sağlayacak MARTEST OBS Extensometer Marmara Denizi tabanına yerleştiriyoruz.
#rvalemdarII
#bilimselbahriye
@gazioglu_cem
2
3
86

8 Sep 2023
$PLTR Oyu Tolgoi and Rio Tinto partnership with Palantir Technologies to provide effective geotechnical risk management. 👇
@RioTinto (Rio Tinto) uses @PalantirTech Foundry for Oyu Tolgoi! 👀😯
Warning❗️it is a very long 🧵with a lot of information!
Oyu Tolgoi is jointly owned by the government of Mongolia, which has 34% ownership, and Rio Tinto, which owns 66%. Rio Tinto manages the operation on behalf of the owners.
At Oyu Tolgoi, Rio Tinto has partnered with Palantir Technologies, the enterprise software company, to support geotechnical risk management. This paper describes how effective geotechnical risk management practices are facilitated through a data-driven operations platform that connects data, analytics, and business teams to a common foundation. Through data integration, and a strong data foundation, Oyu Tolgoi engineers can monitor and act upon the mine’s aggregated data asset against their trigger action response plans and production data with cave management plan rules.
Data-driven cave monitoring workflows improve visibility into operations at the cave, support incident prevention, provide transparency for optimal collaboration between geotechnical and production engineers and inform decisions on cave construction sequencing and draw strategy. This amounts to a new and stronger footing from which to provide effective geotechnical risk management.
@PalantirTech Foundry platform at Oyu Tolgoi:
Oyu Tolgoi’s operations are supported by Palantir’s Foundry platform to remove the friction between back-end data management and front-end data analysis.
The front-end tools have allowed users to tap into the power of Oyu Tolgoi’s data. By using:
- A central data foundation to drive collaboration and discovery across functions.
- A common ontology to turn a complex data landscape into an intelligible representation of the entire organisation.
- Datasets and analyses that feedback into the platform to allow users to build on one another's work.
- Legible data lineage to connect insights to the data and logic that feed them.
- Diverse analytical tooling to supercharge traditionally non-technical functions and accelerate advanced analytical initiatives.
On the back-end, a suite of best-in-class capabilities for data integration runs on data and business logic in tandem. This involves:
- Versioning semantics to keep data and business logic in sync.
- Dynamic, systemwide security and access control to replace unreliable one-off policies.
- Branching of code, analyses, and reports to enable safe experimentation.
- A microservice architecture that constantly incorporates new technologies.
- Open APIs and data formats to interoperate with an organisation’s entire data ecosystem.
- Flexible data protection frameworks to keep up with evolving regulations (such as the General Data Protection Regulation) and industry best practices.
Data connection and data integration capabilities:
Foundry provides tools for connecting to and interacting with virtually any type of third-party system, regardless of the scale, structure or schema of the data exchanged. The platform’s graphical data integration interfaces allow both technical and non-technical users to bring data into the platform, as well as push it to external systems, as needed. These interfaces control ready-made connectors for industry-standard source types, such as SQL databases, external file-based systems, cloud-hosted databases and data streams. If required, the platform also supports using custom connectors for sources that are not supported out of the box. These ready-made and custom connectors ensured that Foundry slots into the Oyu Tolgoi information technology landscape with minimal disruption to existing systems and processes.
Data integration at Oyu Tolgoi:
Both production and geotechnical information are fed into Foundry by Oyu Tolgoi to provide the foundation for analysis and operational workflows. The data is ingested from many different source systems.
The following types of data are integrated into the platform:
- Geotechnical inspections: damage mappings.
- Instrument readings: convergence arrays, multipoint borehole extensometers (MPBXs), smart markers, cave trackers, open boreholes, time-domain reflectometers (TDRs), mobile scanning.
- Seismic events.
- Installed ground support design and rehabilitation work orders.
- Ground support quality control: shotcrete thickness, bolt pull tests, spacing and encapsulation.
- Development blasting quality control: overbreak and underbreak (percentage and volume), round length.
- Undercut information: design of the undercut level, ring position and statuses.
- Ring firing on the undercut level.
- Production mucking data (tons and buckets).
Data processing at Oyu Tolgoi:
Data quality, integrity, and transparency at Oyu Tolgoi:
As data quality and data integrity are the foundations for any data project, it is instrumental that data engineers are first empowered with the tools and transparency needed to build a quality data pipeline. Below, some of the unique tooling and capabilities of Palantir Foundry that help ensure data quality are highlighted.
Leveraging Foundry data lineage tools:
Understanding where the data has been and where it is going allows data engineers to trace potential data quality issues across the platform, ensuring verified data is available to every applicable team on the ground. For instance, what is the root source of the data? When was it updated? What transformations, filters, or enrichments have been made on this data? Exploring upstream inputs: Foundry allows data engineers and users at Oyu Tolgoi to trace back, investigate, and resolve data quality issues at their source. Oyu Tolgoi has an approach to integrate many different instrument types into a unified TARP and inspection process as discussed in more detail in Section 2. When a section of the mine was unexpectedly marked as ‘out of compliance with the required inspections’, data engineers were immediately able to look upstream at every parent dataset that fed in that transform, tracing every change and merge all the way back to the source. The engineers were able to inspect how the data has been transformed over time, providing critical debugging capabilities. Using these tools, they were then able to determine that convergence data had been incorrectly entered in meters rather than mm, resulting in a 1,000-fold change in the measured tunnel size. The data was then corrected at the source and a new data health check was added in the pipeline in Foundry. Tracking downstream effects: Engineers at Oyu Tolgoi use the same data lineage tooling to proactively trace where data quality issues may impact downstream artifacts. This has proved most useful when migrating between systems or carrying out major updates. This tooling has enabled these users to search along the pipeline for where there might be issues with how the data was prepared with code. Some common issues include exploding joins, dropping or filtering data prematurely, or missing data. The users can zero in on where in the pipeline this regression is introduced and remediate. Data lineage allows data engineers to proactively alert downstream consumers and fix the data flow before issues compound.
Ensuring the health of mine data asset:
Foundry automates checks designed to detect aberrations in the data – whether timeliness of data updates, completeness, consistency or even identify missing contents – to ensure robust data quality at scale. The pipelines can also listen for these checks and prevent the propagation of the data downstream if any of the checks fail. For instance, users can define a target data schema, such as the column names and expected content types, and establish validations that ensure that changes in the data model are flagged early. If validation fails, Foundry can trigger alerts for review and remediation. In addition to ingestion, Foundry also performs data pipeline health checks that trigger alerts all along the data pipeline. Some examples of data health checks include those listed below: data staleness, data shape, uniqueness, null percentage, and expected values. The geotechnical team at Oyu Tolgoi has 100s of data health checks spread thought out the data pipelines. In some areas of the mine, tunnel displacement is measured with tape extensometers. The tape extensometer data is stored in a database. When that data is ingested into Foundry a check is run to ensure that column names and data types match the expected values. Later in the data processing pipeline checks are run to ensure that the absolute displacement on any convergence array is less than -5 mm or more than 400 mm. There are checks in place to ensure that data remains fresh in the system and others which ensure that new data keeps being added. If any of these fail, then a member of the geoscience data management team is informed, at which point they will inspect the data and then take the matter up with the appropriate engineer or department. Having the data contently checked has led to a major reduction in false-positive TARP triggers and is improving the credibility of the geoscience team.
Security and permissioning at Oyu Tolgoi:
Data security is a central pillar of Foundry’s design. This allows all of the mine’s data and every action to be protected by industry-leading security tooling and governed in accordance with Rio Tinto’s cybersecurity policy. One of the primary divers for Oyu Tolgoi’s adoption of Foundry was security capabilities. These sit across every layer of the platform. As such, they govern all operations without exception. Oyu Tolgoi data administrators can configure security policies centrally instead of having to manage multiple policies across separate systems. This helps avoid both erroneous breaches and overprotection. Oyu Tolgoi protects its production and exploration grade data and drillhole information while still making it available to appropriate, approved, authorised staff. For example, production sampling data can be accessed via the platform by the scheduling and geology team who are carrying out reconciliation. The engineers and geologists can access and manipulate the data using the tooling within the platform however if they were to share their work with a 3rd party who lacked the correct access to any of the upstream datasets, the 3rd party would be unable to view the source data or the analyses. Seismic data is not as sensitive as grade but should still be handled with care and viewed in context as laid out in the seismic hazard management plan. If seismic data is not correctly interpreted and well explained, then an inaccurate impression could be gained regarding the risk to personal safety. This could be very concerning for the workforce in general, who for the most part are not seismic experts. As a result Oyu Tolgoi has access controls in place to ensure that only trained staff can access and use this data asset.
Data processing and representation/MPBX displacement contours:
The platform allows complex multi-dimensions operations to be carried out in a controlled, approved, repeatable and auditable fashion. Data from MPBXs is transformed to be represented as a set of displacement contours. These contours are made available in geojson format. The input dataset has a relatively coarse spacing at ~50 m between arrays. To produce smoother contours, the displacement is projected onto a much finer mesh grid. The transform described above is performed using grid data from Scipy (Virtanen et al. 2020) and contour from Matplotlib (Hunter 2007). The final stage of contouring is completed with QuadContourSet.
Lithology for level plans:
It is tempting to think that all spatial data in an underground mine should be viewed in 3D. The Oyu Tolgoi and Palantir teams have challenged this preconception. In some cases, viewing data in 3D clearly adds value. However, when many sets of data are combined and the data scale grows, performance becomes a consideration. There comes a tipping point between the advantage of 3D visualisation for allowing intuitive leaps based on complex multi-level relationships versus the speed and simplicity of a well-chosen section or level plan. Geological models of the Oyu Tolgoi orebody are maintained and updated by the geology team. The models are stored in Deswik MDM. To ensure that all plans and sections have up-to-date geology shown on them, the data feeds update this triangulation many times a shift and construct 2D polylines. This is powered by the python library Trimesh. The resulting polygons are then clipped against each other based on their stratigraphic order to remove any overlap.
Representation of damage mappings as polylines:
The damage mapping system used at Oyu Tolgoi provides measurements on a 1 m spacing, this results in over 100,000 data points if the whole mine is visualised at any given time. While visualising so many data points is not an impossible task, it is a challenge to maintain high performance and interactivity. Oyu Tolgoi significantly reduces the computational challenges by combining neighbouring points which share the same damage mapping values into polylines. This improves the performance of the application while maintaining the same granularity of information relayed to the end-user.
Geospatial grouping of monitoring data:
Oyu Tolgoi ontology in Foundry:
Combining production and geotechnical data:
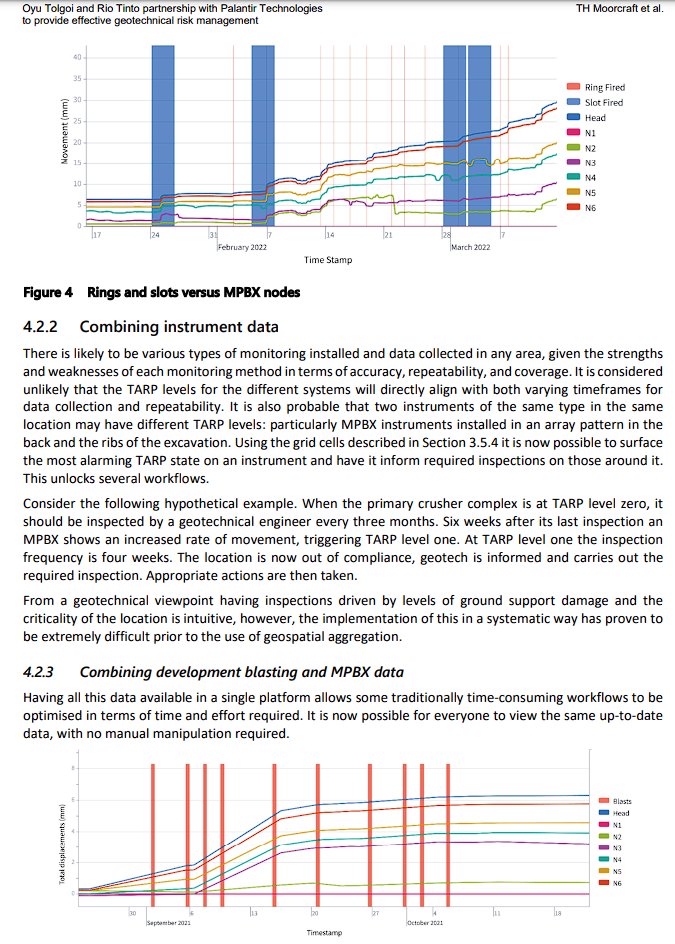
Figure 5 shows MPBX data taken from a location proximal to a newly open drawpoint. The dataset containing MPBX measurement is combined with the blasting date of the drawpoint. The impact of the blasting can be clearly seen at the MPBX when the data is viewed together. Prior to the use of the platform both the MPBX and blasting data would have to be exported and manipulated manually. This processing makes it very difficult to replicate the process and track the providence of the source data, ultimately reducing its value.
Data-driven operations and decision making/Effective risk management:
Oyu Tolgoi has increased the safety and assurance of the Oyu Tolgoi underground mine by implementing a proactive and an effective geotechnical risk management system. Geotechnical risk is measured using multiple metrics based on instrument readings from physical inspections and various sensor data, all of which are disparate and stored across various systems. By using Foundry, the engineers have a real-time risk picture of the mine to ensure all activities underground are tightly controlled and in compliance with safety standards that minimise the risk for workers and operations. A single interface (Figure 6) allows users to view production and geotechnical information in the same place. This enables subject matter experts to see the full picture in one environment, rather than having to jump between many different systems to understand what is occurring within the cave.
Inspection timing and uncertainty:
It is impractical for every location in the mine to be continually inspected. A matrix of ERR and TARP levels is used to determine which area prioritises inspection. Locations with low ERR and high TARP levels are being regularly inspected. The combination of three ERR and four TARP levels results in 12 different inspection regimes throughout the mine, with different scopes and cadence of inspection. Although this may seem complex, it is not significantly different to the traditional behaviour of the geotechnical team, where areas of damage or matters critical to operations would be inspected more frequently. It is important to prioritise risk management attention to different areas based on geotechnical risk. However, simple metrics like ‘days till out of compliance’ are not effective for cross-comparison across regimes, as there is a significant difference in the inspection frequency and purposes of inspection regime. For example, an ERR-1 location with a TARP value of two would require daily inspection, whilst an ERR-3 with a TARP of zero would only need to be inspected once a year. Instead, the Oyu Tolgoi team has developed the concept of uncertainty risk which prioritises and compares different locations with different ERR and TARP values. Uncertainty risk is a simple way to quantify the likelihood that conditions have changed since the data was collected. The scale of uncertainty ranges from zero to one. Uncertainty risk centres around the idea that the moment the inspection is carried out, there is no uncertainty (uncertainty = 0), and the measurement is still valid as time progresses. Then, the level of surety in that observation decreases. When the uncertainty reaches 0.8 it is considered out of compliance. This is deliberately not the value of one to allow for some differentiation in the levels of not compliant should readings not be taken at the required frequency. Once a task is out of compliance, uncertainty rapidly increases to one.
Cave management undercut monitoring:
Both cave initiation and cave propagation are crucial steps in the development of the mine. These processes also bear a significant risk to geotechnical safety if compliance targets are neglected, or sequence rules are breached. For example, excessive drawing can expose the underlying structures to the risk of air blasts. This can cause caving rocks to fall into insufficiently buffered drawpoints and lead to loss of machinery or fatal human injuries. Alternatively, blasting drawbells within the correct rate, but outside a planned sequence, can cause imbalances to the local caving process and equally result in dangerous cave instability. To coordinate these critical steps safely, the geotechnical and planning teams have laid out cave management rules and TARPs, which are based on research and risk models. These rules must therefore be followed, monitored and actioned in the case of non-compliance, and based on reliable and integrated information to support well-informed and speedy decision making.
The following rules are laid out in the Oyu Tolgoi undercut management plan and have been implemented in Foundry:
- Undercut advance time distribution: This rule is designed to control the number of rings blasted per drill drive over a specific time period.
- Undercut advance rate/distribution pre-drill drive per month (m/drill drive/month): This rule ensures that the total number of blast events per 30 days is controlled.
- Undercutting rate (sqm/month): Calculated as the total number of rings blasted in the last 30 days (moving window) across the full undercut level.
- Local lead/lag: This applies to the north edge of the cave. This is the maximum allowed lead/lag between two connected adjacent drives calculated from west to east.
- Instantaneous lead/lag: This applies to the southern face of the undercut. After the cave is connected there is a maximum of 30 days grace period to respect the prescribed lead/lag.
- Undercut length: Measures the linear distance between the two undercut cave front extremes from west to east.
- Undercut front direction: The undercut front direction rule controls the relationship between the maximum stress direction and the undercut front.
- Veranda length: This is measured from the most recently blasted drawpoint to the edge of the undercut.
The cave management application provides an overview of the current state of the cave. The application is available to both engineers on the ground as well as caving subject matter experts throughout the Rio Tinto group. It allows for timely identification of non-compliance to the cave management rules, empowers users to investigate root causes and then see the impact on the mine stability via instrumentation readings, as well as to act, all in the same place.
Conclusion:
The partnership between Oyu Tolgoi and Palantir Technologies is providing a solution that supports the teams in effectively managing geotechnical risk. By democratising data access, we make it easy for different subject matter experts to view and access the information they need. As a result of the collaboration, it is now possible for engineers to carry out complicated, auditable, and transparent transformations on mine data. Data governance components in place help ensure high quality of the data, traceability, security, appropriate permissions, and workflow stability. This has allowed Oyu Tolgoi engineers and geologists to collaborate more effectively, supporting more informed operations and data-driven decisions.
Source: papers.acg.uwa.edu.au/p/2205…
riotinto.com/en/operations/m…


1 Mar 2023

Our partnership with @RioTinto sees them use #Palantir Foundry as a single source of truth for turning insights into actions.
Learn more about how we’re enabling data-driven decision making across their critical mining operations: investors.palantir.com/news-…

1
14
44
7,573

13 Apr 2023
I feel like a proud “extensometer parent.” 😂
Obv I’ve gotta get a selfie with the newest fully functional extensometer in #California.
This device can precisely measure compaction of the aquifer system to a depth of nearly 1,300 feet. 👏
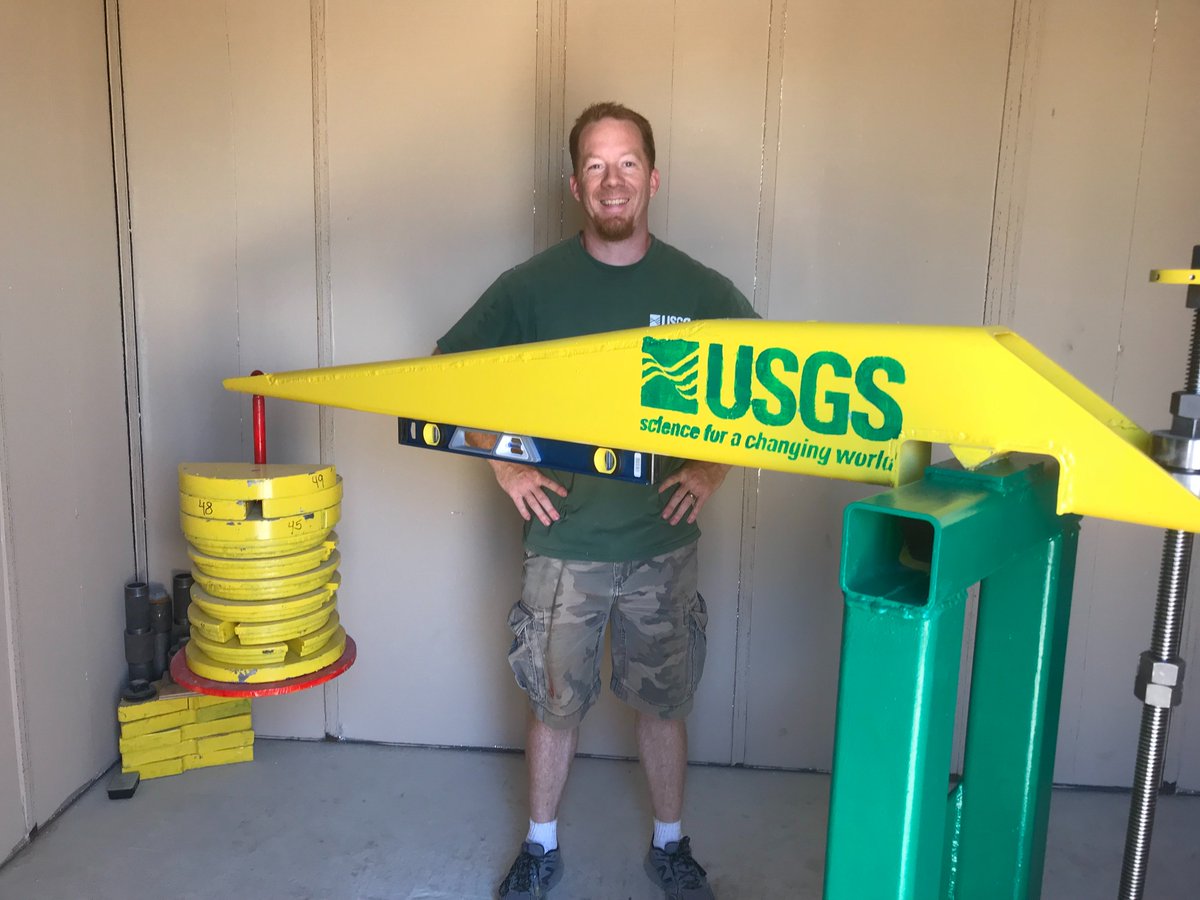
ALT Justin poses with the newest fully functional extensometer in California.
1
1
4
304
13 Apr 2023
It’s #ScrabbleDay!
What letter of the alphabet has lots of water?
The C
Jokes aside... here are some words to make your game flow!
Hydrodynamic – 27 points
Hydrograph – 23 points
Extensometer – 21 points (check out our #DITL post to learn more 😉)
Aquifer – 19 points
3
10
1,036