
Jun 12
📊 FUTURES FLOW – PSX SMART MONEY (FULL DAY)
🟢 TOP ACCUMULATION (Futures)
KOSM-JUN 5.25M (strong lead)
WAVES-JUN 3.44M
BOP-JUN 2.96M
DCL-JUN 2.51M
KEL-JUN 2.30M
PIBTL-JUN 1.80M
PAEL-JUN 1.60M
MLCF-JUN 1.43M
🔴 PRESSURE / EXIT NAMES
TPL-JUN -1.85M
TPLP-JUN -1.65M
BECO-JUN -1.20M
WTL-JUN -0.71M
TRG-JUN -0.16M
📌 FLOW READ:
• Futures mein aggression selective hai, broad participation nahi
• KOSM-JUN WAVES-JUN = clear momentum plays
• Some laggards (TPL, TPLP, WTL) heavy exit pressure mein
• BOP & PAEL both spot futures supportive — strong institutional alignment
⚖️ Overall:
Futures market is rotational — strong in pockets, weak in others. No full risk-on behavior yet.
#PSX #Futures #SmartMoney #FlowAnalysis
5
822
Jun 12
📊 FULL DAY FLOW – PSX Smart Money Snapshot
🟢 BUY SIDE LEADERS (Net Accumulation)
BOP 10.40M (clear standout)
FCCL 3.32M
YOUW 3.04M
PAEL 2.84M
PTC 1.76M
SSGC 1.20M
FFL 0.36M
MLCF ~flat (balanced flow)
🔴 SELL PRESSURE STOCKS
CNERGY -8.47M (heavy exit)
TPLRF1 -4.98M
KEL -4.24M
PIBTL -3.53M
📌 FLOW READ:
• BOP is the strongest accumulation story of the day
• PAEL FCCL showing clean institutional buying
• Energy (CNERGY) & some leasing counters under strong distribution
• KEL & TPLRF1 remain consistent sell pressure names
⚖️ Market is NOT broad buying — it is highly selective.
Smart money is rotating, not chasing everything.
#PSX #KSE100 #SmartMoney #FlowAnalysis
2
266

May 26
Gold flashing “bearish bias”, Silver printing aggressive OI spikes, and whale flow activity quietly building underneath the surface.
This is not a clean momentum market.
This is a positioning market.
When COMEX volume explodes far above the 20-day average while price action remains weak, it often signals defensive capital rotation, hedging, and smart money preparing for volatility.
Right now the game is patience, not prediction.
• Mixed signals
• High leverage environment
• Capital rotating defensively
• No clean directional confirmation yet
Most traders lose money trying to force trades here.
Disciplined traders wait for alignment.
That’s why DHEE tracks Regime Detection, Cross-Asset Flow, Whale Flow, ACEOS, StrataOS, and TradeSquad intelligence together
#Gold #Silver #Commodities #Trading #Markets #Macro #CapitalFlows #OrderFlow #WhaleFlow #SmartMoney #COMEX #OpenInterest #RiskManagement #Volatility #FuturesTrading #CryptoTrading #CrossAsset #TradingSignals #Quant #DHEE #TradeSquad #StrataOS #ACEOS #MarketStructure #Liquidity #FlowAnalysis #InstitutionalFlow #MacroTrading #dheeworld


1
1
2
323

Advance Your Flow Analysis Skills with In-Person Training
Whether you’re new to hydraulic and gas flow analysis or looking to sharpen your expertise, these in-person seminars offer hands-on instruction led by professional engineers.
Attendees gain practical techniques, software training, custom reference materials, and a certificate of completion, plus lunch, snacks, and a networking happy hour.
Reserve your spot and invest in your technical growth.
empoweringpumps.com/event/da… @appliedflowtech @Datacor #PumpIndustry #FlowAnalysis #ProfessionalDevelopment #Engineering #Manufacturing

1
2
45

Feb 13
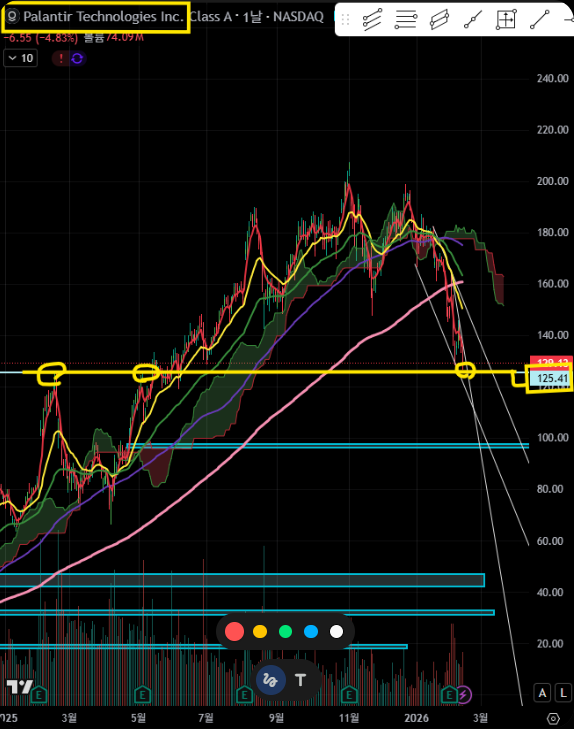
[Quant-Based Analysis of $PLTR]
Shifts in options market supply/demand dynamics and a breakdown of technical support are being observed simultaneously, warranting a conservative approach.
Downward Revision of Support Levels by Major Flows
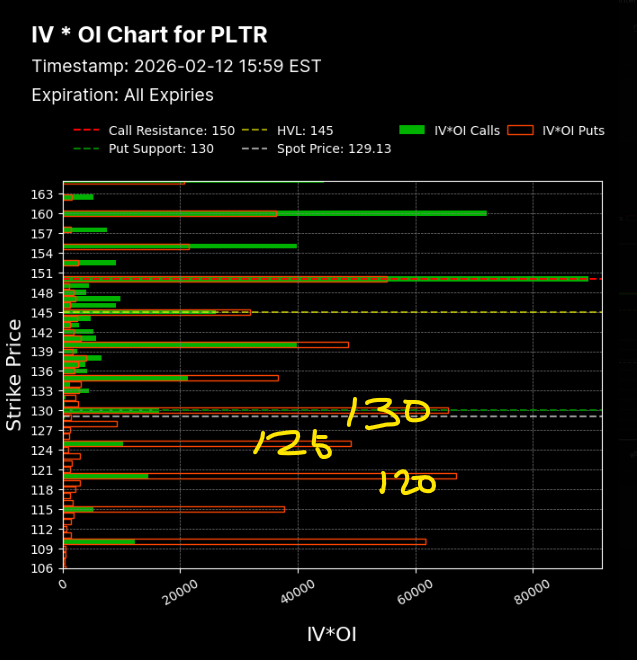
Analysis of the options market indicates a weakening of the $130 level, which previously served as a strong support zone. Notably, Negative GEX (Gamma Exposure) at the $125 strike price is recorded at -591.8K (-4.02%), suggesting that smart money is effectively lowering the support line from $130 to $125. (See Photo 1)
1. Breakdown of $130 and Macro Variables
Yesterday's close at $129.13 undercut the psychological and technical support level of $130. This indicates a potential flip where $130 no longer serves as a strong floor and may convert into resistance. Depending on the upcoming CPI (Consumer Price Index) results, if $130 is not reclaimed during pre-market trading, market gravity will likely accelerate downward toward $125.
Top 5 Volume Strikes:
S1: Put, 165 | 94.15K
S2: Put, 145 | 74.23K
S3: Put, 170 | 64.63K
S4: Put, 175 | 62.55K
S5: Put, 150 | 60.34K
TOP GEX STRIKE CHANGE
Positive:
S1: 130 | 535.2K (2.28%)
S2: 132 | 223.13K (8.73%)
S3: 134 | 172.6K (9.35%)
S4: 131 | 112.06K (4.24%)
S5: 140 | 31.35K (1.12%)
Negative:
S1: 125 | -591.8K (-4.02%)
S2: 135 | -511.5K (-22.86%)
S3: 128 | -475.4K (-3.78%)
S4: 120 | -301.14K (-2.66%)
S5: 133 | -280.7K (-11.42%)
2. Exclusion of Extreme Pessimism and Downside Rigidity
Analyzing the total options positioning, a crash to the $50 level (e.g., a Michael Burry scenario) suggested by some corners of the market is highly unlikely. Put option Open Interest is densely stacked at the $125, $120, $115, and $110 intervals (See Photo 2), suggesting that even if a correction occurs, it is likely to be a measured, step-down decline.
3. Absence of Relative Strength
The reason for not aggressively buying Palantir currently is its weak flow relative to the broader market. True market leaders tend to hold their ground or decline less when the S&P 500 falls. Currently, Palantir is moving in tandem with the market downturn or selling off even more sharply, making it premature to discuss a structural rebound.
Should market volatility expand due to a CPI shock, the $125 support level will likely be tested, and in a worst-case scenario, the downside could open up to the $120 line.
Therefore, rather than hastily buying the dip, it is a valid strategy to wait for confirmation of a reclaim of $130 post-CPI, or to adopt a scaled buying approach in the $125–$110 range.
📢 Disclaimer: This post is not a recommendation to buy or sell. Investment responsibilities lie solely with the individual, and all investments should be made carefully based on your own judgment.
$Palantir $PLTR $USStocks $StockAnalysis $TechnicalAnalysis $Options $Derivatives $GEX $Gamma $FlowAnalysis $CPI $Macro $Economy $InvestmentStrategy $Quant $DataAnalysis $Stockstagram $WealthManagement $AssetManagement $SPX
1
2
88

📈 Number of Trades tells a different story:
• The US Investment Bank jumps to #1 with 49%
• The Bulge Bracket Bank moves to #2 with 22%
• Other participants rotate, but all remain under 10%
Volume and activity don’t always align, and that’s the signal.
#TradingInsights #OptionsMarket #FlowAnalysis

1
4
112

22 Nov 2025
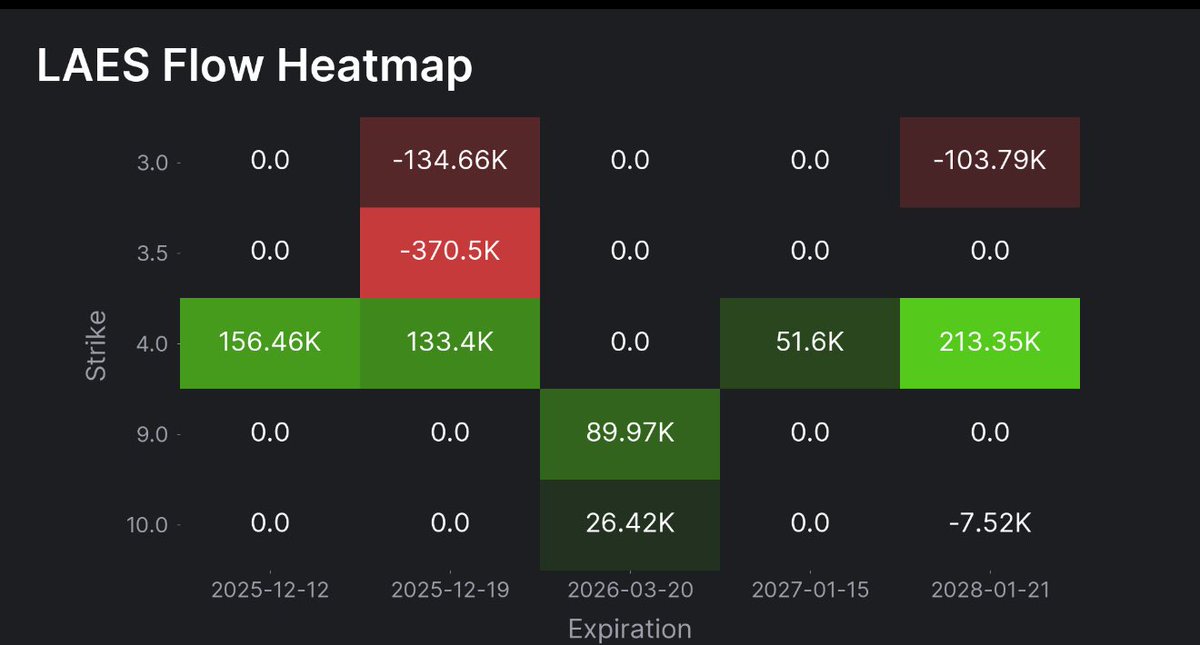
$LAES — Options Flow Update
Strong activity on LAES today:
🟩 Bullish flow concentrated on the $4 strike across multiple expirations (Dec 2025 → Jan 2028)
🟩 Notable long-dated call interest into 2026–2028
🟥 Bearish pressure mainly around the $3.0–3.5 strikes
Overall: flows lean bullish on higher strikes, while short-term positions still hedge downside.
#LAES #OptionsFlow #FlowAnalysis #Stocks
12
1,756

17 Nov 2025
Starknet’s latest surge looks powerful at first glance, but deeper flow signals coming through @EdgenTech reveal that STRK is moving inside a split-sentiment zone where conviction and caution are pulling in opposite directions. This isn’t a clean bullish expansion — it’s a fragile momentum wave shaped by profit-taking, retail aggression, and stealth accumulation happening at the same time.
♀️ Top Performers Are Exiting Aggressively
The biggest red flag right now is how quickly the Top PnL wallets are unloading.
These traders almost never exit without reason — they move early because they expect sharper volatility ahead or see better value at lower levels.
When the most profitable wallets rotate out, the market usually follows them, not the other way around.
📉 Spike In Fresh Wallets = Short-Term Energy
The sudden flood of new wallets looks exciting, but historically it signals something very different:
short-term participants chasing momentum rather than high-conviction holders building long-term positions.
That kind of flow burns bright, then disappears just as quickly.
🏦 Quiet Accumulation Behind The Curtain
At the same time, exchange outflows remain strong — meaning some entity is accumulating quietly in the background.
This is the part that keeps the setup from turning fully bearish.
Smart accumulation during a momentum wave often creates hidden support zones… but only if the trend stabilizes.
⚠️ A Split Market = Higher Risk
Right now both sides of the market are active
• confidence from hidden buyers
• caution from top performers reducing exposure
This creates a structurally unstable zone where sharp swings can happen in either direction.
Momentum alone won’t carry this — STRK needs cleaner confirmation.
🎯 Where The Safer Zone Sits
The lower support region is the key.
If the price cools and stabilizes there, the entire structure becomes healthier and long-bias entries make sense.
If support fails, the recent rally can unwind fast — faster than most participants expect.
If you want, I can map whale behavior next to pinpoint where real conviction is sitting.
@EdgenTech
#STRK #Starknet #ZK #FlowAnalysis #CryptoResearch
17 Nov 2025

Starknet is starting to move with a very different kind of momentum compared to the broader L2 market, and deeper ecosystem signals surfaced through @EdgenTech show that STRK is shifting from a sluggish, hesitant phase into something far more coordinated and conviction-driven. The price sitting around 0.232 may look modest on the surface, but the structural change underneath is what matters.
☣️ A Recovery That’s Finally Built On Substance
STRK has been rebuilding confidence after months of slowdown.
Over the past several days, developer activity has noticeably accelerated — Cairo experiments spiking, new tooling emerging, and ecosystem teams pushing updates with renewed cadence.
This isn’t hype driven noise. It’s the kind of foundational work that typically precedes multi-week expansions.
📈 Staking Launch Changed The Entire Token Dynamic
The biggest inflection came from Starknet’s native staking rollout.
This upgrade made Starknet the first major Ethereum Layer 2 to introduce validator staking directly on its own network.
The requirement of twenty thousand STRK per validator naturally locks supply, shifts behavior toward long term participation, and dampens short term flipping.
This is structural change, not narrative commentary.
💹 Price Structure Shows Real Liquidity
In the last twenty four hours, STRK pushed a two point seven six percent gain.
Over seven days, the chart shows a twenty six percent rebound from the 0.15 region — and importantly, the move is backed by real depth.
Daily volume around seven hundred eighty one million dollars indicates deep participation rather than low liquidity volatility.
Strong liquidity plus structural supply tightening rarely happen by accident.
🛠 Ecosystem Momentum Returning
The broader push is finally visible
new dApps going live
ZK tooling improvements
clearer communication from ecosystem teams
refined developer resources
After months of fragmented execution, Starknet looks focused again — a necessary shift if it wants to reclaim leadership in the zero-knowledge race.
📌 Short Term Look
Caution still makes sense after a move this sharp.
Profit taking is natural.
But as long as the 0.22 to 0.23 zone holds, the structure remains controlled and constructive.
That zone is where sentiment and positioning converge.
🎯 Strategic Read
Starknet is no longer drifting — it’s executing.
Staking changes supply.
Developer activity changes future demand.
High volume confirms alignment.
The combination is rare for an L2 during a cooldown phase.
If you want, I can also break down STRK smart money flows next or map it directly against OP and ARB for competitive positioning.
@EdgenTech
#STRK #Starknet #ZK #Layer2 #CryptoResearch
2
3
48

17 Nov 2025
Aptos is entering one of those quietly dangerous phases where the chart looks calm on the surface, but deeper positioning data coming through @EdgenTech shows that APT is moving under the weight of smart money expectation, not retail emotion. This is the type of environment where sentiment feels tense for a reason — the people who usually move early are already preparing for the next leg, and they’re not positioning for strength.
🔽 Smart Money Positioning Tells The Real Story
Across the past week, top performing traders — the ones who consistently post double and triple digit ROI — have been sitting on heavy unrealized gains from well timed shorts.
More importantly, they haven’t closed them.
When high conviction short positions stay open despite volatility, it signals one thing
they believe the trend still has room to the downside.
📉 Distribution Behavior Is Forming
Several of the most consistent performers have already begun scaling out or fully exiting exposure.
Moves like this are rarely random.
They tend to align with early distribution phases, where smart money offloads risk while retail still sees “sideways consolidation.”
Aptos has mirrored this pattern almost perfectly over the last seven days.
🔍 Large Wallet Shorts Still Deep In Profit
Some of the biggest and most sophisticated wallets are holding short positions that remain heavily profitable.
Until these unwind, upside attempts tend to get capped because every minor bounce becomes an opportunity for them to press or lock in gains.
This creates natural suppression on any recovery effort.
⚠️ This Is A Caution Setup, Not An Instant Collapse
Nothing here screams immediate breakdown, but the flow structure suggests the path of least resistance is still lower.
When top tier traders pull back and shorts stay open, the risk reward shifts dramatically.
Patience tends to outperform aggression in setups like this.
🎯 Strategy View
Waiting for a cleaner flow reversal or a meaningful shift in positioning is far safer than attempting to front run a bounce while smart money is still leaning short.
@EdgenTech
#APT #Aptos #FlowAnalysis #CryptoResearch #MarketOutlook
17 Nov 2025

⛎ Aptos is moving into one of those phases where the market looks quiet on the surface, but beneath it, large capital and narrative momentum are shifting fast — a setup that @EdgenTech has been flagging as early-cycle accumulation rather than simple volatility. This is the kind of backdrop where L1 rotations begin long before price reacts.
$APT is trading in the $2.86–$2.89 range today, slightly red, but the candle doesn’t tell the full story. Daily volume fluctuating between $136M and $296M shows that liquidity hasn’t left; it’s repositioning. Over the past week, APT dropped around 8% from its recent $3.16 swing high as the broader market cooled, but the liquidity profile stayed intact — a key signal for assets preparing for a larger structural move.
The standout development is the massive $545M stablecoin inflow onto Aptos within 24 hours. That rotation outpaced both Ethereum and Solana during the same window. Moves like this aren’t retail-driven. They are the fingerprints of large players positioning quietly, accumulating blockspace exposure before the next narrative ignition. It’s the same pattern we saw across multiple L1s in previous cycles: inflows first, candles later.
Aptos also crossed the $1.2B mark in real-world assets, boosted by BlackRock injecting $500M through its BUIDL fund. This is the new era of institutional onchain presence — capital that doesn’t move in and out with emotion, but reallocates with purpose. When TradFi pushes nine figures onto a specific chain, it usually signals a multi-year bet on the underlying infrastructure.
Then came the Bitwise filing for the first $APT ETF, instantly elevating Aptos into a rare category of L1s with a potential regulated investment product. This creates a gateway for traditional investors, asset managers, and passive index allocators to treat APT as a legitimate portfolio exposure, not just a speculative altcoin. Few L1s have reached this stage; the ones that do often rewrite their market ceilings.
Technically, APT lost the key $4.17 rectangle range weeks ago and has been grinding toward the downside target around $2.93. It’s now trading directly inside that expected stabilization band. This is where the market typically decides whether a floor forms or if traders are still waiting for confirmation. Price behavior here resembles early accumulation zones: compressed volatility, controlled liquidity, and heavy rotation under the surface.
Historically, APT only closes green on 48% of trading days. Volatility isn’t a bug — it’s part of the chain’s personality. Sharp swings are expected, and they often generate the best setups for asymmetric entries.
What matters now is determining whether the recent $545M inflow is genuine accumulation or short-term liquidity rotation. Holder distribution, exchange balances, and smart money flow will reveal that story quickly. If long-term wallets are absorbing supply quietly while stables continue flowing in, then this may be the beginning of Aptos’ next narrative wave.
$ETH $APT @EdgenTech
5
5
112

2 Nov 2025
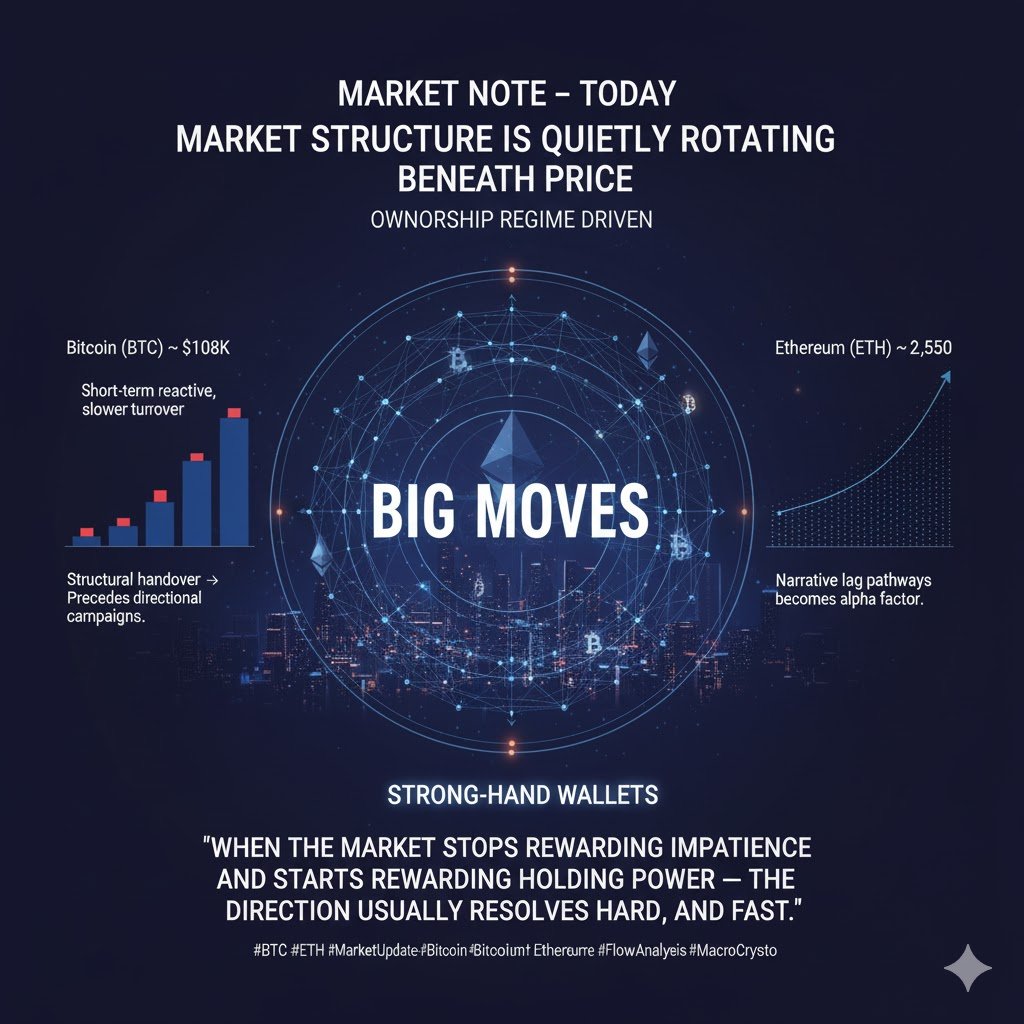
Market Note – Today: Market structure is quietly rotating beneath price
Price action is flat — but structure is not.
The shift right now is happening inside who is holding risk… not how much risk the market is taking.
Rotation inside strong-hand wallets → historically always happens before trend expansion.
Bitcoin $BTC around $108K is transitioning from short-term reactive wallets → longer duration, slower turnover participants.
This is the type of structural handover that normally precedes multi-week directional campaigns.
Ethereum $ETH near $2,550 is increasingly being accumulated through systematic pathways — not through event traders.
When ETH flows go systematic → that is usually the inflection where narrative lag becomes an alpha factor.
Read the market this week like this:
The next leg will not be “news driven”.
It will be ownership regime driven.
When the market stops rewarding impatience and starts rewarding holding power — the direction usually resolves hard, and fast.
This is one of those zones.
#BTC #ETH #Crypto #MarketUpdate #Bitcoin #Ethereum #MarketStructure #FlowAnalysis #MacroCrypto
@EdgenTech
1
2
31

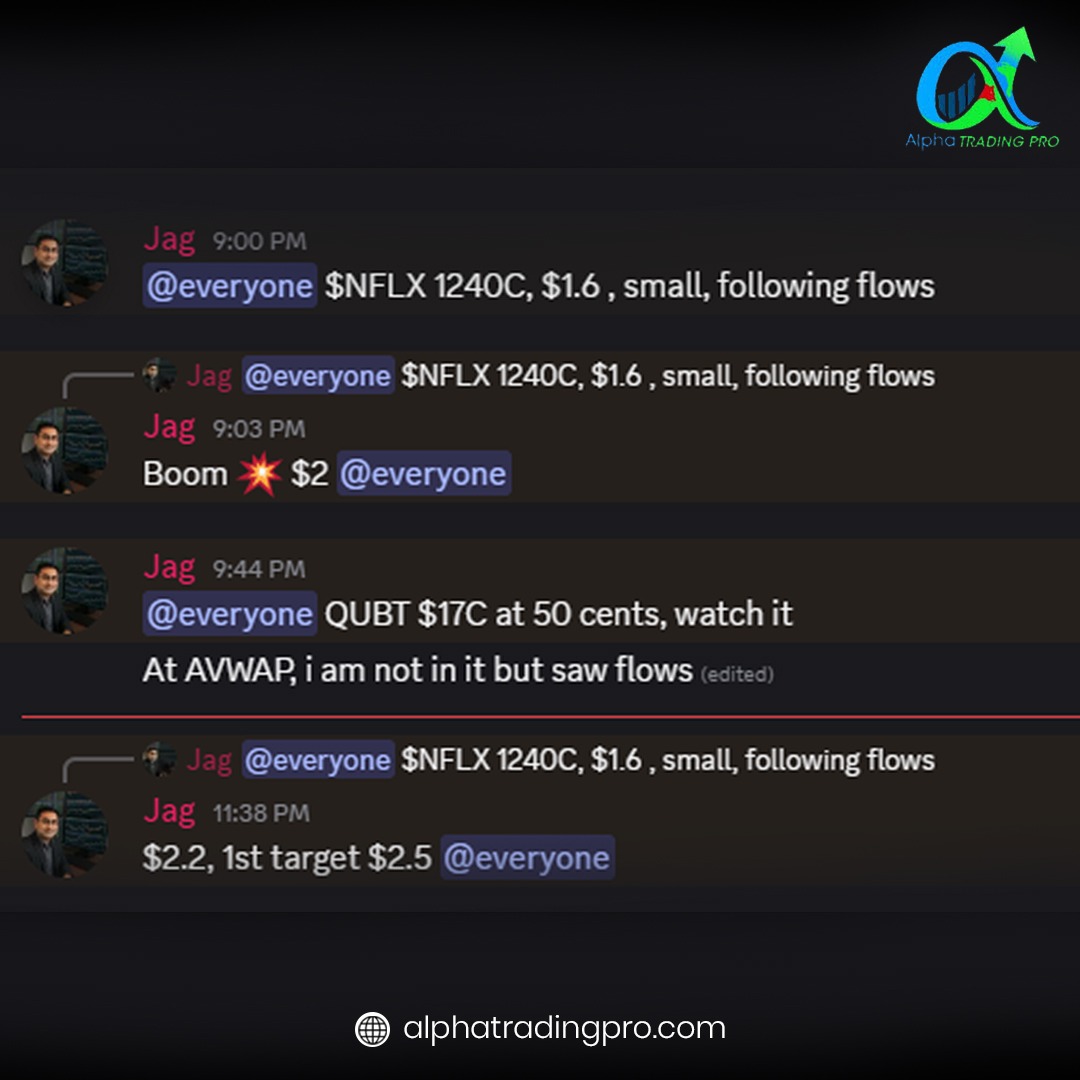
10 Jun 2025
Jag spotted the $NFLX 1240C flow and locked in a quick win—$1.60 ➝ $2.00 in minutes, then pushed toward $2.50. This is why real-time flow analysis matters. Missed this move? Get in on the next one with Alpha Trading Pro’s expert calls and live voice chat.
👉 Join now: alphatradingpro.com
#stockmarket #options #trading #daytrading #nflx #flowanalysis #tradealerts #tradingcommunity #alphatradingpro #profit #learntrading
9
169

29 Apr 2025
🇳🇱 NL🧠 De markt liegt niet. De flows vertellen je de waarheid.
📉 Kaarsen zijn slechts reacties.
📡 Gamma, dealers & flowstructuur sturen de richting.
🔹 $SPY Gamma Pressure
🔹 Kritieke levels vóór de move
🔹 Analyse zonder voorspellingen of hype.
🎯 Dit is geen mening. Dit is mechanica.
👇 Volg @TheMacroMentor voor structurele voorsprong.
#SPY #GammaFlow #Options #Trading #MacroMindset #0DTE #FlowAnalysis
1
1
60
28 Apr 2025
📊 Daily SPY Option Flow Analysis (0 DTE – Apr 28 Exp.)
English & Dutch breakdowns in the thread below 👇
👇 Follow @TheMacroMentor for daily macro market flow insights in English & Dutch.
#SPY #OptionsFlow #GammaSqueeze #0DTE #MarketMechanics #Trading #MacroMindset #Volatility #TechnicalAnalysis #FlowAnalysis
2
2
23,354

25 Apr 2025
Summary:
Market loaded with negative GEX → high swing potential. Watch for VIX > 30 and SPX < 5410 to trigger major moves.
#SPX #VIX #OptionsFlow #GEX #TradingPlan #0DTE #Volatility #GammaExposure #MenthorQ #DayTrading #SPY #MarketUpdate #FlowAnalysis
2
100

12 Mar 2025
$TSLA UPDATE - Data provided by @TradesNebula
March 12, 2025 | $246.71 | 7.03%
The mechanical underpinnings of Tesla's price action have completely inverted, transitioning from a structural collapse to an engineered recovery that most market participants are misinterpreting. What's truly driving this move isn't retail enthusiasm but a profound shift in institutional hedging requirements, forcing certain participants to aggressively reposition and creating a self-reinforcing feedback loop. The telltale signature appears in the volatility surface, where the previous extreme disparity between downside and upside protection has normalized almost entirely—the classic exhaustion-to-reversal pattern that often precedes substantial trend changes. This positioning stress has created an underlying support structure that strengthens at each technical level, with particularly potent mechanics developing above the $240 threshold where hedging flows convert from headwinds to tailwinds.
Price has methodically conquered each liquidity barrier we highlighted previously, slicing through the anticipated congestion zone at $233-235 before challenging the key battleground level where both position density and technical resistance converge ($245-247). The market's positioning fingerprint now displays the precise four-component alignment we identified as a high-probability recovery setup, with all critical hedging forces now rowing in the same direction. Our previous roadmap accurately forecasted this sequence: consolidation above $230, rapid acceleration through $233.76, normalization of protection demand, and the time-decay acceleration effect we're currently witnessing. The technical landscape confirms this positioning shift, with the oscillator measurement expanding from extreme compression to healthy momentum territory. The most significant resistance now materializes at the confluence zone between the psychological barrier ($250) and the midpoint recovery level ($251-253) where structural challenges typically emerge.
BULL CONFIRMATION SIGNALS:
Sideways consolidation rather than sharp retracement at current levels
- Protection demand continuing to rebalance toward equilibrium
- Directional exposure maintenance above the critical flip threshold
- Liquidity expansion with upside momentum (currently favorable at 51.34%)
- Dynamic average providing ascending support structure on weakness
#TSLA #MarketStructure #FlowAnalysis
Disclosure:For educational purposes only. Not investment advice. Analysis represents a mechanical interpretation of market positioning dynamics and technical patterns which may not continue. Past performance doesn't predict future results. Trading involves substantial risk. Probability assessments are subjective and shouldn't be the sole basis for trading decisions.
12 Mar 2025

$TSLA Data provided by @TradesNebula
March 11, 2025 | Current Price: $230.50 | 3.76%
$TSLA's violent selloff has created a mechanical bottoming process as dealer positioning shifts dramatically from aggressive selling to forced neutralization. The extreme positioning stress is evident in the extreme implied volatility divergence (puts at 382.44% vs calls at 165.95%), with downside protection demand reaching unsustainable levels that typically precede significant mean reversion. This exhaustion signature, combined with the balanced exposure that's now developing near the $230 level, creates a high-probability floor as hedging demands transition from reinforcing weakness to supporting stability. According to the Prometheus framework, we've entered a configuration with increasing potential energy—where further volatility contraction will force upward pressure through gamma-driven feedback loops.
The technical landscape now validates this mechanical recovery, with price respecting the critical 0.694 Fibonacci projection around $217 where significant volume has accumulated. The 30-minute consolidation above VWAP creates a launchpad for testing the crucial $233-235 resistance barrier. Our previous analysis correctly identified several key developments: 1) potential capitulation bottom forming (we projected around $220, actual low was ~$217), 2) RSI divergence with higher lows on price charts, 3) positive charm effect becoming influential, and 4) the overall stabilization above the $220 level (now at $230.50). What we underestimated was the speed of the positioning shift and the strength of the mechanical bottoming process that has now accelerated beyond our initial timeline projections.
BULLS SHOULD LOOK FOR:
Sustained trading above $230 with declining volatility
- Break above $233.76 resistance
- Call option skew normalization, which would strengthen the bullish positioning effect
- Charm effect accelerating as weekly options approach expiration
Price Targets & Invalidation
Primary Targets:
Immediate resistance: $233.76
Secondary target: $240-245 zone
Extended target: $250-255 area
Invalidation Points:
Breakdown below $220 support
Failure to hold above VWAP ($229)
Rejection at $233.76 with increasing volume
#TSLA #OptionsGreeks #StockMarket
Disclaimer:This analysis is for educational and informational purposes only and should not be considered financial advice. Options trading involves substantial risk of loss. The analysis represents a mechanical interpretation of dealer positioning and technical patterns based on historical relationships, which may not continue in the future. Past performance is not indicative of future results. All probability estimates are subjective and should not be solely relied upon for trading decisions. Always conduct your own research and consider consulting with a licensed financial professional before trading.

3
3,058

6 Feb 2025
45K contracts on $F March 9 puts at $0.17—smart hedge or easy premium? Options traders: The better question...are you selling for income, or buying for a cheap lotto ticket? Risk/reward depends on IV and directional bias. 📊📉 #OptionsTrading #FlowAnalysis
1
44

7 Mar 2024
Visualising and deconstructing processes to comprehend demand, capacity, and flow 🔄 #ImprovingFlowTogether #SHSC #FlowAnalysis
4
138

10 Jan 2024
We will be exhibiting at Arab Health 2024!
Arab Health 2024
Date and time: Jan 29 to Feb 1, 2024
Place: Dubai World Trade Centre
Booth: H8.C52
Hope to see you there!!
cfd.life/en/news/【ex…
#ArabHealth24 #Dubai #ArabHealth #WorldTradeCentre #4DFlow #FlowAnalysis

1
216

13 Jun 2023
Webinar: Flow Analysis Using Thermal Imaging
TOMORROW FROM 9:00 AM TO 11:00 AM >> qd-uki.co.uk/webinar-flow-an… @BSSMStrain #Thermography #webinar #FlowAnalysis #Aerodynamics
1
43

6 Jun 2023
Interoperability Between RFEM 6 and RWIND 2
ℹ bit.ly/34BCy1N
##rfem6#rwind#windsimulation#cfdanalysis#numericalwindtunnel#flowanalysis#cfdwindsimulation

1
2
119