
Bulk trucking contract rates: historically negotiated without a neutral benchmark. One side of the table always knew the market better.
SONAR just changed that.
Bulk contract rate benchmarks — outbound state-based pricing round trip rates — now available via API. First standardized data for a segment that's never had it.
Shippers. Carriers. Analysts. Logistics tech teams. This one's for all of you. Click here to request more info: pardot.gosonar.com/sonar-api…
Read more details on the release here: gosonar.com/freight-market-b…
#BulkFreight #FreightData #SONAR
5
7
366

22 Sep 2025
Catena Clearing (@CatenaClearing) raised $5M Seed (Floating Point, Shaper Capital, @PlugandPlayTC). @JBaksht, Travis May, and Mike Goynes are unifying #logisticsdata through a universal #API already connected to 300,000 vehicles. New funding deepens ELD/telematics integrations, insurer/broker use cases, and AI partners so clean #freightdata becomes standard plumbing.
Let’s keep the conversation going on LinkedIn: (linkedin.com/in/jesselandry2…)
Full rundowns live 👉 devcuration.com
#Startups #StartupFunding #EarlyStage #VentureCapital #SeedRound #AI #Freight #FreightTech #API #Telematics #Logistics #LogisticsTech #Data #DataDriven #Infrastructure #Technology #Innovation #TechEcosystem #StartupEcosystem
If software engineering peace of mind is what you crave, @ventionteams is your zen.
2
32

26 Aug 2025
Explore the world’s busiest shipping routes with Baltic Exchange’s interactive map. Track the routes that matter to your business!
Click here: ow.ly/O4qI50WAyrQ
#Shipping #GlobalTrade #FreightData #Maritime

2
3
414

14 Apr 2025
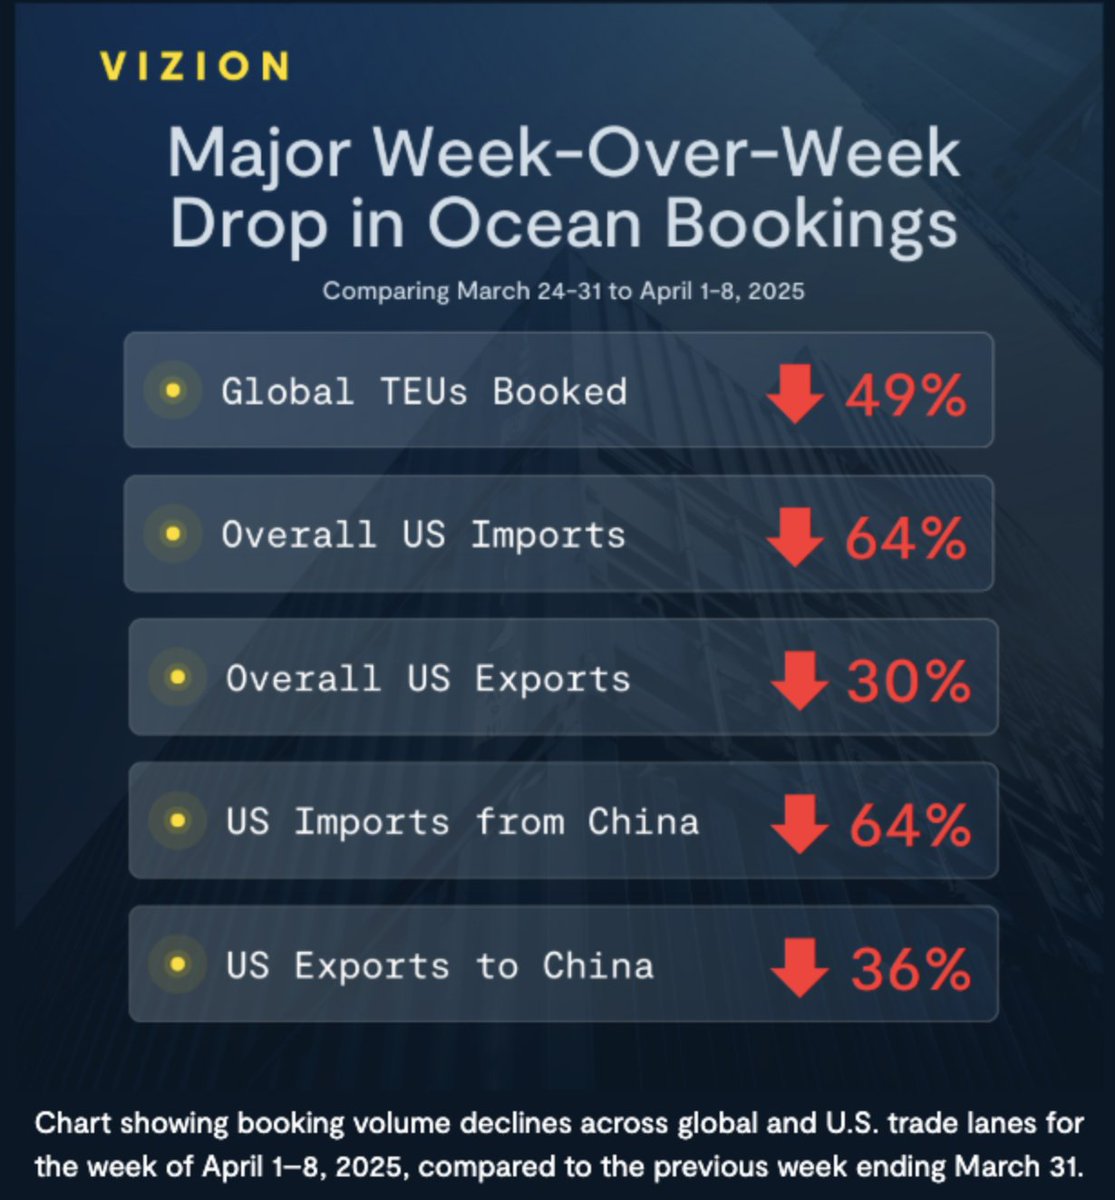
Załamanie w globalnych bookingach morskich to nie tylko nagły spadek liczby kontenerów – to echo strategicznego przesunięcia potęg.
49% tygodniowy spadek globalnych rezerwacji i 64% spadek importu USA to dane porażające, ale nie zaskakujące, jeśli śledzi się układanka, która od miesięcy była układana z wielu mikroelementów.
Na poziomie powierzchownym – mówimy o wojnie handlowej, która znów się rozgrywa między USA a Chinami. Ale w rzeczywistości to dużo głębszy proces – to demontaż ostatniego etapu globalizacji, której kluczowym spoiwem był płynny, niskokosztowy transport morski i względna stabilność walutowa. Tąpnięcie w kontenerach nie bierze się znikąd – to końcowy efekt wcześniejszych sekwencji politycznych i decyzji korporacyjnych, które mogliśmy wyłapać dzięki OSINT-owi i sourcingowi danych.
W marcu i kwietniu dane z systemów AIS (Automatic Identification System) wskazywały na nienaturalne spowolnienie statków kontenerowych na kluczowych szlakach, zwłaszcza między portami w Chinach (Shenzhen, Ningbo, Qingdao) a Zachodnim Wybrzeżem USA. Jednocześnie z danych sourcingowych – czyli bezpośrednich informacji od spedytorów, giełd frachtowych, a nawet lokalnych brokerów – można było zaobserwować rosnącą liczbę anulacji bookingów oraz przesuwanie terminów załadunków „na bliżej nieokreślony czas”.
Do tego dochodziły sygnały polityczne: wypowiedzi amerykańskich senatorów o „konieczności całkowitego uniezależnienia się od Chin” czy przecieki z Beijing Daily o planach „zamknięcia niektórych kanałów eksportowych dla produktów strategicznych”. Informacje te, choć często marginalizowane w mediach głównego nurtu, były wychwytywane przez analityków OSINT, którzy śledzą zarówno komunikaty rządowe, jak i ruchy giełdowe, aktywność portów i zmiany w zachowaniach dostawców.
Wszystkie te dane wskazywały, że globalny łańcuch logistyczny znajduje się na krawędzi – i że nie jest to już tylko kwestia kosztów transportu czy niedoborów kontenerów, ale raczej efekt narastającej polityzacji handlu. To, co kiedyś było tłem – taryfy, licencje eksportowe, embarga technologiczne – dziś staje się narzędziem uderzenia.
Z perspektywy analitycznej widzimy zatem model:
najpierw mikroreakcje (np. firmy wstrzymujące zamówienia na Q2),
potem polityczne napięcia (groźby taryf, ograniczenia eksportowe),
następnie fizyczne symptomy (wzrost pustych przebiegów kontenerowców, kumulacje na terminalach),
i wreszcie twarde dane – takie jak te opublikowane przez Vizion.
To, że USA i Chiny zanotowały synchronizowany spadek w wymianie – import z Chin w dół 64%, eksport do Chin w dół 36% – oznacza coś więcej niż chwilowe napięcie. To korekcyjna reakcja całego systemu, który sam zaczyna „cenzurować” handel na podstawie oceny ryzyka politycznego. To sygnał, że korporacje przestały ufać, że status quo zostanie utrzymane, i zaczęły budować alternatywne łańcuchy – od Meksyku po Indie, od Wietnamu po Europę Środkową.
Ale taki ruch kosztuje – zarówno czas, jak i pieniądze. Koszty transportu alternatywnego, brak infrastruktury przeładunkowej, niedobory siły roboczej – wszystko to przełoży się na wyższe ceny, opóźnienia i presję inflacyjną. Co więcej, zaburzenia w płynności dolara w Azji (bo mniej eksportu = mniej dolarów w obiegu lokalnym) już teraz wywierają presję na systemy walutowe – osłabiając m.in. juana, wzmocniając franka szwajcarskiego i powodując nerwowość w bankach centralnych.
Dlatego sourcing i OSINT nie są już dziś dodatkiem do klasycznej analityki – one są rdzeniem rozumienia współczesnego świata. Bez nich nie widzimy nadchodzących zmian, tylko próbujemy wyjaśniać to, co już się wydarzyło.
I właśnie dlatego warto o tym pisać, pokazywać wykresy, dekonstruować narracje medialne – bo żyjemy w czasach, w których logistyka, geopolityka i dane są jednym i tym samym językiem.
#TradeShock #OSINT #Sourcing #GlobalTrade #SupplyChainCrisis #Geopolitics #FreightData #ContainerShipping #ChinaUS #EconomicWarfare #Deglobalization #FXMarkets #TariffWar
2
3
21
2,251
20 Feb 2025
BCAA delivers:
🔹 Predictable freight costs
🔹 Stronger negotiations with benchmarks
🔹 Transparent pricing for less uncertainty
🔗ow.ly/C82r50UTWzr
#MarketEfficiency #ChemicalFreight #BalticExchange #FreightData
3
316

22 Dec 2024
📊 The Secret Weapon You’re Not Using: Real-Time Data Heatmaps
🚛 For Less Than $100/Month:
You can access real-time heatmaps that show:
⁃Where freight is moving (or not).
⁃Where carriers are oversaturated (or nonexistent).
⁃The most advantageous regions and lanes for your operation.
🔥 Why It Matters:
Brokers use this data to dominate the market by understanding freight movements across regions, not just individual lanes.
You can do the same by learning load board strategies and leveraging heatmaps to target your efforts.
💡 Your Next Steps:
1️⃣ Play around with the data on platforms like DAT or Truckstop.
2️⃣ Research online, watch YouTube tutorials, or DM me with your questions.
3️⃣ Use heatmaps to analyze trends over 6 months or a year and plan smarter routes.
👉 Your Turn:
⁃Are you using heatmaps to guide your decisions?
⁃What’s your biggest challenge in learning load board strategies?
Drop your thoughts below, I’m here to help!
🔗 Save this post to revisit as you dive into this game-changing tool.
#FreightData #HeatmapStrategy #TruckingInsights #LoadBoardTips #FreightTools
1
6
82
Don't forget to join us today at 2pm ET for the State of Freight webinar series!
Register with the link below:
bit.ly/4e04Kzk
#stateoffreight #webinar #freight #freightwebinar #freightdata #marketinsights
2
2
389
In our Q3 Freight Rate Report, we break down retail slowdowns, rising credit debt and a demand surge at the end of June, giving an informed view of current supply and demand trends for anyone looking to understand how they impact the broader economy. Click the link below to download the full report:
bit.ly/3ZunSkK
#financial #financialservices #marketinsights #freightdata #dataanalytics #supplychain
3
523
We’re officially kicking off this month’s State of Freight series with FreightWaves SONAR CEO and Founder, Craig Fuller, and Head of Freight Market Intelligence, Zach Strickland — featuring a live audience at the Chattanooga headquarters!
#chattanooga #chattanoogaevents #webinar #transportation #SONAR #freightdata
29 Aug 2024

The State of Freight: College Football Edition x.com/i/broadcasts/1BdGYEbab…
1
1
513
If you missed it last week, we took it to the sheets with our Product Marketing Manager, Ashley McAvoy, and Head of Freight Market Intelligence, Zach Strickland, to talk about the recent Excel Add-In to our toolbox – allowing users to analyze the SONAR data they need directly within Excel.
To watch the full recording, click the link below!
event.on24.com/wcc/r/4665799…
#freight #freightdata #excel #exceladdin #software #transportation #supplychain
3
1
315
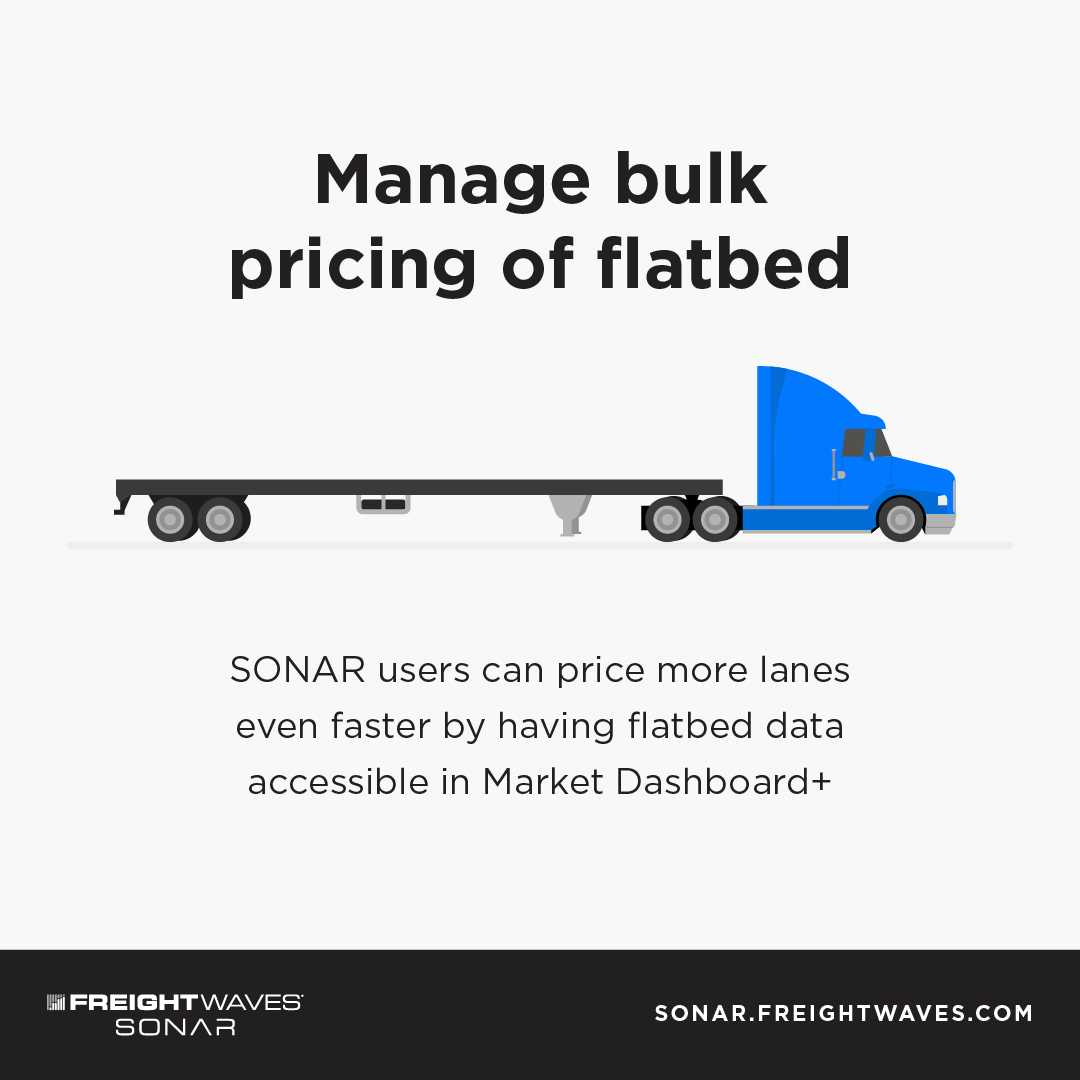
Looking for timely flatbed or freight data to use daily? Hit the link below to schedule a demo with us!
bit.ly/3PLbpn6
#flatbeddata #data #flatbed #trucking #transportation #freight #freightindustry #industrydata #freightblog #freightdata
1
1
246
Adding some heavyweight to the mix...
The Great Debate: SONAR vs DAT 💥😤
Register for the Future of Supply Chain by April 25th and receive $800 off!
#futureofsupplychain #supplychain #SONAR #freightdata #data #freightdebate

1
3
326
The market is beginning to turn, whether you feel it or not. Listen below as Zach Strickland, Head of Freight Market Intelligence, uses our Outbound Tender Rejection Index to highlight the shift.
#marketupdates #freightmarket #freightmarketintelligence #data #freightdata
4
1
8
1,049

27 Feb 2024
The American Transportation Research Institute (ATRI) is calling on motor carriers to contribute to its pivotal annual Operational Costs of Trucking report. As a cornerstone for benchmarking in the industry, ATRI's report analyzes data from carriers of all sizes to shed light on key financial trends, from driver pay to insurance premiums. This year, the focus is on 2023's operational costs, with submissions accepted via an easy online form or email.
Last year's findings revealed a sharp 21.3% increase in costs, crossing the $2 per mile threshold for the first time. Participating carriers not only contribute to a comprehensive industry overview but also receive a customized report comparing their operations against peers, offering valuable insights for strategic planning.
ATRI ensures the confidentiality of submitted data, aiming to empower carriers with actionable intelligence. Regardless of fleet size or association memberships, all carriers are encouraged to submit their data by April 26, playing a crucial role in shaping the future of trucking operational insights.
Full story on our Facebook Page.
We are dedicated to improving the lives of truckers by providing the information that directly affects their careers.
Follow us today!
#ATRIReport
#TruckingCosts
#OperationalCosts
#TruckingIndustry
#MotorCarriers
#FreightCosts
#TransportationResearch
#FleetManagement
#TruckDriverPay
#InsurancePremiums
#FuelCosts
#Logistics
#SupplyChain
#OwnerOperators
#FreightData
#CommercialTrucking
#TruckingTrends
#RoadFreight
#TransportationData
#EconomicImpactTrucking
3
53

23 Feb 2024
Shippers - Partnering with a third-party analytics provider gives context by augmenting that internal data with timely freight market intelligence from the broader market. Learn more here: bit.ly/3UBOyNY📊 🚚
#Shipper #FreightData #SupplyChain

1
2
305

27 Jun 2023
We're back tomorrow morning with our next podcast episode, but for now, get updates on freight and trucking market conditions - and the data behind them - with @datfreightteam's Dean Croke. Listen: hubs.li/Q01W09LB0 #podcasts #trucking #freightmarket #freightdata
2
2
254

19 May 2022
Step to the fore in building resilience and protect your bottom line by gaining end-to-end freight data visibility.
Read blog to know more: ow.ly/E5wk50Jamw1
.
.
#freightdata #EDI

20 Sep 2021
I will be presenting on using economic data to evaluate supply chain reliance on infrastructure at the @NASEMTRB Innovations in #FreightData Workshop TOMORROW! Excited to talk about some of the work we’ve been doing at @EBP_US to support long range planning!

There's still time to register! Get up-to-speed on the latest way to use traditional and emerging #FreightData sources, value-added features, and the integration of data sets at Innovations in Freight Data online Sept 21-23.
#DataSets
ow.ly/eDwP50GaxpM

ALT blur, chart, computer
2
2

10 Nov 2020
Regardless of what systems are in use, their value declines without enabling #freight #data sharing. #Supplychain leaders should seriously rethink their strategies, look to technologies to increase #freightdata sharing, and follow these steps.
buff.ly/2UcwzgD

3

28 Oct 2020
Learn why it is good to choose an auditing partner for digital audits?
bit.ly/3fRGFwN
#freightdata #transportation #supplychain #shipper #nvisionglobal
1