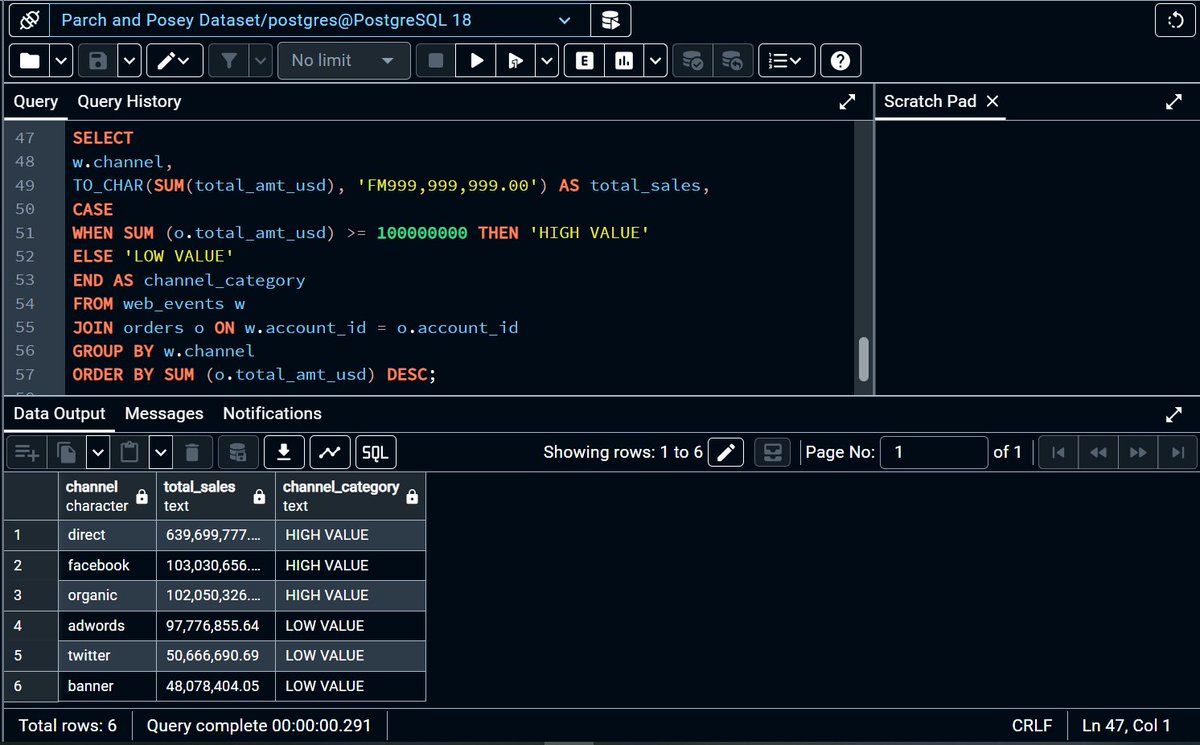
ALT PostgreSQL interface showing a query that segment sales channels into "High Value" and "Low Value" based on a $100M threshold.

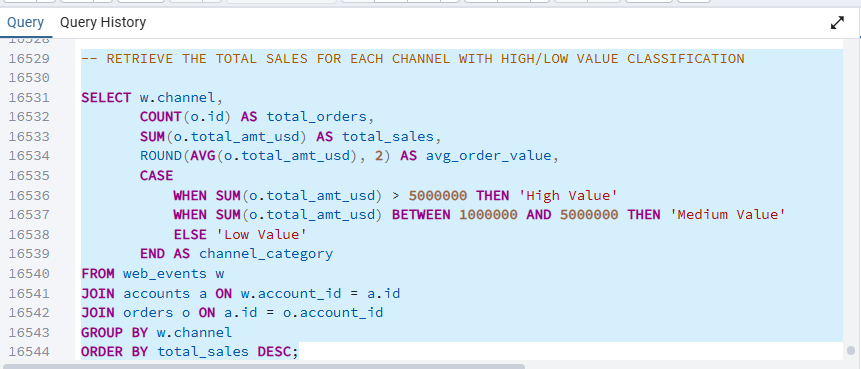
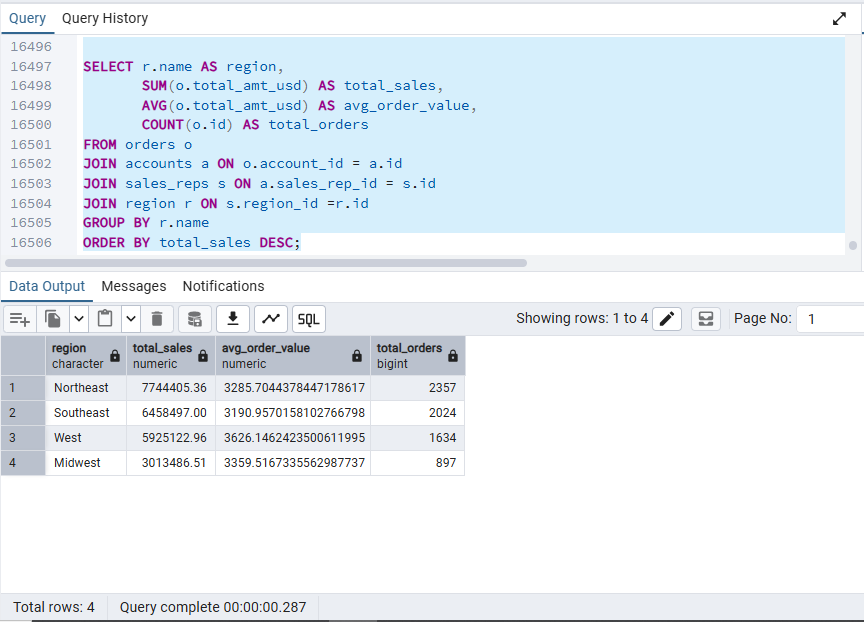
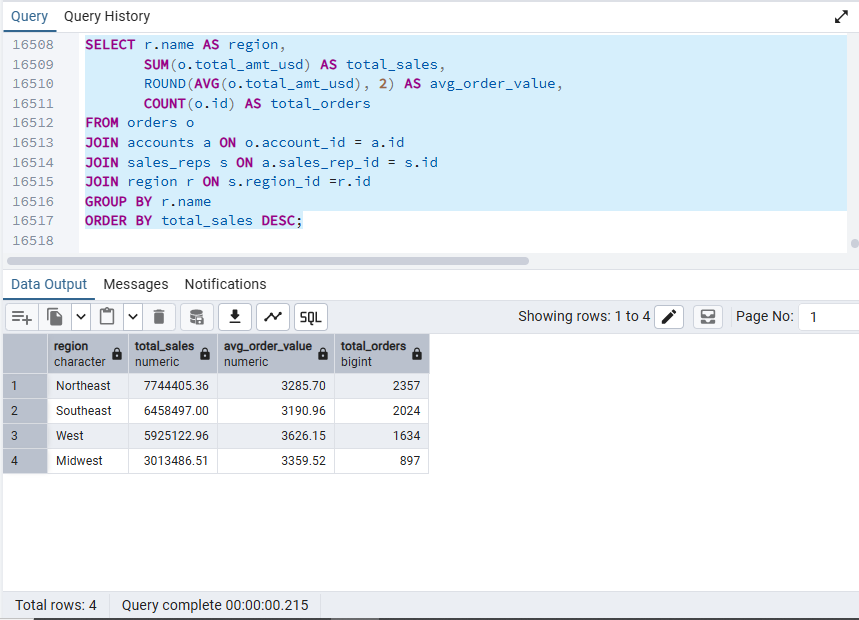
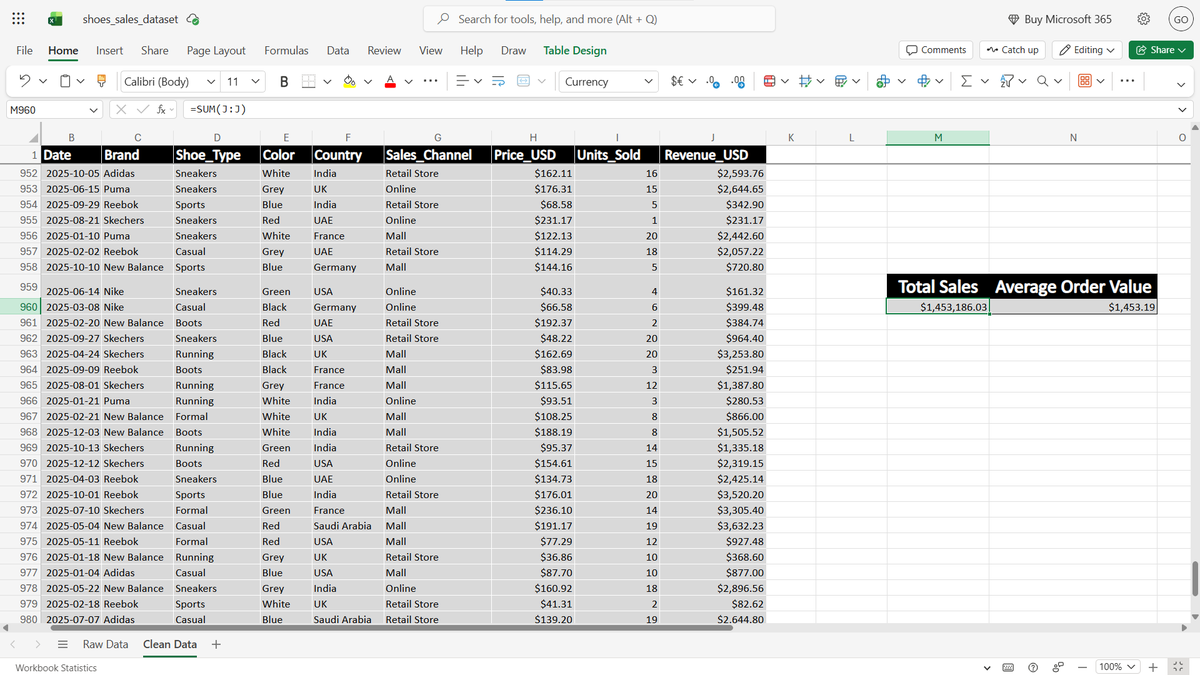
ALT SQL logic aggregating total sales and average order value across regions, using multi-table joins and currency formatting.
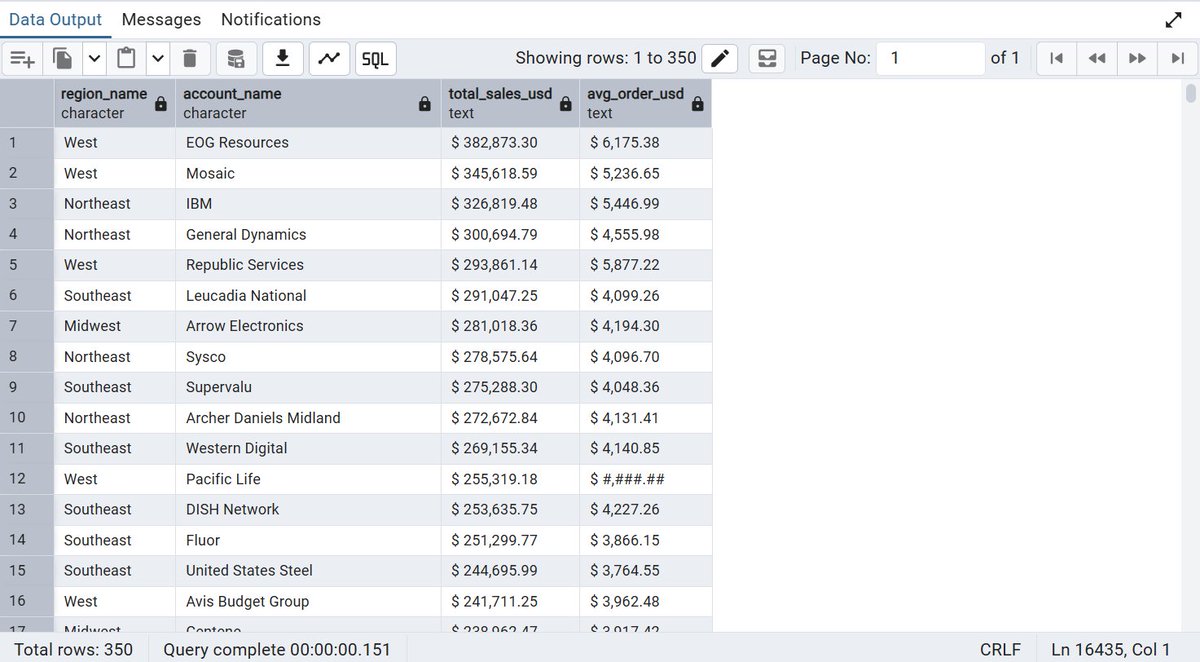
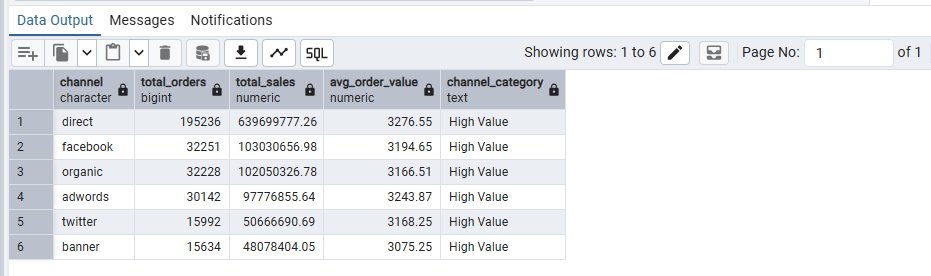
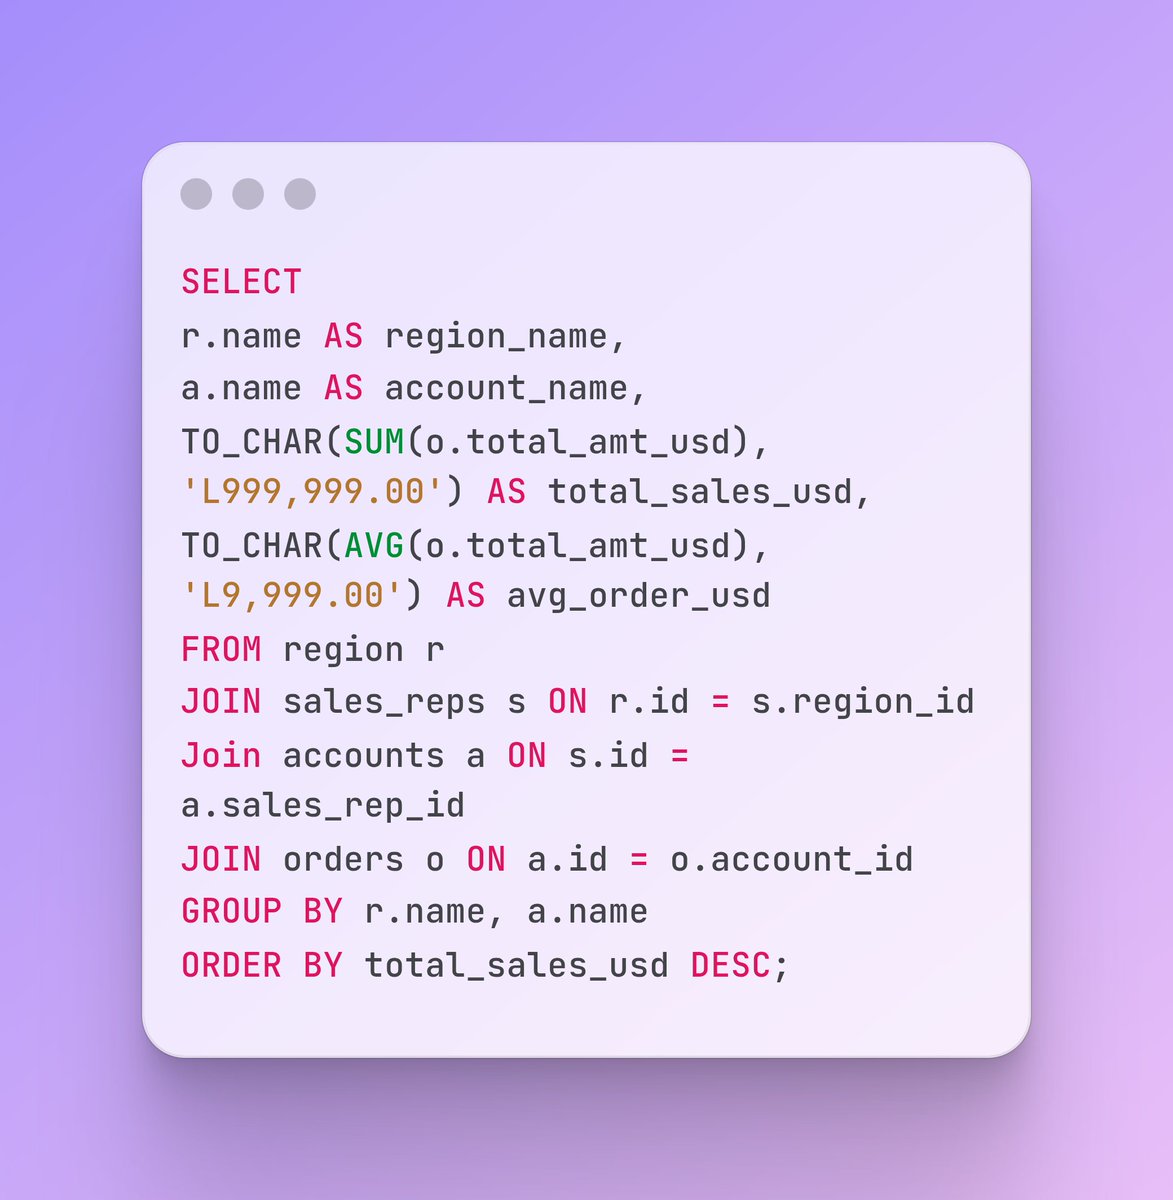
ALT A ranked performance table identifying top revenue-driving accounts like EOG Resources and IBM, sorted by total sales.
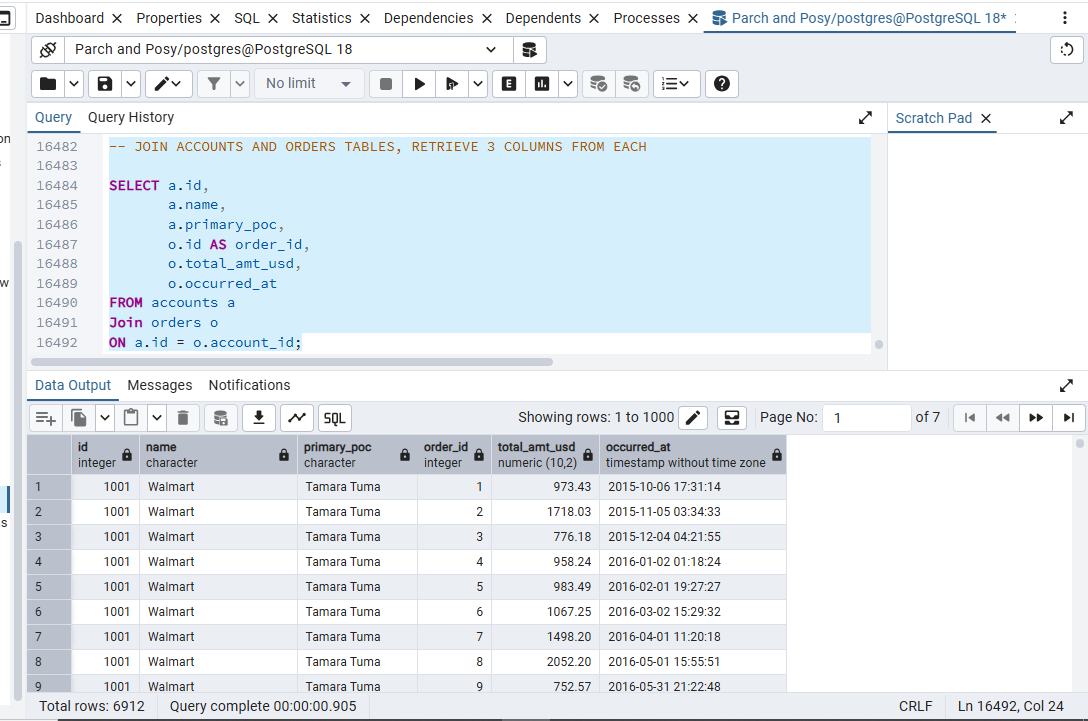

ALT PostgreSQL query results showing a successful INNER JOIN between client accounts and sales orders, transforming raw ID numbers into a clear map of customer revenue.

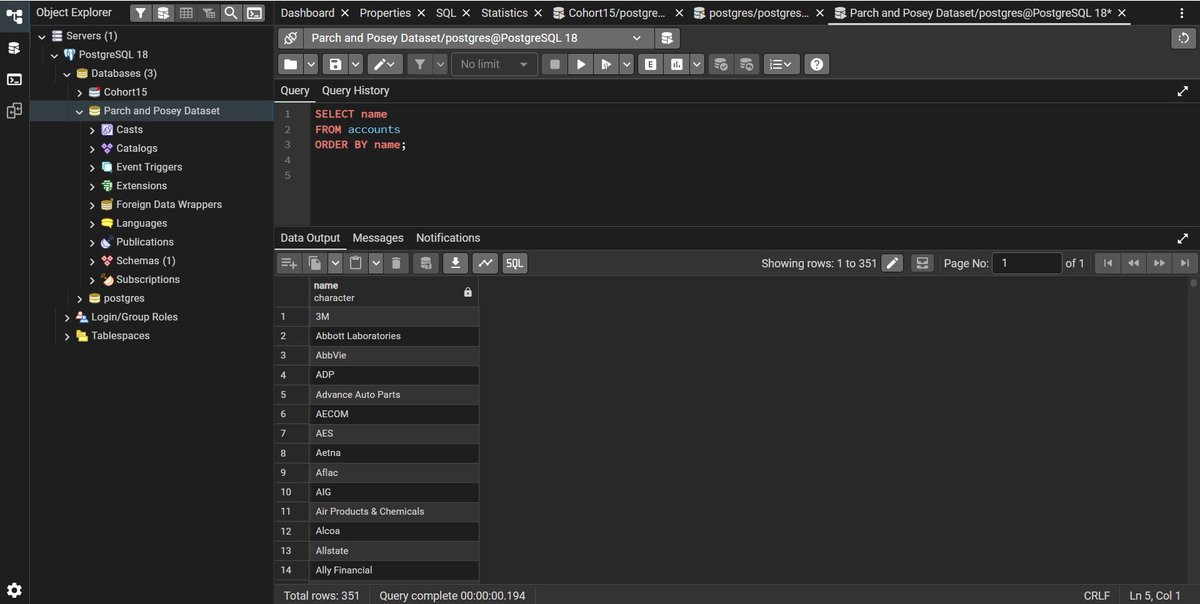
ALT PostgreSQL interface showing the use of the ORDER BY command to instantly organize 350 customer accounts for better searchability.


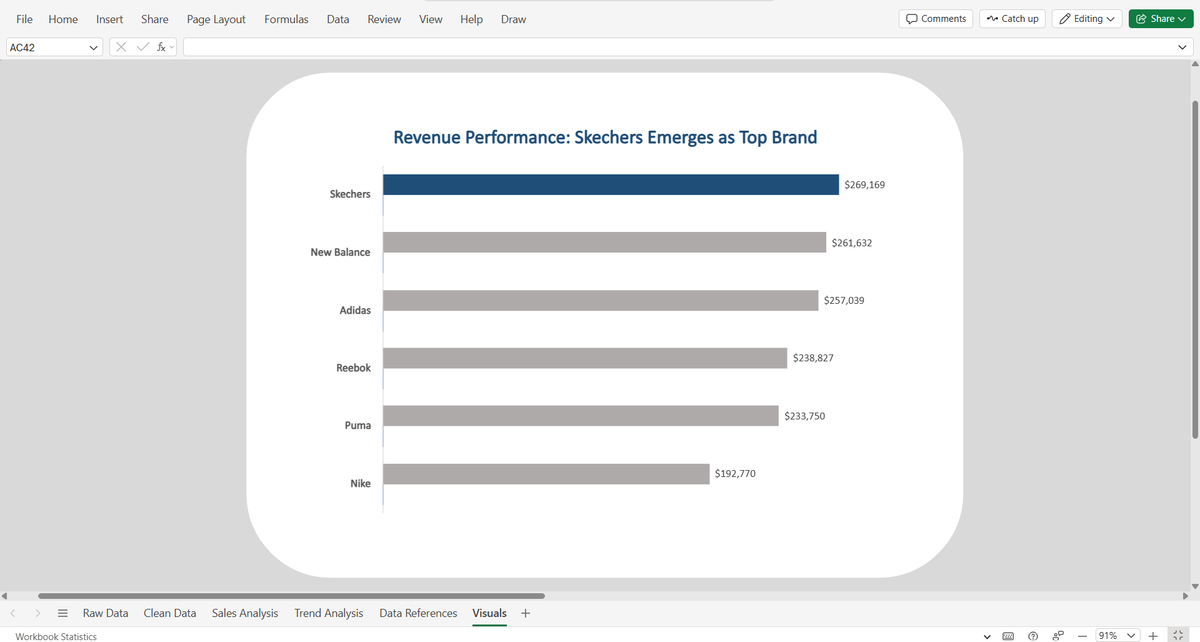
ALT Horizontal bar chart showing brand sales performance. Skechers is highlighted in blue as the top performer, significantly ahead of the other brands which are shown in neutral colors.


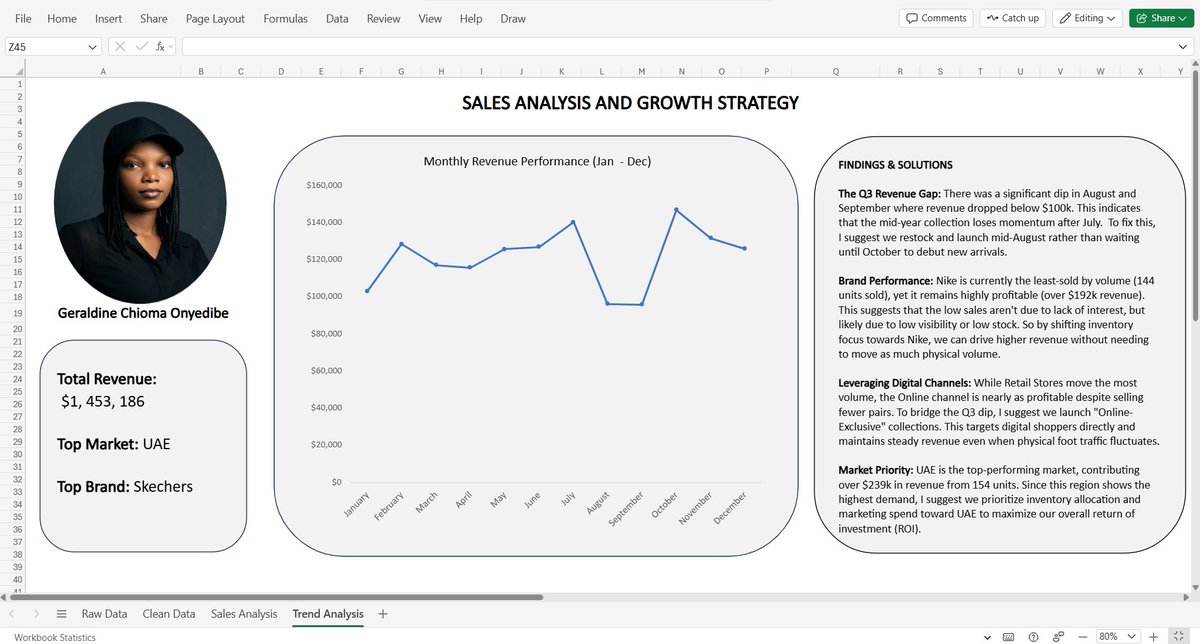
ALT Data visualization of sales analysis trend. Includes a "Findings and Solutions" section to aid business and growth strategy.
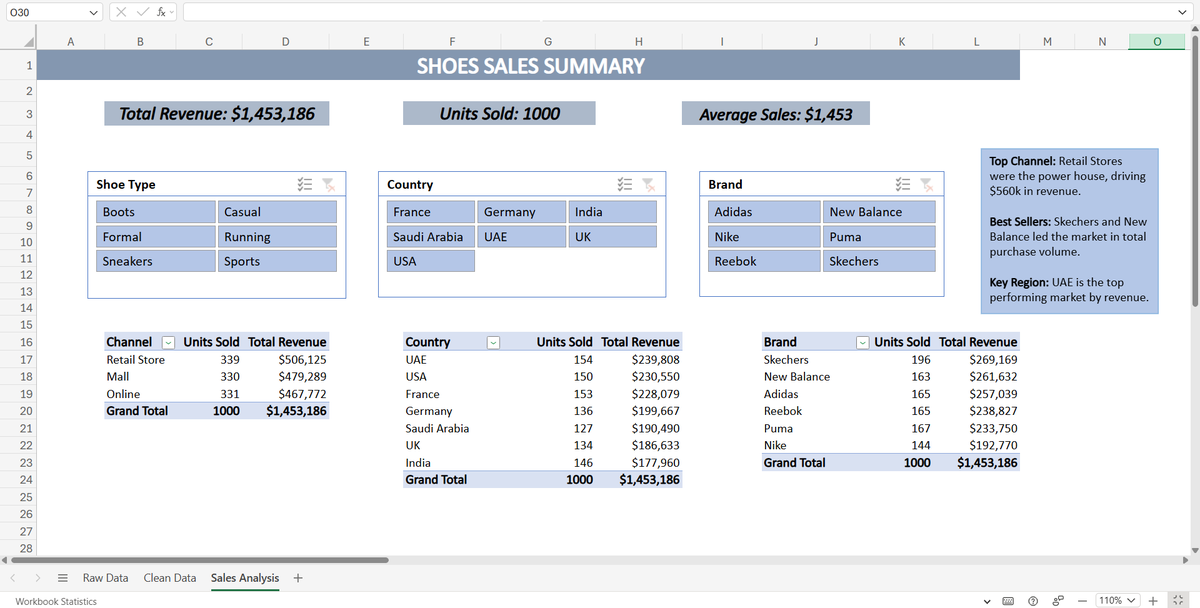
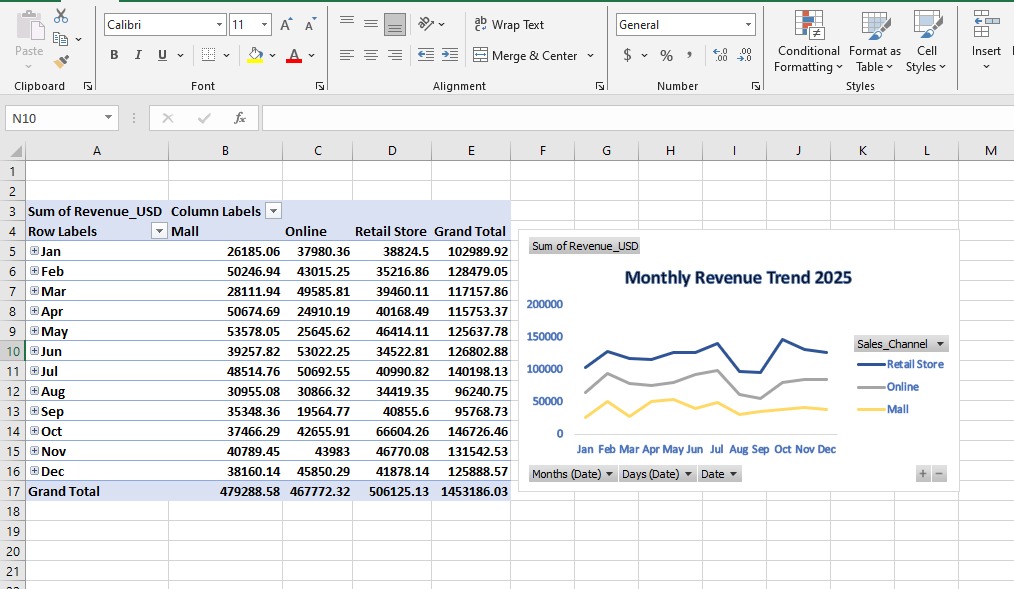
ALT A sales analysis dashboard showing three Pivot Tables summarizing Shoe Sales by Channel, Country, and Brand, displaying Revenue and Units Sold.
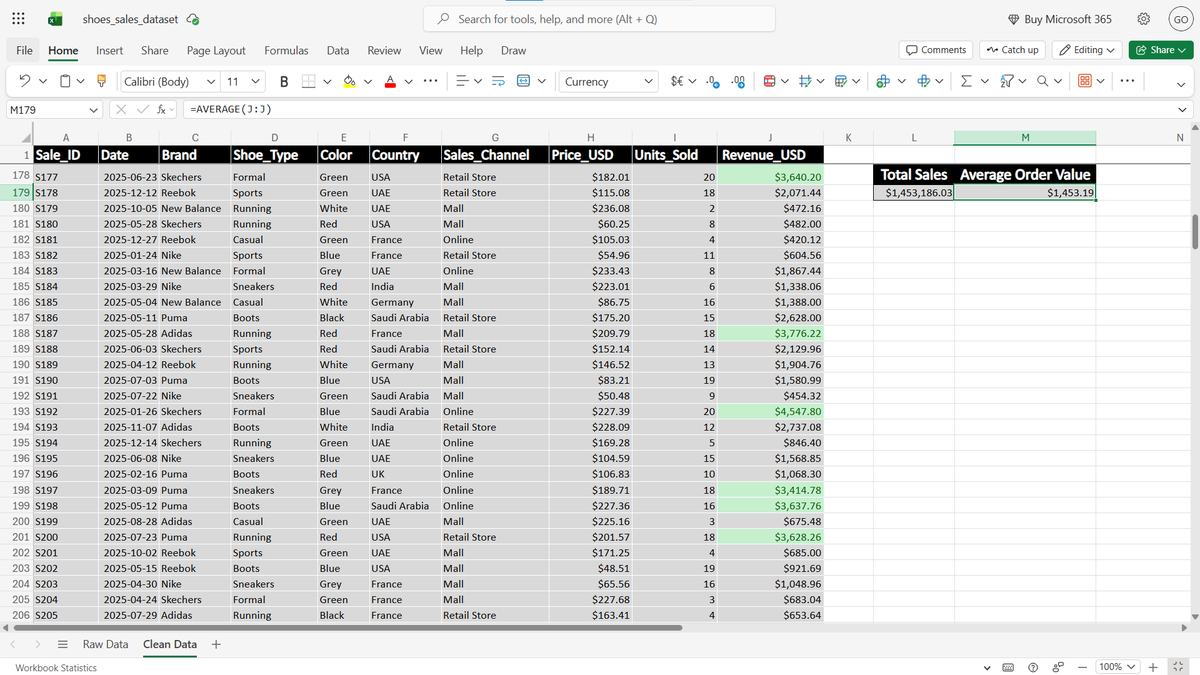
ALT Data visualization using Excel Conditional Formatting to highlight sales over 3,000USD, isolating the 120 highest-impact records from a total of 1,000 rows.