
3 Sep 2025
📊 Build smarter dashboards: OSHI provides low-level metrics for servers & apps. #JavaMonitoring
3
1,377
1 Sep 2025
🚀 CPU load, memory, disks, processes… OSHI gives Java apps real-time system insights. #JavaMonitoring
11
2,808
7 May 2025
💡 Pro tip: Combine Flight Recorder with JMC for powerful visualizations of thread states, GC behavior, and more. #JavaMonitoring
1
4
1,269

24 Sep 2024
🚀 Java Tip🚀
Java performance profiling with VisualVM. Analyze memory usage, CPU consumption, and thread behavior for optimizing your application.
visualvm.github.io
#Java #JavaMonitoring
8
69
2,545

21 Dec 2023
Troubleshoot applications without changing code! SREs & Infrastructure admins face challenges with limited source code access. Evaluate #Java monitoring capabilities with eG for quick root cause identification. Learn more: eginnovations.com/blog/is-yo… #JavaMonitoring #Observability
1
3
51
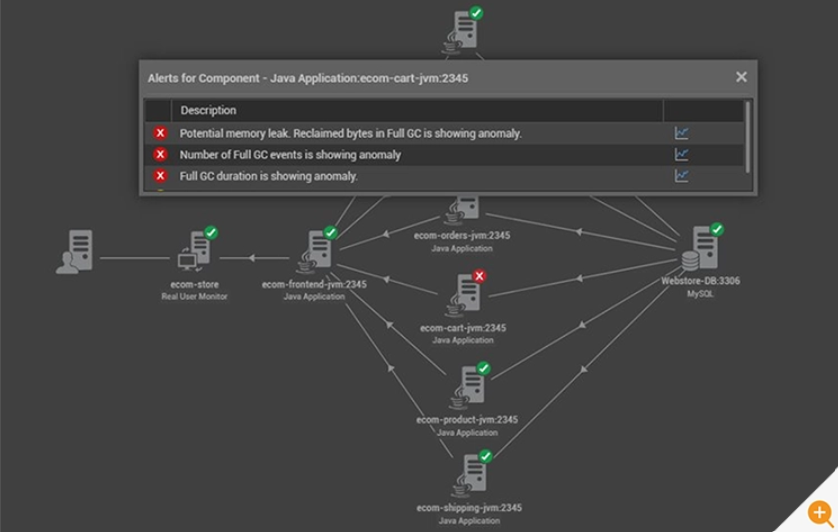
29 Nov 2023
Unlock the secrets of Java Application Monitoring! Read this insightful blog by Gokulanand N, exploring how IT Ops can diagnose memory leaks at scale and optimize Java application performance: eginnovations.com/blog/java-…. #JavaMonitoring #MemoryLeaks #ITOps #ApplicationPerformance
2
5
246
19 Nov 2023
🚀 Java Tip 🚀
Java performance profiling with VisualVM. Analyze memory usage, CPU consumption, and thread behavior for optimizing your application. 🔥
visualvm.github.io
#Java #JavaMonitoring
11
68
7,802

19 Oct 2020
Payara InSight is our improved real-time #monitoring console, released with Payara Platform Enterprise 5.22.0. An updated GUI allows you to easily tailor the metrics you track, change layout, and customize alerts. hubs.ly/H0y7Hhk0 #enterprisemonitoring #Javamonitoring

1
3
15 Jun 2020
Want to enhance your Java applications' performance?
Is synchronizing static variables unknowingly a common mistake made by Java programmers? Don't miss 6 simple tips! Check out @egInnovations’ latest blog: hubs.ly/H0rv6K-0
#Javamonitoring #APM #Javatips #Javadevelopers
3
3

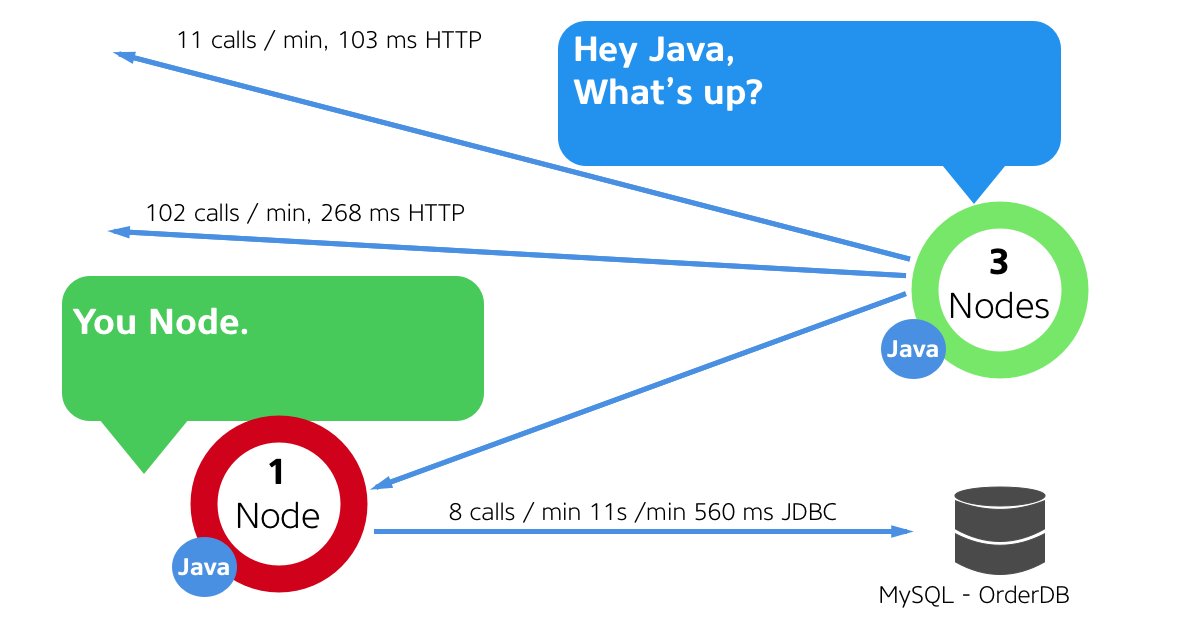
25 Oct 2018
Ward off unwanted #java issues with #javamonitoring by @AppDynamics. Learn about #apm for #java and see what these nodes are talking about.
bit.ly/2PkK3WN
#TalkingNodes #Java #Halloween #TechHumor #programming #Developer #code #CloudComputing #DigitalTransformation

3
3

5 Oct 2018
See what these nodes are talking about and learn what is up with #java. Learn more about #Javamonitoring. bit.ly/2Ru6mYn #TalkingNodes #TechHumor
2
2