
22 May 2023
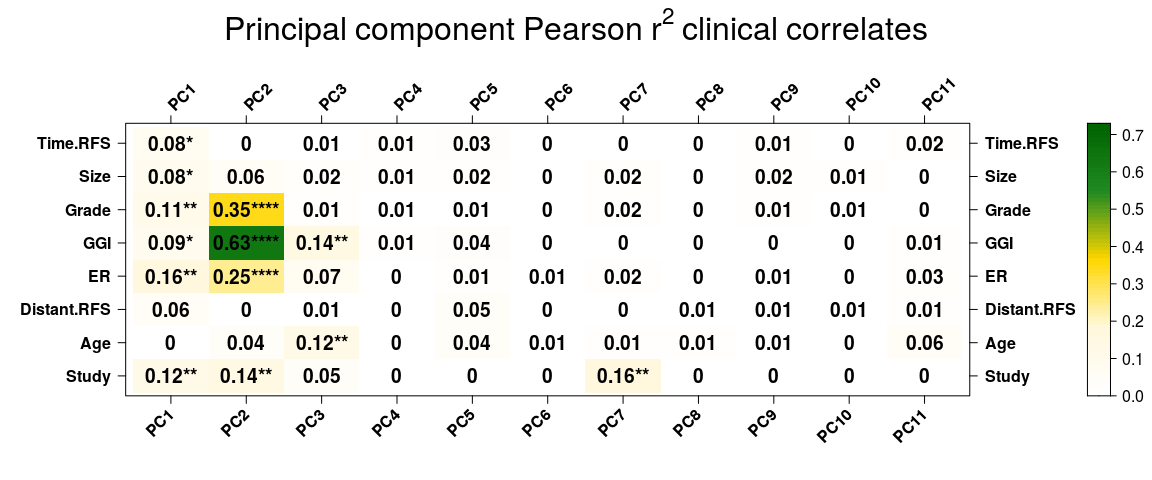
I would play around with PCA (PCATools is a fun program in R), look for the PCs that separates the samples according to serially changing time and look at the PCA loadings for those particular PCs!
2
987

21 Sep 2021
PCAtools: everything Principal Component Analysis in R/BioC
bioconductor.org/packages/re…
3
18

20 Sep 2021
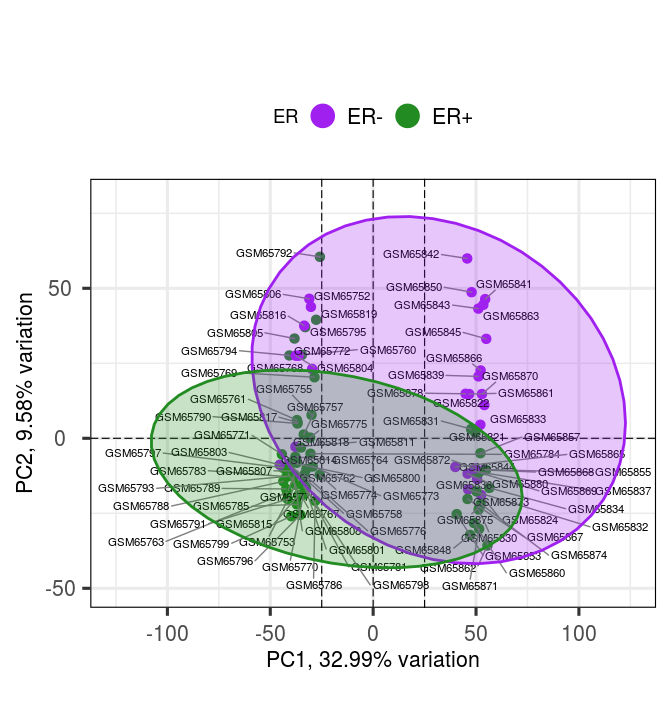
Tool Technique Tuesday. Data visualisation is key to identify potential batch effects and eventual interpretation of the results. One way is to project multiple dimensional data onto a 2D plot, PCA/MDS with #rstats tool by @KevinBlighe PCATools. bioconductor.org/packages/re…

3
7

12 Jan 2021
PCAtools: everything Principal Component Analysis
bioconductor.org/packages/re…
حزمة R قوية لل PCA
مراجعة كاملة مع شرح بسيط
#بيانات_فهد
#تعلم_مجانا
#المعلوماتية_الحيوية
#المعلوماتية_الصحية
#علم_البيانات
مدونتي:
fahad-data.blogspot.com
6
13
28 Dec 2020
PCAtools: everything Principal Component Analysis
bioconductor.org/packages/re…
التحليل عبر المركبات الرئيسية
مراجعة شاملة وعميقة
حزمة PCAtools
#بيانات_فهد
#تعلم_مجانا
#المعلوماتية_الحيوية
#المعلوماتية_الصحية
#علم_البيانات
مدونتي:
fahad-data.blogspot.com

2
4

28 Nov 2020
1
3

27 Nov 2020
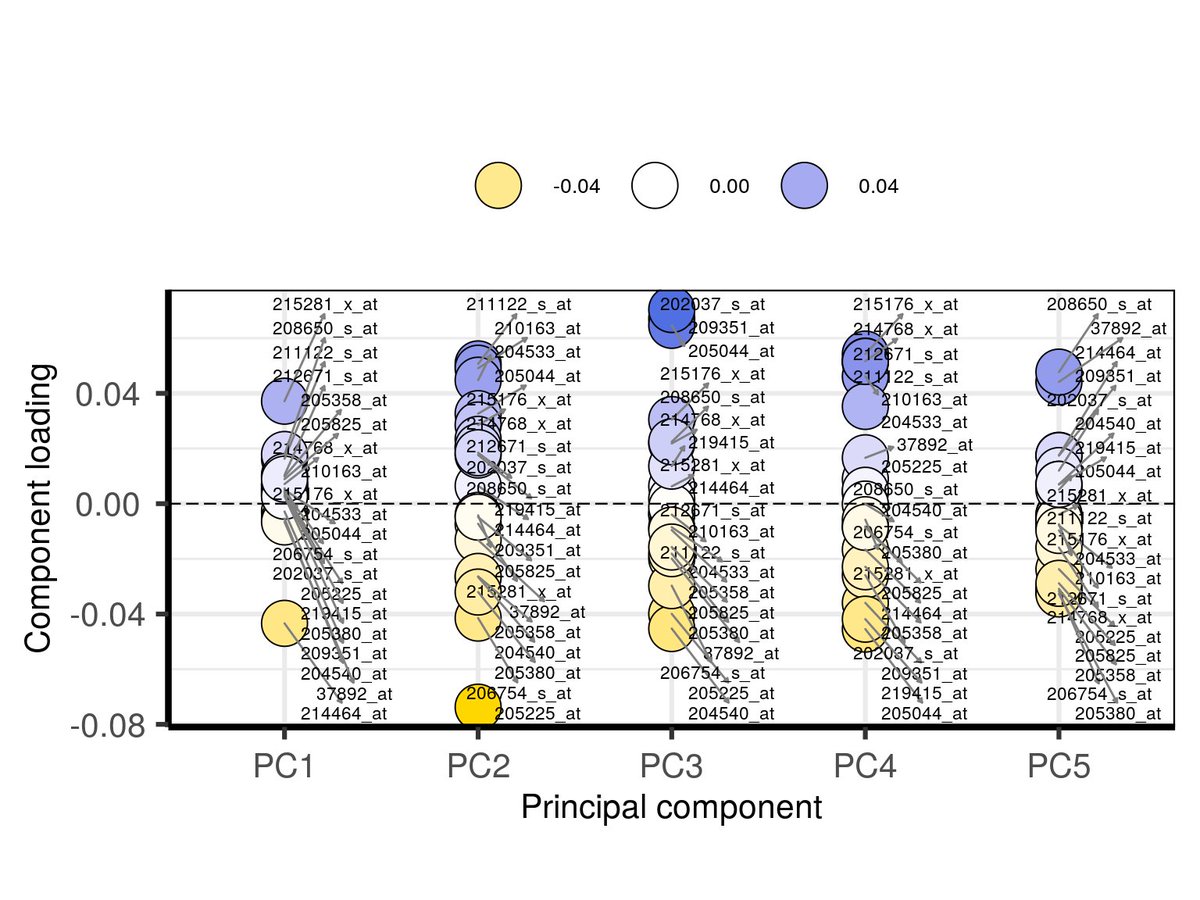
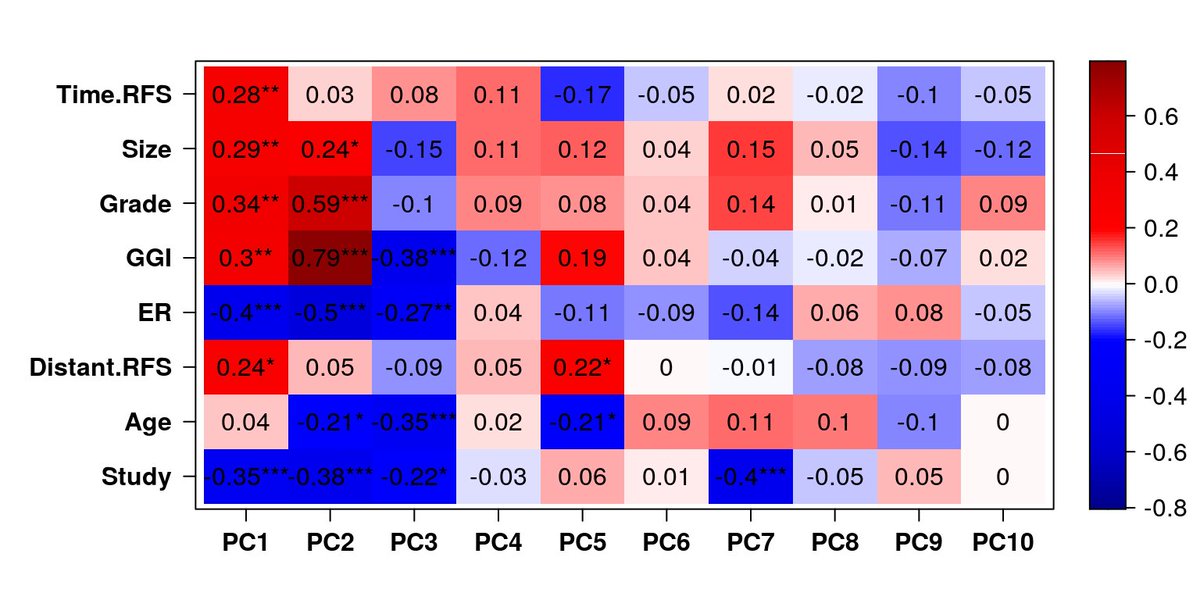
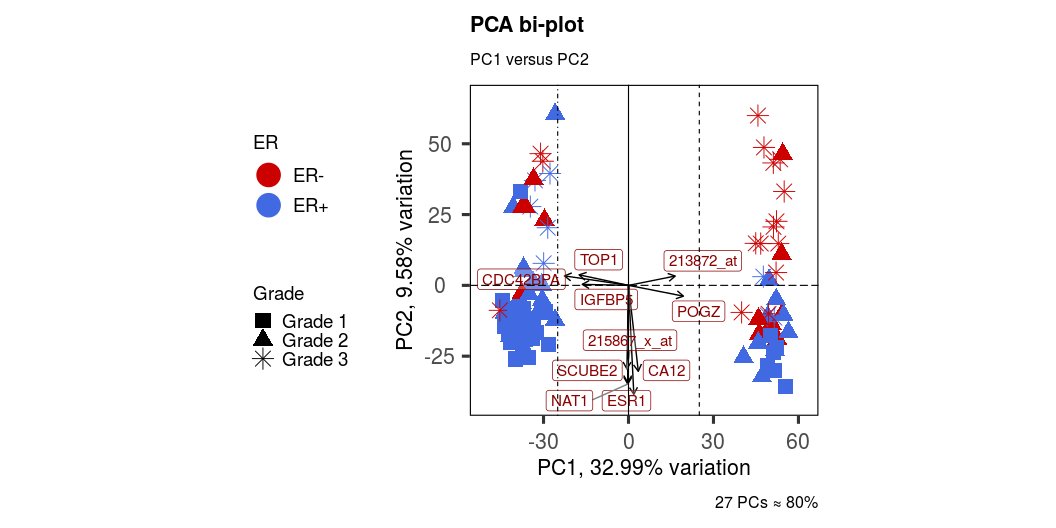
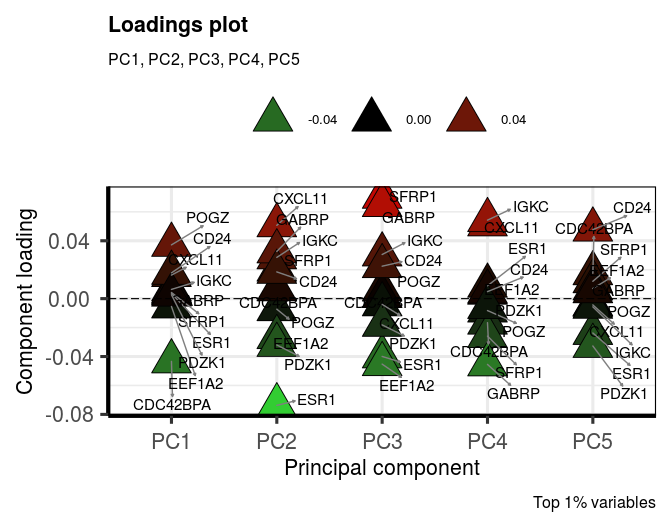
The latest @Bioconductor release also saw major updates to #PCAtools. Now additions for generating group ellipses, overlaying loadings on bi-plots, and using PCs to make model predictions
#biostats #PCA #bioinformatics #dataviz
bioconductor.org/packages/re…
2
28
140


13 May 2020
yeah I remember I used that! Lots of packages are using #ggplotify , like #PCAtools by @KevinBlighe . Also - I just came across #cowplot wilkelab.org/cowplot/index.h… it offers different ggplot2 theme customization as well - looks interesting!!
3
10 May 2020
Cannot believe I was not aware of either! #OmicsPCA bit.ly/2AeP8dw by Subhadeep Das & #PCAtools bit.ly/2WjrB3v by @KevinBlighe the detailed documentation and visualization is amazing. Marked! #PCA #omics #EDA #dataviz #RStats

Nice.
Is there are manuscript for this work?
The Bioconductor package vignette is pretty detailed and I am enjoying it so far. 🙏
bioconductor.org/packages/re…
#omics #genomics #Bioinformatics #PCA
3
4