
Jun 9
For rare events, instead of counting and looking to see if they are too high in a particular time period, you want to see if they are happening too fast in real time. A simple CUSUM control chart algorithm (in R code) looks like:
```
l <- 0.8/30 # rate of 0.8/30 events per day
tb <- c(7,6,12,9,10) # days between events
p <- pexp(tb,l) # exponential PDF
snorm <- qnorm(p) # turning into normal dist
cn <- cumsum(snorm) # alarm if < -4
```
You alarm here if `cn` gets below -4. (That is the standard for CUSUM control charts with a SD of 1 and mean of 0.)
If counting events per month, this example you would probably only have one month with 3 events and another with 2, which are not that rare individually with a rate of 0.8 events per month on average. And even if the month was anomalous, you would wait until the end of the reporting period and then see there was a problem, not earlier.
But seeing this string of events nearby in time suggests the process has potentially changed.
If you determine that it was random chance, you would reset the cumulative sum to zero and start again.
1
72

Mar 13
🟡🔵La Autoridad del Canal de Panamá mantiene abiertas 21 vacantes laborales para personas interesadas en integrarse a una de las instituciones más importantes del país y del comercio marítimo mundial.
Las oportunidades abarcan diversas áreas profesionales, entre ellas ingeniería, administración, contabilidad, operaciones marítimas y gestión de proyectos. Entre los puestos disponibles figuran ingeniero interdisciplinario en distintas especialidades, coordinador de procesos, administrador de proyectos, ingeniero civil en geotecnia, ingeniero estructural, técnico en planillas y técnico en contabilidad.
Lea la nota completa en el link del perfil @midiariopanama @mdiariopanama
midiario.com/nacionales/cana…
También se encuentran disponibles plazas como psicólogo comunitario y posiciones dentro del programa PEXP, dirigidas a funciones administrativas y operativas relacionadas con las actividades marítimas del Canal.

6
5
18
3,132

Haklısın. PExp ile derinlemesine handle/DLL analizi yapmak ya da şüpheli, “unbacked” bellek bölgelerine bakmak gerçekten uzman gözü gerektirir ve çoğu zaman ciddi ipuçları verir. Ancak DKOM kullanılarak ActiveProcessLinks zincirinden koparılmış bir süreç, CreateToolhelp32Snapshot gibi standart API çağrılarıyla listelenmez. Bu yüzden Process Explorer’ın ana süreç ağacında görünmesi genellikle zordur.
“Tespit için hangi program?” sorusuna gelince; en net yaklaşım, işletim sistemine dolaylı sorular sormak yerine RAM’i doğrudan ve fiziksel olarak inceleyen araçlara yönelmektir.
Volatility burada en güçlü araçlardan biridir. Özellikle psscan, bağlı listeye güvenmez; bellekteki EPROCESS yapılarının imzalarını tarar ve gizlenmiş süreçleri ortaya çıkarabilir. psxview ise API’lerin gördüğü süreçlerle RAM’de fiilen bulunanları karşılaştırarak görünmezlik farkını net şekilde gösterir.
WinDbg, canlı kernel debugging ile sistemdeki kernel nesnelerini manuel olarak incelemek için kullanılır. Daha zahmetlidir ama kontrol tamamen analizciye geçer; DKOM gibi müdahaleleri anlamak için çok değerlidir.
Wireshark ise farklı bir katmanı kapsar. Rootkit ağ trafiğini ayrıca gizlemiyorsa, dışarıya giden paketleri yakalayarak şüpheli iletişimi ortaya çıkarabilir. Süreci göremesen bile davranışı ele verebilir.

PExp. Da handle ve dll kısmından incelersen görürsün.
Uzmanlar görür.
Yoksa evet imzasız bazı sistem işlemleri yahut sistem yetkisi almış işlemler görünür.
(Yazı yerine yapay zeka ile kısa bilgilendirici içerik yapma fırsatınız var.
İyi olurdu.)
Tespit için hangi program?
1
8
1,060


[내가 사용해보고 싶은 거래소 순위 TOP]
플립스터 ( @flipster_io ) 거래의 효율은 높이고 자본이 잠드는 시간은 0으로 만듭니다.
Flipster는 제로 스프레드(Zero Spread) 모델과 증거금 실시간 수익 창출(Earn on Margin) 기능을 결합하여 전 세계 트레이더들의 자본 효율성을 극대화한 차세대 Perp DEX의 선두주자입니다. 기존 거래소들이 매수/매도 가격 차이를 통해 수익을 챙길 때, Flipster는 유저에게 가장 유리한 체결 환경을 제공하며 거래 진입 시 발생하는 슬리피지 리스크를 완전히 제거했습니다.
특히 글로벌 e스포츠 구단인 PSG TALON 등과의 전략적 파트너십을 통해 단순한 금융 앱을 넘어 MZ세대와 게이머들이 열광하는 트렌디한 브랜드 이미지를 구축했습니다.
2025년 하반기 AAA 보안 등급을 획득하며 기관 투자자들이 요구하는 엄격한 안전 기준을 충족시킨 점 또한 가파른 성장의 배경입니다.
유저가 포지션을 잡고 있는 동안에도 마진으로 예치된 자산이 실시간으로 리얼 일드를 수확하게 만드는 혁신적인 구조는 기회비용을 최소화하려는 프로 트레이더들에게 압도적인 지지를 받고 있습니다.
단순한 거래 도구를 넘어 트레이딩 자체가 하나의 수익 모델이자 문화가 되는 소셜 트레이딩의 아이콘으로서, Flipster는 웹3 파생상품 시장의 판도를 완전히 바꾸고 있습니다. #Trading #Binance #LFG #Crypto #100x #Finance #Web3 #PEXP

2
3
56

12月即将tge的大毛项目 @edgeX_exchange ,四种方式快速撸积分
要说现在今年最大的毛无疑就是perp dex赛道的了,如果你错过了 @Aster_DEX ,那么这个 #edgex 绝对不能错过
从 defillama 的收益数据来看,@edgeX_exchange 是仅次于hyperliquid的牛逼dex。
这一期的积分奖励目前是300000,还是很不错的。
目前有以下四种快速获取积分的方式
1:刷交易赚积分
这是所有的pexp dex 平台最直接的获取积分的方式,不过目前来看还是比较卷的。
这个周期目前有300亿的成交量,一积分的交易量大概在10万-20万左右。
成本20-40u,不过目前场外1积分喊到了300u,虽然实价格没这么夸张,不过收益远远高于成本,还是非常值得撸到。
2:邀请好友赚积分
邀请好友也是可以获得一定积分的,如果有资源的话,这也一个非常不错的获取渠道。
3:嘴撸赚现金
目前edgex正在举办嘴撸的活动,奖励具体规则在下面的引用稳,你也可以像我一样发布文章赚现金。
当然首先你得先在平台注册一个账号才行。
注册链接:pro.edgex.exchange/referral/…
四:存金库赚积分
平台也有自己的金库,存钱也是可以赚积分的,目前年华是60%左右,还是非常高的。
高收益就伴随着高风险,这个也不是稳赚不陪的,也有可能亏损本金,适当撸一下就好。
注意事项
一定要记住我们是来刷分的,不是来玩合约的,合约一不小心就爆仓了,得不偿失。
也可以跟 @reya_xyz 这样的平台对刷,这个平台应该在11月就会tge了,融资也不错,接近1700万,在我刷的平台里面优先级别是最高的。
@edgeX_exchange @KaitoAI #reya

#edgeX 也上线了创作者活动,瓜分 2000 万个 edgeX meme 50 万美元 USDT
要说最近这两个月什么最火的话,无疑就是perp dex 平台了。
从 #hyper 的巨毛到 #aster 空投之后 20倍的涨幅,瞬间点燃了大家对 perp dex的热情。
@edgeX_exchange 在没有发币的平台当中,各种数据都是比较亮眼的,月初开了嘴撸的活动。
奖励及规则如下
瓜分 2000 万个 edgeX meme 50 万美元 USDT 3 个 EpicSer NFT。
在您的用户名后添加“.edge 🦭 ”,并分享您关于 edgeX 的内容。
活动时间:11月3日10:00 - 12月3日10:00 UTC
最近刷的perp dex 平台确实不少,除了edgex之外,还刷了 @Backpack @vooi_io @ApeXProtocolCN @Aster_DEX
大对数都会选择在年末tge,还有机会卷一下,不过现在刷分确实比前面难太多了,性价比没那么高
@edgeX_exchange #edgex
1
2
148

30 Oct 2025
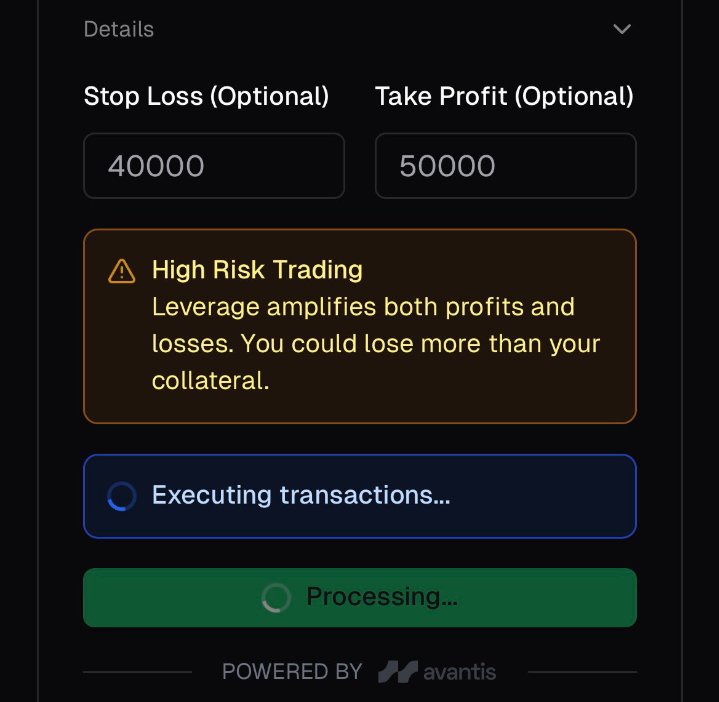
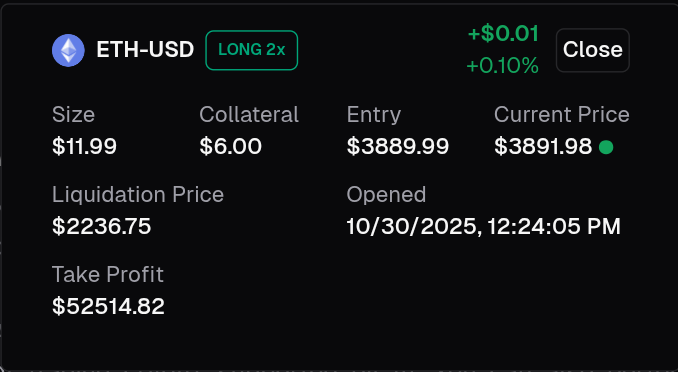
I've received several DMs indicating that many people are missing out on the 500 EP @HeyElsaAI {Protocol Explorer Quests} Avantis pexp trading, due to concerns about losing money in perpetual trading, while others simply aren't familiar with futures or perpetual trading.
📌Now here's the thread 🧵
📌Use this prompt: ELSA, OPEN LONG ETH ON AVANTIS WITH 6$ USDC COLLATERAL AND 2X LEVERAGE.
You can increase your collateral to any amount but not less than$5
📌The avantis ETH/USDC will pop up
🔹 Click long ETH
🔹 Confirm the first txn
🔹 Confirm the second time
🔹Done
📌Head to the top of your screen
🔹 Just beside your wallet address
🔹 Click the ETH-USDC open trade icon
🔹 Once the interface opens, click close
🔹 Confirm transactions
🔹 Done
Repeat it to grab the 500EP
All pictural representation are below
gElsa
Courtesy @ALTCOIN4LIFE123

12
13
258


24 Sep 2025
Article with the PEXP team at @GIGA_Institute is out at @democ_journal! In this article we conceptualize and operationalize the concept of personalization. Check it out here: tandfonline.com/doi/full/10.…
1
2
9
916

14 Aug 2025
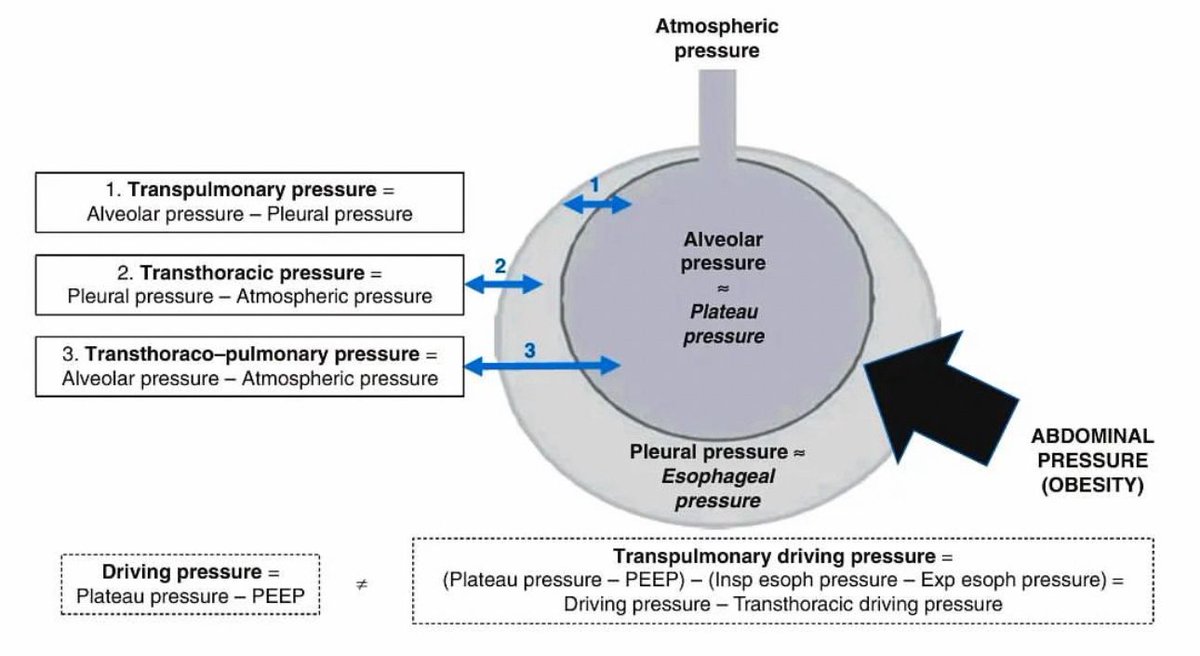
🫁𝗣𝗿𝗲𝘀𝗶𝗼𝗻𝗲𝘀 𝗣𝘂𝗹𝗺𝗼𝗻𝗮𝗿𝗲𝘀🫁
⬇️⬇️⬇️⬇️
✳️𝙋𝙧𝙚𝙨𝙞𝙤́𝙣 𝙩𝙧𝙖𝙣𝙨𝙥𝙪𝙡𝙢𝙤𝙣𝙖𝙧 (𝙋𝙇)
𝘗𝘓 = 𝘗𝘢𝘭𝘷𝘦𝘰𝘭𝘢𝘳 - 𝘗𝘱𝘭𝘦𝘶𝘳𝘢𝘭
Evalúa la distensión pulmonar (riesgo de sobredistensión o colapso).
❗️Palveolar ≈ presión plateau (Pplat) en pausa inspiratoria.
❗️Ppleural se estima con presión esofágica.
✳️𝙋𝙧𝙚𝙨𝙞𝙤́𝙣 𝙩𝙧𝙖𝙣𝙨𝙩𝙤𝙧𝙖́𝙘𝙞𝙘𝙖
𝘗𝘛𝘛 = 𝘗𝘱𝘭𝘦𝘶𝘳𝘢𝘭 - 𝘗𝘢𝘵𝘮𝘰𝘴𝘧𝘦́𝘳𝘪𝘤𝘢
Representa la carga impuesta por la caja torácica y abdomen.
✳️𝙋𝙧𝙚𝙨𝙞𝙤́𝙣 𝙩𝙧𝙖𝙣𝙨𝙩𝙤𝙧𝙖𝙘𝙤–𝙥𝙪𝙡𝙢𝙤𝙣𝙖𝙧
𝘗𝘛𝘗 = 𝘗𝘢𝘭𝘷𝘦𝘰𝘭𝘢𝘳 - 𝘗𝘢𝘵𝘮𝘰𝘴𝘧𝘦́𝘳𝘪𝘤𝘢
Equivale a la presión de la vía aérea medida directamente.
‼️𝘾𝙤𝙣𝙨𝙞𝙙𝙚𝙧𝙖𝙘𝙞𝙤𝙣𝙚𝙨 𝙚𝙣 𝙤𝙗𝙚𝙨𝙞𝙙𝙖𝙙
✳️La 𝗣𝗽𝗹𝗲𝘂𝗿𝗮𝗹 está elevada debido al aumento de presión abdominal y de la pared torácica.
✳️Un 𝗣𝗽𝗹𝗮𝘁 𝗮𝗹𝘁𝗼 puede deberse a 𝗽𝗿𝗲𝘀𝗶𝗼́𝗻 𝘁𝗿𝗮𝗻𝘀𝘁𝗼𝗿𝗮́𝗰𝗶𝗰𝗮 𝗮𝘂𝗺𝗲𝗻𝘁𝗮𝗱𝗮, 𝗻𝗼 necesariamente a sobredistensión pulmonar.
✳️El componente de presión transtorácica es proporcionalmente mayor que en pacientes no obesos.
Esto implica que 𝙞𝙣𝙩𝙚𝙧𝙥𝙧𝙚𝙩𝙖𝙧 𝙋𝙥𝙡𝙖𝙩 𝙨𝙞𝙣 𝙢𝙚𝙙𝙞𝙧 𝙥𝙧𝙚𝙨𝙞𝙤́𝙣 𝙚𝙨𝙤𝙛𝙖́𝙜𝙞𝙘𝙖 𝙥𝙪𝙚𝙙𝙚 𝙨𝙤𝙗𝙧𝙚𝙨𝙩𝙞𝙢𝙖𝙧 𝙡𝙖 𝙙𝙞𝙨𝙩𝙚𝙣𝙨𝙞𝙤́𝙣 𝙖𝙡𝙫𝙚𝙤𝙡𝙖𝙧.
‼️ 𝙄𝙢𝙥𝙡𝙞𝙘𝙖𝙘𝙞𝙤𝙣𝙚𝙨 𝙘𝙡𝙞́𝙣𝙞𝙘𝙖𝙨
✳️𝗗𝗿𝗶𝘃𝗶𝗻𝗴 𝗽𝗿𝗲𝘀𝘀𝘂𝗿𝗲 𝗰𝗹𝗮́𝘀𝗶𝗰𝗮 (𝗗𝗣):
DP = Pplat - PEEP
En obesos puede no refleja la presión real que distiende el pulmón.
✳️𝗗𝗿𝗶𝘃𝗶𝗻𝗴 𝗽𝗿𝗲𝘀𝘀𝘂𝗿𝗲 𝘁𝗿𝗮𝗻𝘀𝗽𝘂𝗹𝗺𝗼𝗻𝗮𝗿 (𝗗𝗣𝗟):
DPL = (Pplat - PEEP) - (Pinsp esof - Pexp esof)
Esto sustrae la contribución de la caja torácica, dando una medida más precisa de la carga sobre el tejido pulmonar.
‼️ 𝙍𝙚𝙡𝙚𝙫𝙖𝙣𝙘𝙞𝙖 𝙚𝙣 𝘼𝙍𝘿𝙎
✳️En ARDS con obesidad, la ventilación protectora debe basarse preferentemente en 𝗽𝗿𝗲𝘀𝗶𝗼𝗻𝗲𝘀 𝘁𝗿𝗮𝗻𝘀𝗽𝘂𝗹𝗺𝗼𝗻𝗮𝗿𝗲𝘀, no solo en Pplat o DP clásicas.
✳️Esto puede permitir el uso de PEEP más altos sin riesgo de sobredistensión, ya que parte de la presión medida se “gasta” en vencer la pared torácica.
𝘈𝘳𝘵𝘪́𝘤𝘶𝘭𝘰𝘴 𝘺 𝘮𝘢́𝘴 𝘦𝘯…
👇🏼👇🏼👇🏼👇🏼👇🏼
📑🔗🔑🔓
t.me/ClubCrit
👉 [buff.ly/H9W8apo]
#PTP #PresionesPulmonares #DeltaP #ClubCrit #UCI #Emergencia #MedEd #CriticalCare #FOAMcc #FOAMed #ManejoClínico #Urgencias #UCI #Enfermería #Emergencias #ClubCrit #Medicina #UCI #FOAMed #FOAMcc #MedTwitter #ICU #POCUS #CriticalCare #MedEd #CuidadoCrítico #MedX #EducaciónMédica #MedIntensiva #MedXCommunity #MedicinaCrítica #MedED #CritCare #ICUManagement #MustRead #LecturaRecomendada
2
54
196
10,835

22 Jul 2025
Sí, la inflación esperada (Pexp). En el enfoque monetario del tipo de cambio con expectativas la secuencia es:
Mexp => Pexp => Eexp
O sea, los agentes se cubren ante los aumentos esperados de M.
(Yo igual no adhiero a ese enfoque).
2
3
335


13 Mar 2025
Stand Out with Badges
- Earn badges by completing quests, battles, and economic challenges.
- Badges provide valuable rewards and PEXP.
- Show off your achievements on your profile to impress other players.

1
1
8
59
13 Mar 2025
Earn PEXP and Rewards You can earn PEXP by performing activities like:
- Combat, exploration, and daily/weekly quests. As you accumulate PEXP, unlock:
- Exclusive treasure chests;
- Additional character slots;
- Badges highlighting uniqu.e achievements

1
1
8
73

7 Dec 2024
ATTENTION PLAYERS! 🍄🍄
In case you missed it - Double EXP weekend is on NOW!
Get ahead of your peers with double the PEXP all weekend long. 👊

16
28
47
996


5 Aug 2024
I don't know. It was apparently not the easiest sell at Intel, but these instructions are great. Most of the BMI1 instructions substitute for 2 instructions and are OK. But to emulate PEXP/PDEP is 60-odd instructions with unknown masks and still 12 with fixed masks.
3
58