
Power Queryの参照先は、フォルダもファイルもテーブルもワークシート名も、テーブルでマスタ化して可変にしておく派です✨
特にフォルダ構成は、意図せず簡単に変わっちゃいますからね😊
#Excel
#PowerQuery
Jun 13

先日
お客様「パワークエリが更新できなくなりました!」
ワイ「うっす。土曜日に調べます。」
土曜日
ワイ「パワークエリの参照先フォルダがなくなっとるやんけ!」
19
3,379
「私がよくわからないモノは、みんなもよくわからないんだから使っちゃダメ」
全くもって許し難い理屈です😊💢
#Excel
#PowerQuery

本部長が「よくわからないから」って理由でPower Queryを使った業務改善を禁止されたんだぞ?
じゃあAIならよくわかるんか??
4
403

技術的負債対策でマクロを無くそうとする心意気は素晴らしいのだが、業務設計から見直そうマンはプランが壮大すぎて動けないし、PowerQueryだけで全部やるマンの作ったクエリは重くて動かないし、DAXやPowerAutomateも組み合わせるマンの作ったやつは設計が壮大でメンテできない。
14

…From data wrangling in power query to designing visuals that actually tell a story using power BI.
Every dashboard was a new challenge!
Thank you to @TechSphereAcad @ezekiel_aleke
#DataAnalytics #PowerBI #Excel #Powerquery #Dashboard #DataVisualization #Analytics


6
56


At the end of every quarter, Sandra has the same challenge.
As the Commercial Analytics Lead at Nestlé Nigeria, she's responsible for preparing performance reports for management.
The problem isn't the reporting itself.
The problem is that the data comes from different regions.
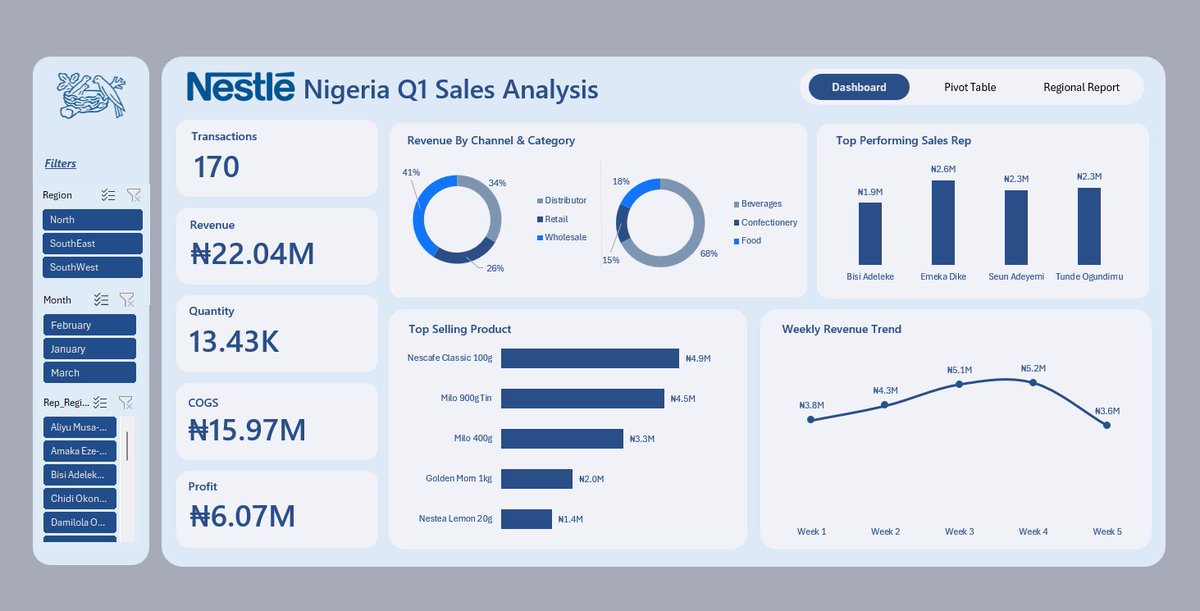
For Q1, sales reports arrived from the North, South-West, and South-East regions as separate CSV files. Each region maintained its own report, which meant slight differences in formatting, naming conventions, and data quality.
Before management could answer questions like:
• Which region generated the most revenue?
• Which products performed best?
• Who were the top-performing sales representatives?
• How did revenue trend throughout the quarter?
The data first had to be prepared.
This project started with three regional sales datasets.
Using Power Query, I imported the files, standardized the structure, corrected data types, cleaned inconsistencies, and appended all three datasets into a single master table.
Once the foundation was in place, I created additional fields to support analysis, including:
• Revenue
• Profit
• Profit Margin
• Week Number
• Month Name
• Performance Indicators
With the transformed dataset ready, the next step was analysis.
Before building any visuals, I summarized the data using PivotTables to identify the key insights and answer the business questions that mattered most.
Only after the analysis phase did I move into dashboard design.
I wireframed the layout, defined the KPI structure, selected the appropriate visualizations, and built an interactive dashboard featuring:
• Revenue, Profit, Quantity, and Transaction KPIs
• Revenue by Channel and Category
• Top Performing Sales Representatives
• Best Selling Products
• Weekly Revenue Trends
• Interactive filters for Region, Month, and Sales Representative
What began as three separate CSV files became a centralized reporting solution capable of delivering insights in seconds.
One lesson I keep reinforcing in my classes:
Most people think dashboards start with charts.
They don't.
Dashboards start with clean data, a structured process, and the right business questions.
Tools Used: Excel, Power Query, PivotTables, PivotCharts, Slicers, Dashboard Design
#DataAnalytics #Excel #PowerQuery #BusinessIntelligence
12
19
140
4,199

Jun 13
Gemini kan nu PowerQuery‑scripts in M vergelijken met een functionele beschrijving van je logica, die vervolgens als context voor AI dient. Ik ben verbaasd dat dit nu al mogelijk is.
linkedin.com/posts/alberseri…

9
たきぞう retweeted

Jun 12
その調子でOfficeスクリプトでのオリジナル関数登録も布教してあげてくださいw
PowerQueryを使わないクロス結合、左結合数式とOfficeスクリプトによるオリジナル関数登録
note.com/blanknotejp/n/n0132…
4
11
1,247

Jun 12
Totally agree! 👍
Power Query is indeed a game changer for those who often manage data in Excel. The infographic is super clear and complete, suitable for beginners.
Thank you for sharing, @heyabhi_21! Make people more productive.
Anyone who hasn’t tried Power Query, just practice it, it saves a lot of time! 💪
#ExcelTips #PowerQuery
1
27

Ready to elevate your #DataAnalytics and #BusinessIntelligence skills? 📊 Join today and unlock the full potential of #PowerBI, #PowerQuery, #PowerPivot, and #Excel. Our courses are designed by leading professionals who’ve been in your shoes. View courses: skw-t.com/courses

ALT Power BI and Excel training created especially for data professionals (Image of a smiling man and sitting in front of a computer in an office) (Skillwave Training logo)
17

Jun 12
In this Monkey Shorts, I combine 3 tricks into 1 nifty solution:
✅An alternate use for last week's Dev/Prod switch
✅Referring to previous step names
✅Building a filter to remove a dynamic number of rows from the top of the data set
youtube.com/watch?v=chGotVmr…
#PowerQuery #Excel
195


Most organisations have critical logic hidden inside #DAX, #PowerQuery and #SQL🕵️♀️
#DiscoveryAI translates said complexity into human-readable explanations, helping teams improve governance and understand their #PowerBI estate at scale.
🔍 Learn more: powerbisentinel.com/discover…

24

Jun 12
CSP nevar, VID nevar - dodiet jēldatus lasāmā formā no datu bāzes kaut vai uz Atvērtajiem datiem ar norādītu saiti, ar PowerQuery izdabūsim ko vajag paši.
2
5
286
