
20 Sep 2025
🤨Why Traders Fail at Liquidity Traps (And How RSI Fixes It)
📲youtu.be/KYfClapZw4I
Liquidity levels are where institutions and smart money place their trades — acting as both magnets and barriers for price. When combined with the Relative Strength Index (RSI), traders can unlock high-probability setups that align with liquidity zones and momentum shifts.
In this video, Bharat Jhunjhunwala reveals how to spot key liquidity pools, confirm them with RSI divergence & range shifts, and execute trades with maximum precision. From avoiding false breakouts to mastering multi-timeframe RSI analysis, this strategy works across Nifty, Bank Nifty, Forex, Crypto, and Stocks.
📌 Discover how to:
✔️ Identify liquidity levels that institutions target
✔️ Use RSI divergence & overbought/oversold traps to filter trades
✔️ Align multi-timeframe RSI for higher accuracy
✔️ Build reliable entry/exit strategies around liquidity pools
If you’ve ever been trapped in a false breakout, this approach will change the way you trade.
#LiquidityTrading #RSITrading #PriceActionTrading #SmartMoneyTrading #BankNiftyStrategy #NiftyTrading #StockMarketStrategy #ForexTrading #CryptoTrading #TechnicalAnalysis #TradingSetups #BreakoutTrading #ProfitableTradingStrategy #BharatJhunjhunwala

4
871
17 Sep 2025
Gap trading is one of the most exciting strategies in the stock market, and when executed correctly, it delivers fast moves with strong rewards. In this video, Bharat Jhunjhunwala introduces a new way to trade gap fills — a method that combines price action, opening range, and momentum confirmation to capture explosive intraday moves.
Most traders either chase gap ups blindly or avoid them due to high risk, but with this gap fill strategy, you’ll learn how to:
Identify the right gaps to trade
Differentiate between continuation gaps vs. exhaustion gaps
Use opening range breakouts as confirmation
Catch quick profits while minimizing risk
📌 What You’ll Learn in This Video:
✔️ Gap Fill Strategy explained step-by-step
✔️ Types of gaps – breakaway, continuation, exhaustion
✔️ How to identify high-probability gap setups
✔️ Trading gaps with opening range breakout (ORB) rules
✔️ Entry & stop-loss placement for maximum accuracy
✔️ Backtested performance on Nifty, Bank Nifty, FinNifty, US stocks & crypto
✔️ How to avoid false gaps that trap retail traders
✔️ Risk management for gap trading – stop hunting prevention
🔍 Why This Works in 2025 Markets:
→ Gaps are becoming more common due to global volatility & news-driven flows
→ Institutions often create liquidity traps around gaps – this strategy avoids them
→ Fast intraday moves = perfect for traders seeking quick profits
→ Works across indices, stocks, forex, and crypto markets
This is not the usual “gap trading” you’ve seen before — it’s a specialized gap fill system designed for high probability setups and tested across multiple markets.
📍 LIKE if you’ve ever been trapped in a failed gap move
📍 COMMENT your favorite market for trading gaps
📍 SUBSCRIBE for tested intraday & swing trading strategies
📍 SHARE this with traders looking for explosive setups
#GapTrading #GapFillStrategy #IntradayTrading #OpeningRangeBreakout #GapTradingSetup #FastTradingMoves #StockMarketStrategy #BankNiftyStrategy #NiftyTrading #FinNiftyStrategy #PriceActionTrading #TechnicalAnalysis #ExplosiveTradingSetups #GapUpStrategy #GapDownStrategy #SmartMoneyTrading #TradingWithConfidence #MarketAnalysis #ProfitableTradingStrategy #GapFill #TradingTips #IntradaySetup #SwingTrading #StockTrading #ForexTrading #CryptoTrading #CommodityTrading #DayTrading #BharatJhunjhunwala #TradingEducation
9
560
16 Sep 2025
Liquidity drives the markets — and knowing where liquidity pools exist can give traders the ultimate edge. In this video, Bharat Jhunjhunwala reveals how to mark high probability liquidity levels and combine them with RSI and multi-timeframe analysis to capture explosive moves while avoiding fakeouts.
Most retail traders chase price action blindly, but professional traders focus on liquidity levels where institutions enter and exit. By understanding how to spot these levels and aligning them with RSI divergence, RSI overbought/oversold, and multi-timeframe confirmation, you can trade with higher accuracy and confidence.
📌 What You’ll Learn in This Video:
✔️ How to mark high probability liquidity levels on charts
✔️ Using RSI divergence to identify real reversals vs. fake signals
✔️ Overbought/Oversold RSI rules for liquidity zones
✔️ Multi-timeframe analysis – why daily, 1-hour, and 5-min confluence matters
✔️ Liquidity traps explained – how to avoid getting caught where retail fails
✔️ Entry & exit rules for trading around liquidity levels
✔️ Works across Nifty, Bank Nifty, stocks, forex, crypto, and commodities
✔️ Backtested strategy that filters weak setups and increases win rate
🔍 Why This Strategy Works in 2025 Markets:
→ Liquidity levels expose where smart money orders are resting
→ RSI adds momentum confirmation at those levels
→ Multi-timeframe confluence prevents false entries
→ A strategy suited for intraday, swing trading, and positional setups
→ Perfect for traders tired of getting trapped in fake breakouts
This is not just another “indicator setup” — it’s a liquidity-based strategy designed for real trading success.
📍 LIKE if you’ve ever been trapped near liquidity sweeps
📍 COMMENT your favorite timeframe for trading liquidity
📍 SUBSCRIBE for advanced strategies that go beyond basics
📍 SHARE with traders who need to stop losing to smart money
#LiquidityTrading #RSIStrategy #MultiTimeframeAnalysis #LiquidityLevels #SmartMoneyTrading #PriceAction #TechnicalAnalysis #TradingStrategy #NiftyAnalysis #BankNiftyAnalysis #SwingTrading #IntradayTrading #ForexTrading #CryptoTrading #CommodityTrading #LiquidityTraps #StockMarketIndia #MarketAnalysis #TradingSetups #ProfitableTradingStrategy #TradingTips #RSIDivergence #LiquiditySweep #InstitutionalTrading #ChartPatterns #RSITrading #BreakoutStrategy #StockTrading #TradingEducation #BharatJhunjhunwala
1
13
638
15 Sep 2025
The Manufacturing sector is gearing up for a major momentum breakout. With RSI strength across multiple timeframes and a weekly Cup & Handle breakout, this sector is flashing strong bullish signals that traders and investors cannot afford to ignore.
In this video, Bharat Jhunjhunwala breaks down how to analyze sector momentum using RSI and price action patterns. You’ll see why the Manufacturing sector is poised to outperform and how to position for the next big move.
📌 What You’ll Learn in This Video:
✔️ Cup & Handle Pattern Breakout – why it matters on the weekly chart
✔️ RSI Momentum Analysis – across daily, weekly, and intraday timeframes
✔️ Sector Rotation – why Manufacturing is emerging as a leader now
✔️ Price Action Insights – confirming strength at breakout levels
✔️ Multi-Timeframe Trading Strategy – aligning with higher timeframes for accuracy
✔️ Sector Leadership – how Manufacturing stacks up against Infra, Metals, Auto & IT
✔️ Stocks to Watch – how to identify leading Manufacturing stocks within the sector
🔍 Why This Matters in 2025 Markets:
→ Strong RSI range shifts indicate bullish momentum
→ Cup & Handle breakout confirms long-term trend continuation
→ Sector analysis helps traders ride institutional money flow
→ Perfect opportunity for swing trading & positional setups
→ Works in Nifty, Bank Nifty, Sector ETFs, and stock-specific trades
Whether you’re preparing for intraday trading, swing setups, or long-term investing, this strategy will help you spot high probability trades in the Manufacturing sector.
📍 LIKE if you’re bullish on Manufacturing sector stocks
📍 COMMENT your favorite stock in this sector
📍 SUBSCRIBE for more sector rotation and market analysis
📍 SHARE this with traders tracking Nifty sectors
#ManufacturingSector #CupAndHandle #RSIMomentum #SectorBreakout #SectorRotation #NiftyAnalysis #StockMarketIndia #BankNiftyAnalysis #SectorTrading #TechnicalAnalysis #PriceAction #RSITrading #SectorMomentum #StocksToBuy #NiftySectors #TradingStrategy #SwingTrading #PositionalTrading #SectorRotationStrategy #ProfitableTradingStrategy #MarketAnalysis #SectorLeadership #SmartMoney #SectorInvesting #CupHandleBreakout #StockMarketStrategy #TradingSetups #StockMarketToday #BharatJhunjhunwala #StockTrading
9
743
5 Sep 2025
Are you trading the flag pattern but struggling with failed breakouts or inconsistent results? The flag pattern is one of the most powerful continuation chart patterns in technical analysis, but success depends on confirmation. By combining flag patterns with RSI and Moving Averages, traders can significantly improve accuracy and increase the probability of success.
In this video, Bharat Jhunjhunwala reveals a step-by-step method to enhance the flag pattern trading strategy using price action, RSI divergence, and moving averages. This approach helps filter out false breakouts, identify strong continuation setups, and maximize profits in stocks, forex, crypto, and commodities.
📌 What You’ll Learn in This Video:
✔️ Flag Pattern Trading Strategy – Bull flags, bear flags, and how to trade them step-by-step
✔️ RSI Confirmation – Using RSI for overbought/oversold filters & divergence signals
✔️ Moving Averages with Flag Pattern – EMA/SMA combinations for entry, exit & stop-loss placement
✔️ Price Action Analysis – Support, resistance & breakout zones for stronger setups
✔️ False Breakout Avoidance – How to identify traps & save your capital
✔️ Swing Trading & Intraday Application – Adapting flag patterns across multiple timeframes
✔️ Real Chart Examples – Nifty, Bank Nifty, Bitcoin, Gold, and US stocks explained
🔍 Why This Works in 2025 Markets:
→ Flag patterns remain one of the most reliable continuation setups
→ RSI filters out weak signals and improves timing
→ Moving averages provide structure for entries & exits
→ Works across stocks, forex, crypto, and commodities
→ Perfect for swing traders and day traders looking for momentum setups
If you’re tired of failed flag trades, this strategy will help you trade flags like a professional and catch explosive continuation moves with confidence.
📍 LIKE if you’ve ever been trapped in a failed breakout
📍 COMMENT your favorite flag pattern setup (bullish or bearish)
📍 SUBSCRIBE for weekly advanced trading strategies
📍 SHARE with traders who rely on chart patterns
#FlagPattern #TradingStrategy #PriceActionTrading #RSI #MovingAverages #TechnicalAnalysis #SwingTrading #DayTrading #ForexTrading #CryptoTrading #StockMarketTrading #ContinuationPatterns #BullFlag #BearFlag #TradingSetups #ProfitableTradingStrategy #MarketAnalysis #HighProbabilityTrading #PriceAction #SmartMoneyMoves #PatternTrading #StockTrading #ForexStrategy #CryptoStrategy #ChartPatterns #TradingEducation #TradingTips #BharatJhunjhunwala #TradingWithIndicators #TradingOpportunities
1
3
434
2 Sep 2025
The Head & Shoulders pattern is one of the most well-known reversal chart patterns in technical analysis. Traders often use it to spot trend reversals, but what most don’t realize is that a failed Head & Shoulders pattern can be an even more profitable setup — turning into a powerful trap pattern that leads to explosive moves.
In this masterclass, Bharat Jhunjhunwala explains not only how to identify the classic Head & Shoulders formation, but also how to recognize when the pattern is failing, and most importantly, how to capitalize on that failure to trade in the opposite direction.
📌 What You’ll Learn in This Video:
✔️ Head & Shoulders Pattern Explained – Key features and psychology behind the pattern
✔️ Inverse Head & Shoulders – The bullish reversal variation you must know
✔️ Failed H&S Traps – How to detect false breakdowns and retail traps
✔️ Trading the Failure – Turning a losing setup into a profitable opportunity
✔️ Classical Chart Pattern Analysis – How failed patterns generate stronger moves than valid ones
✔️ Price Action & RSI Confirmation – Tools to validate pattern strength or weakness
✔️ Swing Trading & Intraday Setups – How to trade H&S patterns across timeframes
✔️ Real Chart Examples – Stocks, Forex, Crypto, and Indices trades explained step-by-step
🔍 Why This Strategy Works in 2025 Markets:
→ Retail traders often get trapped by failed Head & Shoulders breakouts
→ Smart money uses these patterns to induce false moves before reversing
→ Failed chart patterns often lead to stronger continuation trends
→ Works across stocks, forex, crypto, and commodities
→ Perfect for swing trading and intraday traders looking for momentum setups
This is not just another theory lesson — it’s a practical trading blueprint that shows you how to turn failed patterns into profitable opportunities.
📍 LIKE if you’ve ever been trapped by a failed pattern
📍 COMMENT your favorite chart pattern to trade
📍 SUBSCRIBE for advanced chart pattern tutorials weekly
📍 SHARE this with traders who rely on classical chart analysis
#HeadAndShoulders #FailedPatterns #ChartPatterns #PriceActionTrading #TechnicalAnalysis #SwingTrading #DayTrading #ForexTrading #CryptoTrading #StockMarketTrading #HeadAndShouldersPattern #InverseHeadAndShoulders #ReversalPatterns #PatternTrading #SmartMoneyMoves #TradingSetups #ProfitableTradingStrategy #FailedHeadAndShoulders #PatternTrap #StockTrading #ForexStrategy #CryptoStrategy #MarketAnalysis #BharatJhunjhunwala #ContinuationPatterns #TradingWithPriceAction #HighProbabilityTrading #TradingEducation #ClassicalChartPatterns #MarketInsights
3
527
1 Sep 2025
One of the biggest challenges for traders is correctly identifying trend direction and timing their entries into trades. Most strategies either focus on direction without precision entry, or entry signals without clear trend context. This is where the RSI indicator combined with Moving Averages creates a high probability trading system that resolves both direction and timing together.
In this tutorial, Bharat Jhunjhunwala demonstrates how to use RSI for trend detection and moving averages for entry timing, giving traders a structured and repeatable approach to trading stocks, forex, crypto, and commodities.
📌 What You’ll Learn in This Video:
✔️ RSI for Trend Direction – How RSI range shifts reveal whether markets are trending or consolidating
✔️ Moving Averages for Timing – Best moving average combinations for precise entry & exit
✔️ High Probability Setup – Filtering sideways markets and trading only strong moves
✔️ Multi-Timeframe Analysis – Aligning RSI signals on higher timeframe with entries on lower timeframe
✔️ Stop-Loss & Trailing Stops – Protecting capital while maximizing trend profits
✔️ Real Chart Examples – Nifty, Bank Nifty, Bitcoin, Gold, and Forex pairs explained step-by-step
✔️ Scalping, Swing & Positional Applications – Adapting the system for different trading styles
🔍 Why This Works in 2025 Markets:
→ RSI trend detection cuts through noise and shows real direction
→ Moving averages give structure for entry, exit, and stop placement
→ System works across stocks, crypto, forex, commodities, and indices
→ Perfect for swing traders, day traders, and position traders
→ Eliminates confusion between trend vs. pullback vs. reversal setups
This is not just another RSI or Moving Average strategy. It is a complete trend timing framework that ensures traders only trade with momentum and enter at the right time.
📍 LIKE if you’ve ever been trapped entering too early or too late
📍 COMMENT your favorite moving average setup
📍 SUBSCRIBE for advanced trading systems every week
📍 SHARE with traders who want consistency and structure
#RSI #MovingAverages #TrendTrading #TradingSystem #HighProbabilityTrading #TechnicalAnalysis #SwingTrading #DayTrading #CryptoTrading #ForexTrading #StockMarketTrading #RSITradingStrategy #TradingWithIndicators #ProfitableTradingStrategy #TradingSetups #SmartMoneyMoves #MarketAnalysis #StockTrading #ForexStrategy #CryptoStrategy #PriceActionTrading #TradingTips #SwingTrading2025 #StockMarketAnalysis #SmartTrading #BharatJhunjhunwala #TrendDirection #TradingEducation #PatternTrading #MarketInsights
4
547
28 Aug 2025
The Ascending Triangle pattern is one of the most highly accurate trading patterns in classical technical analysis. Whether you are trading stocks, forex, or crypto, this chart pattern offers a powerful way to spot bullish breakouts and trade with the trend.
In this detailed trading lesson, Bharat Jhunjhunwala explains how to identify, analyze, and trade the Ascending Triangle chart pattern with precision. You’ll learn how to combine price action, candlestick analysis, and technical indicators to filter false signals and maximize your winning probability.
📌 What You’ll Learn in This Video:
✔️ Ascending Triangle pattern explained – rules, psychology & why it works
✔️ How to identify breakouts with confirmation signals
✔️ Using RSI & Moving Averages to validate Ascending Triangle setups
✔️ Day trading & scalping strategies with ascending triangles
✔️ Real chart examples in stocks, forex pairs, Bitcoin & Ethereum
✔️ How to avoid false breakouts using volume & candlestick patterns
✔️ Stop-loss placement & profit target strategies for risk management
✔️ Comparing Ascending Triangle with Descending & Symmetrical Triangles
✔️ Difference between double top/bottom patterns vs triangle patterns
🔍 Why This Strategy Works in 2025 Markets:
→ Ascending Triangles reflect accumulation by smart money before breakout
→ Traders can ride strong trends instead of being trapped in sideways chop
→ Works on multiple timeframes for swing trading, intraday & scalping
→ Can be applied to crypto, stocks, forex trading strategies, and futures
→ Perfect for traders who want simple but effective chart pattern analysis
This isn’t just theory — you’ll see live chart examples and learn practical strategies that help you trade Ascending Triangle breakouts with confidence.
📍 LIKE if you’ve ever traded triangle breakouts
📍 COMMENT your favorite chart pattern to trade
📍 SUBSCRIBE for weekly advanced trading strategies
📍 SHARE this with traders who want to master chart patterns
#AscendingTriangle #ChartPatterns #TrianglePattern #PriceActionTrading #TechnicalAnalysis #DayTrading #SwingTrading #ScalpingStrategy #CryptoTrading #ForexTrading #StockMarketTrading #ProfitableTradingStrategy #TradingSetups #BreakoutStrategy #TradingWithPatterns #CandlestickPatterns #MarketAnalysis #Stocks #SmartMoneyMoves #TradingTips #CryptoStrategy #ForexStrategy #SwingTrading2025 #PriceActionStrategy #StockTrading #TradingEducation #TechnicalTrading #ChartPatternAnalysis #BharatJhunjhunwala #TradingStrategy
1
8
740
26 Aug 2025
The Double Top pattern is one of the most recognized chart patterns in technical analysis — but most traders fail to trade it successfully. The reason? They don’t combine it with the right filters, indicators, and price action hacks.
In this masterclass, Bharat Jhunjhunwala reveals how to trade the Double Top pattern without failure by combining it with RSI divergence, Moving Averages, and powerful price action confirmations. This increases the accuracy and success rate of the double top setup, while also teaching you how to adapt the strategy to stocks, forex, and crypto markets.
📌 What You’ll Learn in This Video:
✔️ Double Top Pattern Explained – rules, conditions, neckline, and breakout zones
✔️ Why Most Double Tops Fail – retail traps and false breakouts
✔️ RSI Double Top Strategy – spotting momentum weakness before breakdown
✔️ Moving Averages Double Top – filters for trend confirmation
✔️ Price Action Hacks – unique tips to validate chart patterns that nobody talks about
✔️ Double Bottom Pattern Strategy – the bullish reversal twin of the double top
✔️ Examples in Stocks, Forex, and Crypto – live analysis of chart setups
✔️ How to trade Double Top breakouts and avoid false signals
✔️ Stop-loss & target placement to maximize profits
🔍 Why This Works in 2025 Markets:
→ The Double Top chart pattern remains one of the most reliable bearish reversal setups when confirmed with indicators
→ RSI divergence signals exhaustion before the actual breakdown
→ Moving averages help identify whether the double top is valid in the bigger trend
→ Price action analysis filters out false setups and whipsaws
→ Can be used across forex trading, crypto trading, stock trading, and futures trading
This strategy gives you the exact framework to trade double tops and double bottoms with confidence, avoiding common mistakes and increasing win rates.
📍 LIKE if you’ve ever been trapped in a failed double top
📍 COMMENT your favorite chart pattern to trade
📍 SUBSCRIBE for weekly advanced pattern trading tutorials
📍 SHARE with traders learning chart patterns and price action trading
#DoubleTop #ChartPatterns #DoubleBottom #TradingStrategy #RSI #MovingAverages #TechnicalAnalysis #PriceAction #SwingTrading #StockMarket #ForexTrading #CryptoTrading #PatternTrading #ChartPatternStrategy #TradingWithPatterns #BearishPattern #DoubleTopExplained #StockTrading #TradingTips #SmartMoneyMoves #MarketAnalysis #SwingTrading2025 #ForexStrategy #CryptoStrategy #PriceActionTrading #ProfitableTradingStrategy #DoubleBottomPattern #PatternBreakout #Stocks #BharatJhunjhunwala
6
707
23 Aug 2025
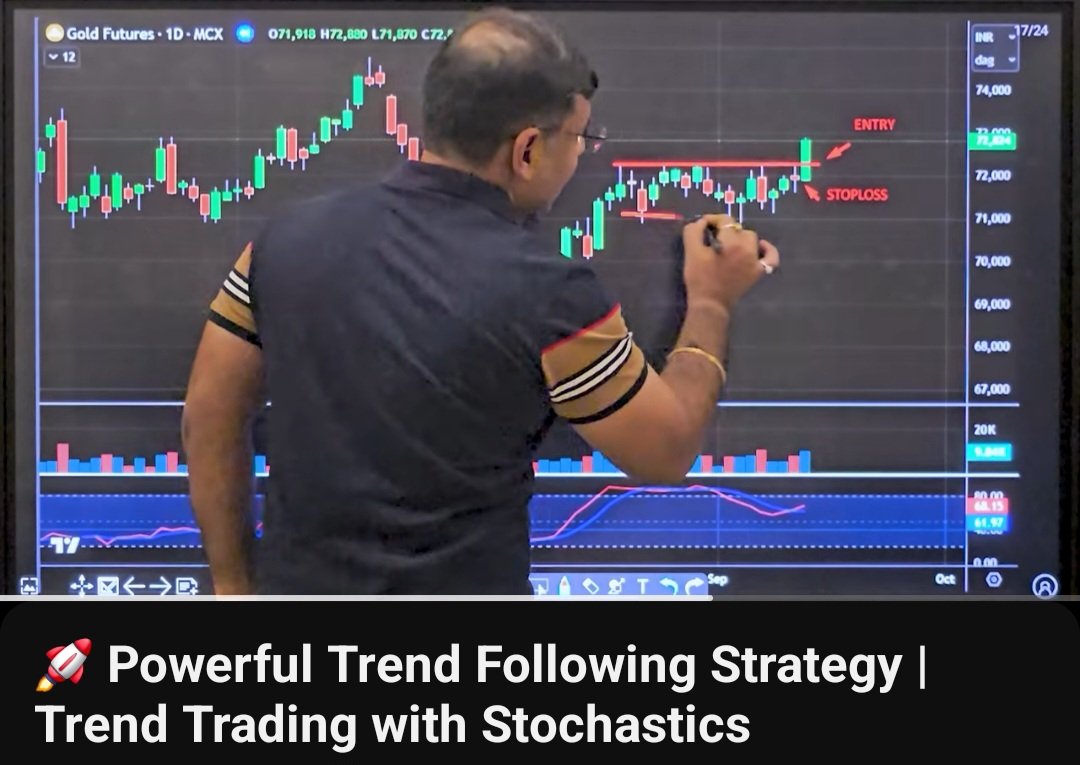
Stochastics is one of the most powerful but underrated trading indicators in technical analysis.
📲youtu.be/wFxvEPcKceA
In my latest masterclass, I break down how to use the Stochastic Oscillator for:
✅ Trend Trading – catch continuation moves with precision
✅ Momentum Confirmation – filter false signals & avoid whipsaws
✅ Overbought & Oversold Levels – when to trust them, when to ignore
By combining Stochastics with moving averages, trendlines, and price action, traders can finally trade stocks, forex, crypto, and futures with confidence — knowing exactly when to enter, when to exit, and how to stay out of sideways markets.
This is the Stochastic Strategy pros use but rarely explain. Perfect for swing traders, trend traders, and market professionals preparing for 2025 volatility.
#StochasticTrading #StochasticOscillator #TrendTrading #SwingTradingStrategy #ForexTrading #CryptoTrading #StockMarketTrading #TechnicalAnalysis #PriceAction #StochasticIndicator #TradingWithStochastics #SwingTrading2025 #TrendFollowing #OverboughtOversold #MarketAnalysis #ProfitableTradingStrategy #StockTrading #TradingTips #SmartMoneyMoves #BharatJhunjhunwala
4
617

15 Apr 2024
A five-part series on steps to finding profitable trading techniques.
Part 4: Evaluate and fine-tune the trading plan
A trading strategy can be reviewed and optimized to increase its effectiveness and profitability once it has been selected and put to the test.
This includes:
1. Examining the trading plan: Several measures and techniques, including returns, volatility, drawdowns, the Sharpe ratio, and maximum likelihood, can be used to evaluate the trading plan.
2. Enhancing the trading approach: A variety of methods and resources, including feature selection, model selection, parameter tuning, and machine learning, can be used to optimize the trading strategy.
3. Trading strategy optimisation: A variety of methods and instruments, including feature selection, machine learning, parameter tuning, and model selection, can be used to improve the trading strategy. Additionally, you can use a variety of constraints and criteria, such as robustness, risk, or performance, to optimize the trading strategy.
Turn your trading strategy into a success. Let Algocipher's bespoke trading bots do the heavy lifting. Get started today!
#algocipher #algocipherquantitative #quantfinance #tradingbot #bespoketradingbot #profitabletrading #profitabletradingstrategy


1
2
116

