


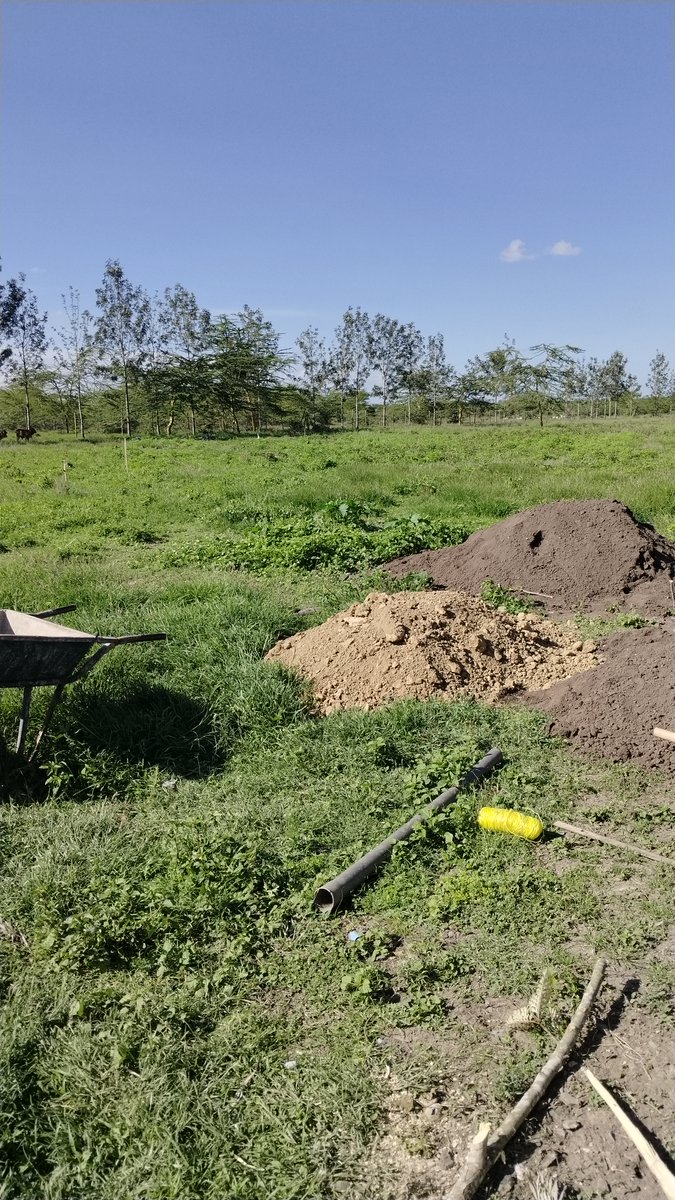
The groundwork for another successful project begins here.. 👨🔧🚛⚒️
At Build Mold Crafters Limited, we understand that successful execution begins with proper preparation.
#ConstructionKenya #Setup #ProjectStart #ConcreteWorks #BuildingKenya #BuildMoldCrafters
1
1
5
7,245

#すまいるとまいるアート旅
#ProjectstART
・美術館ワールド
・ワークショップワールド
・アートワールド紹介ワールド
楽しみ~
完成したらイベントでみんなで行きたいなぁ
noteやxも見てるから頑張ってください!!
2
107

We walked into a tough space with bare walls, dust everywhere and a giant rock in the middle, nothing welcoming yet but a challenge worth taking and a story ready to begin #TransformationJourney #BeforeAndAfter #InteriorMakeover #ProjectStart #DesignStory

1
2
38

27 Nov 2025
#Roadmap 🇳🇱
#Dogecoin ( $DOGE ) — Complete Roadmap 🧵
Van een meme-geïnspireerd grapje tot een wereldwijd erkende, door de community gedreven cryptocurrency, #Dogecoin heeft zich ongelooflijk snel ontwikkeld.
Hier is het volledige traject: Past → Present → Future
#CryptoRoadmap
📜 Past: Ontwikkeling & Lancering
Dogecoin begon als een leuk experiment door software-ingenieurs Billy Markus en Jackson Palmer, bedoeld om de serieuze speculatie in cryptocurrencies te ridiculiseren, geïnspireerd door de iconische “Doge”-Shiba Inu-meme.
Belangrijke mijlpalen:
🔹 Projectstart
De oprichters creëren Dogecoin als een fork van Litecoin, met nadruk op snellere transacties en lagere kosten, waardoor het populair wordt voor tipping en liefdadigheid online.
🔹 Community Groei
De munt krijgt een loyale aanhang die charitatieve initiatieven ondersteunt, zoals fondsenwerving voor Olympische teams en rampenhulp, en wordt een symbool van positieve online interactie.
🔹 Integratie op Exchanges
Dogecoin wordt op meerdere exchanges genoteerd, waardoor erkenning en gebruik worden uitgebreid en de culturele impact wordt versterkt.
🔹 Herlancering van de Foundation
De Dogecoin Foundation wordt heropgericht om de ecosysteemontwikkeling te ondersteunen, onder begeleiding van prominente adviseurs uit de crypto-wereld.
🔹 Open-Source Bijdragen
Tot 2024 levert de community actief bijdragen aan protocolverbeteringen en open-source tools, en stimuleert discussies over meme-gebaseerde assets en hun potentieel voor mainstream adoptie.
Impact:
De transitie van een luchtige meme-coin naar een wereldwijd erkende cryptocurrency met sterke community-focus en praktische toepassingen.
#DogecoinHistory
⚡ Present: Huidige Status & Ontwikkelingen
Dogecoin staat vandaag bekend om zijn robuuste, door de community gedreven ecosysteem, draaiend op een Proof-of-Work consensusmodel met snelle bloktijden en lage transactiekosten, ideaal voor dagelijkse betalingen en tipping.
Ecosysteemuitbreiding:
Tools zoals GigaWallet maken merchant-integraties eenvoudig, en voorstellen voor Layer-2 oplossingen zoals Dogechain introduceren smart contract-functionaliteit. Partnerschappen omvatten exchanges, sport-sponsoring en DeFi-platforms, gericht op praktische adoptie.
Technische Vooruitgang:
Upgrades omvatten de Libdogecoin v0.1.4-bibliotheek, met verbeterde beveiliging via YubiKey-integratie, ondersteuning voor secure enclaves en versnelde blockchain-prestaties voor bredere schaalbaarheid.
Governance & Incentives:
De gedecentraliseerde Dogecoin Foundation coördineert open-source projecten met input van bijdragers wereldwijd. Communityparticipatie leidt voorstellen en ecosysteemverbeteringen zonder centrale autoriteit.
Ecosysteemuitdagingen:
Ondanks schommelingen in adoptie en markcycli, zorgen sterke communitybetrokkenheid en doorlopende technische ontwikkeling voor lange-termijn veerkracht.
#DogecoinNu #CommunityDrivenCrypto
🚀 Future: Geplande Roadmap (2025–2030 )
De roadmap van Dogecoin richt zich op schaalbaarheid, duurzaamheid en real-world adoptie als wereldwijde betaaloplossing.
Belangrijke Richtingen:
🔹 Dogebox Lancering
Een gedecentraliseerd infrastructuursysteem waarmee bedrijven zelf-gehoste online winkels kunnen opzetten en Dogecoin-betalingen naadloos kunnen integreren, met beloningen voor lokale node-operators.
🔹 Project Sakura
Verkenning van een hybride Proof-of-Stake-model om energie-efficiëntie en bredere netwerkparticipatie te verbeteren, met testnets gepland voor eind 2025.
🔹 OP_CHECKZKP
Native zero-knowledge proof-functionaliteit om DeFi-toepassingen, gaming en identiteitsprotocollen mogelijk te maken.
🔹 Layer-2 Uitbreiding
Geavanceerde Layer-2-oplossingen voor interoperabiliteit met andere blockchains, ter verbetering van praktisch gebruik en schaalbaarheid.
🔹 Community & ESG Focus
Focus op merchant-adoptie, milieuvriendelijke consensusmechanismen en community staking, geleid door open-source bijdragen en DAO-achtige besluitvorming.
Impact:
Een volledig volwassen Dogecoin-ecosysteem dat wereldwijde betalingen ondersteunt, duurzaam opereert en brede community-gedreven innovatie stimuleert.
#DogecoinToekomst #DuurzameCrypto
✅ Conclusie
Dogecoin is uitgegroeid van een luchtig meme-experiment tot een wereldwijd erkende, door de community aangedreven cryptocurrency.
Met initiatieven zoals Dogebox, Project Sakura, Layer-2 uitbreidingen en gedecentraliseerd bestuur positioneert $DOGE zich als een toegankelijke, duurzame en praktische digitale valuta voor het internettijdperk.
#RoadmapConclusie
🛒 Zelf $DOGE kopen?
$DOGE is eenvoudig te kopen op #Bitvavo:
✅ Meer dan 400 #Altcoins beschikbaar
✅ Tot €100.000 #Accountgarantie
✅ Geregistreerd bij De Nederlandsche Bank (#DNB)
✅ Meld je aan via onderstaande link en handel tot €10.000 helemaal #Gratis!
🔗 bitvavo.com/invite?a=02D3B10…
#CryptoJournaal #AltcoinPedia #Bitcoin #Crypto #Exchange
📚 Handige bronnen en extra informatie
Wil je meer weten over #Dogecoin ( $DOGE )? Bekijk onderstaande officiële kanalen en documentatie:
🔹GitHub: github.com/dogecoin/dogecoin
🔹Reddit: reddit.com/r/dogecoin/
🔹Website: dogecoin.com/
🔹X (Twitter): x.com/dogecoin
⚠️ Belangrijke opmerking:
🔹 Deze post is puur bedoeld voor educatieve doeleinden en geen financieel advies!
🔹 Investeer alleen wat je bereid bent te verliezen!
-----------------
👇Volg ons👇
-----------------
🚨 Volg @CryptoJournaal – dé plek voor onafhankelijke crypto-informatie:
📰 Nieuws | 📊 Feiten | 🧠 Achtergronden | 🎓 Educatie
💬 Geen gesponsorde tokens
📜 Volledig MiCAR-compliant
🔍 Altijd kennis boven hype
📲 Sluit je aan via:
🌐 Website: cryptojournaal.online
📘 Facebook: facebook.com/cryptojournaal.…
💬 Telegram: t.me/ rzO9yxnGyUxhZjk0
👥 CryptoJournaal-AltcoinPedia Community: x.com/i/communities/18792293…
🐦 X-profiel: x.com/CryptoJournaal
#Altcoins #Bitcoin #CryptoNieuws #CryptoEducatie #CryptoKoersen

1
1
130

21 Nov 2025
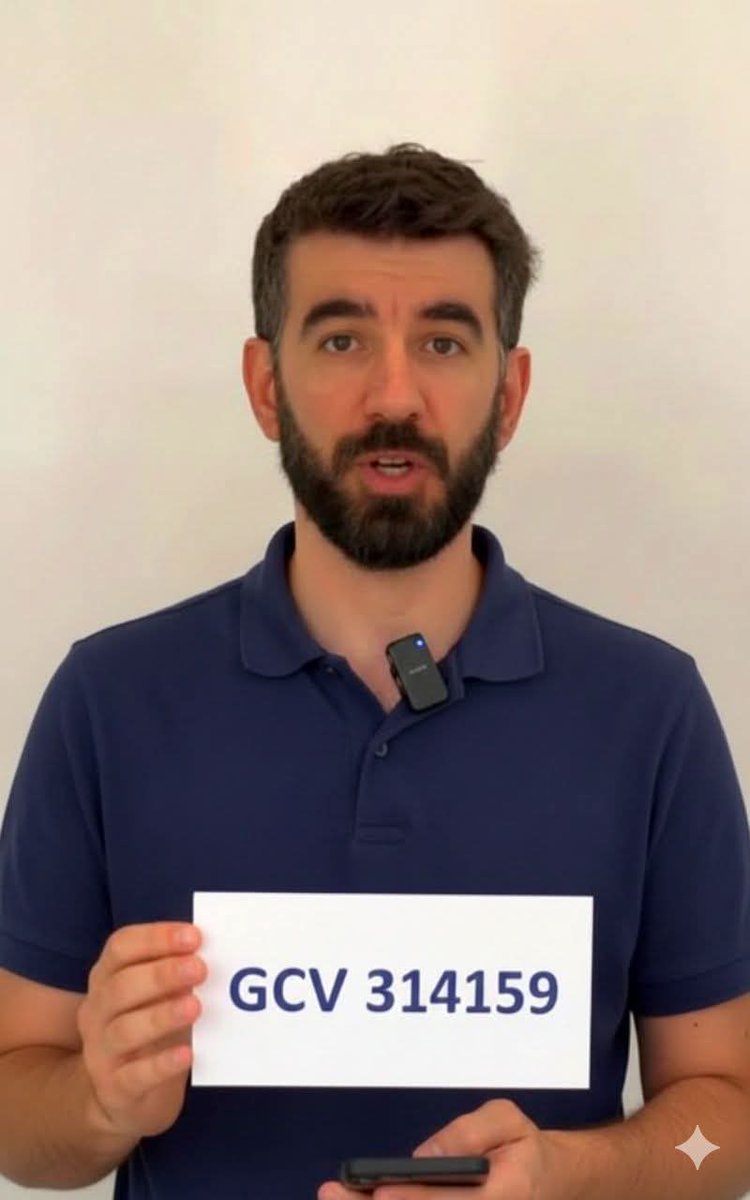
💪🥰Confirmed and ready. The next chapter begins! #GCV314159
#Ready #NextPhase #IdentityVerified #MovingForward #ProjectStart
1
6
32
658

31 Jul 2025
#ProjectstART
おはすま!定期更新です!
今回はうちの経営担当に文章をお願いしました。
ワールド情報、一つ解禁!!!
皆さん見てください!よろしくお願いします🙇♀️
31 Jul 2025

【8月報告】進捗報告と制作者インタビュー!|編集:かいとnote.com/smile7878/n/n152749…
1
1
10
848

10 Jul 2025
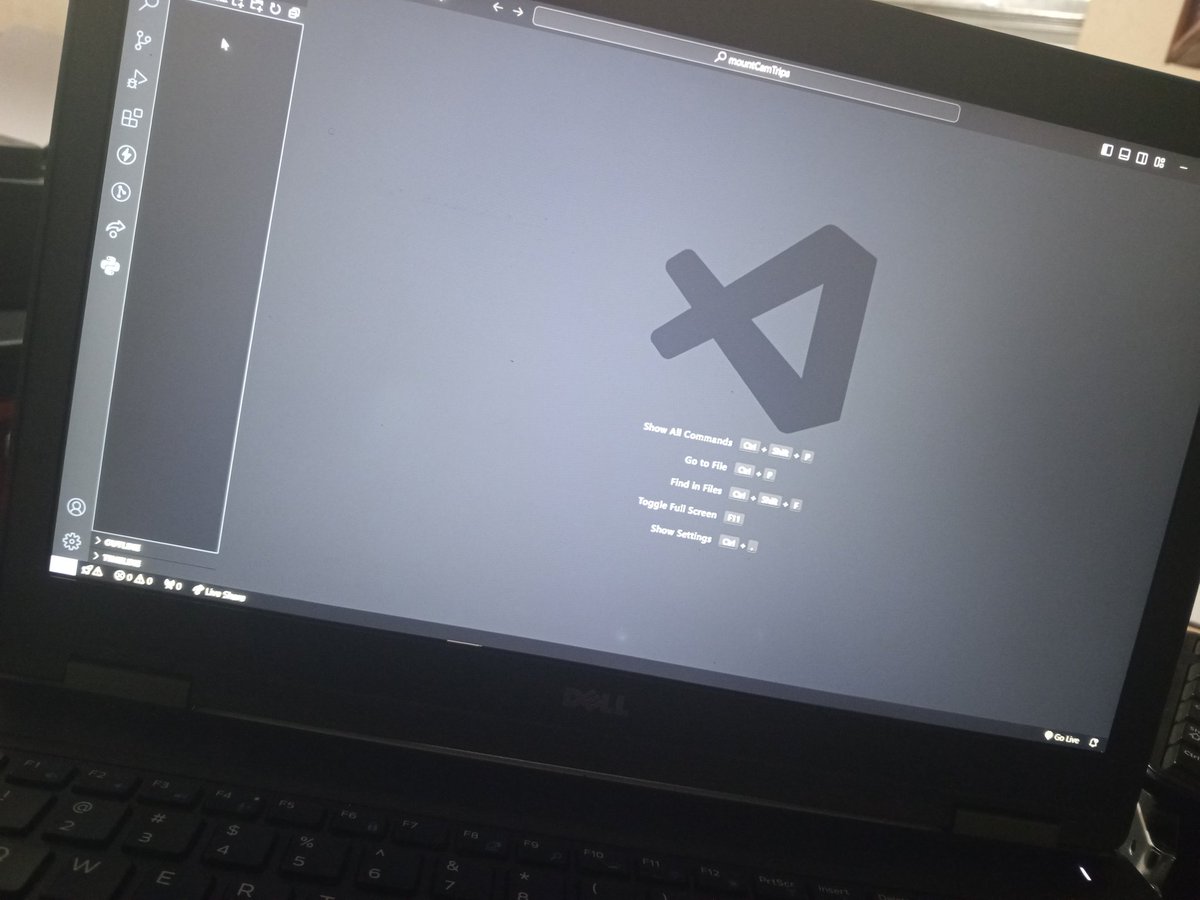
Project initiation mode activated! 👨🏽💻
My vs code is empty for now, but trust me, I can already imagine the complexity and beauty that'll unfold in the coming weeks
Can't wait to fill it up with code, files & folders
#newProject #ProjectStart #VSCode #CodingLife #CodingJourney
2
80

30 Jun 2025
#projectstART
7月の更新です!
いいねやアカウントフォローもよろしくお願いします🙇♀️
編集 すまいる
note.com/smile7878/n/n52dce5…
4
8
2,069

Starting my own project today
Day 1
Layout
Ui
Design
Tech stack planning
#projectstart
5
50

1 Jun 2025
【お知らせ】
スマイルさんが立ち上げたアートプロジェクト #projectstART にメンバーとして参加させていただくことになりました!
VRCを通して、アートを通じて、たくさんの人とつながりを持つことができて、とても嬉しいです!
今後の活動を要CHECK!🎨✨️🖼️
31 May 2025

《プロジェクトstART》設立のお知らせ
VRCにアートワールドを作りたい!そんな思いから、このプロジェクトを設立しました。今後の発信は@project__stART とnoteで行います。フォロー、応援よろしくお願いします!
プロジェクト設立のきっかけは?
noteをチェック⤵︎
note.com/smile7878/n/n5b91a5…

8
243

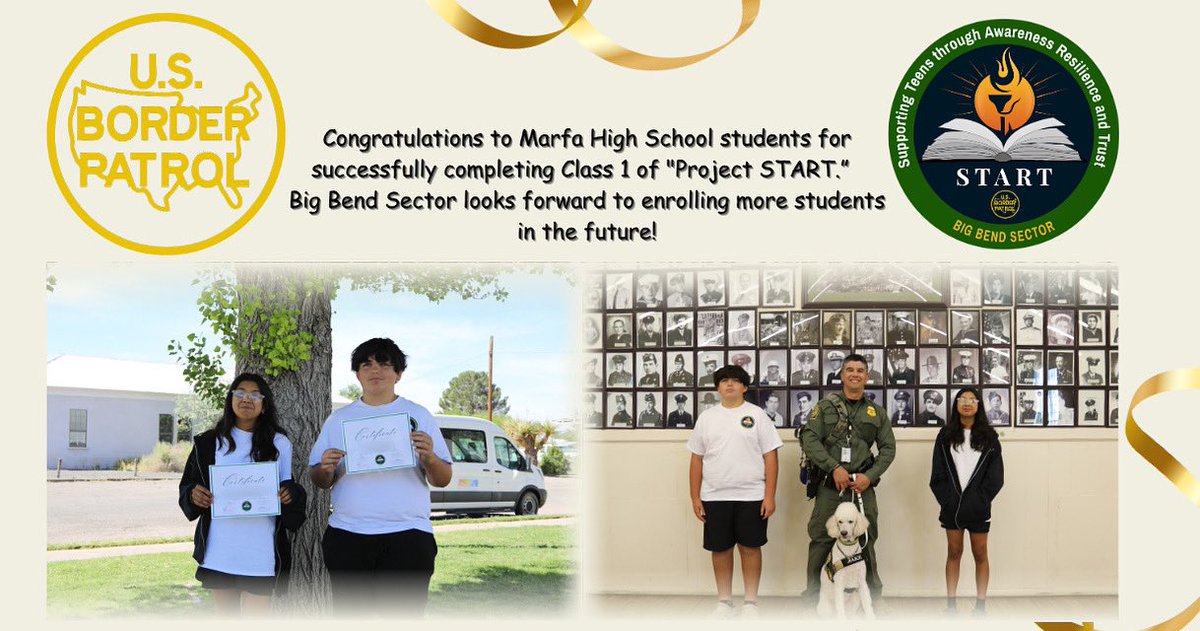
Congratulations to Marfa High School students for their successful completion of Class 1 of "Project START," a mentorship program aimed at youth ages 13-18 in the Big Bend region. #ProjectSTART #FutureLeaders #BPStrong #CBP #USBP #BorderPatrol #BigBend #WestTexas #HonorFirst
2
154

12 Mar 2025
3-day #kick-off meeting of #RI-Scale in #Amsterdam happening right now!
#kickoff #projectstart #researchinfrastructure
#AI #scalability #datasets

2
67

23 Jan 2025
Starting today, we will introduce you to the full story and story of the REDX Project! ✨Please look forward to our new challenge to expand the potential of Web3!
#REDX #Web3 #ProjectStart
1
3
510

23 Jun 2024
a trip to Miami @dennisnagpal1 ? for a projectstart of Charm? To meet such girls? ;D Maybe this or next week?
they exists here in an amount, I don't detected since my birth...
1
1
20

17 Apr 2024
Here are some #Pandas interview questions asked in top product based companies for entry level #Data_Analyst role:
1. Find all unique employee names who work in more than one department.
Sample DataFrame:
df = pd.DataFrame({'EmployeeName': ['John Doe', 'Jane Smith', 'Alice Johnson', 'John Doe'], 'Department': ['Sales', 'Marketing', 'Sales', 'Marketing']})
2. Calculate the monthly average sales for each product. Assume sales data is daily.
Sample DataFrame:
df = pd.DataFrame({'Date': pd.date_range(start='2023-01-01', end='2023-03-31', freq='D'), 'Product': np.random.choice(['ProductA', 'ProductB'], 90), 'Sales': np.random.randint(100, 500, 90)})
3. Identify the top 3 employees with the highest sales in each quarter.
Sample DataFrame:
df = pd.DataFrame({'Employee': ['John', 'Jane', 'Doe', 'Smith', 'Alice'], 'Quarter': ['Q1', 'Q1', 'Q2', 'Q2', 'Q3'], 'Sales': [200, 150, 300, 250, 400]})
4. Analyze the attendance records to find employees with more than 95% attendance throughout the year.
Sample DataFrame:
df = pd.DataFrame({'Employee': ['John', 'Jane', 'Doe'], 'TotalDays': [365, 365, 365], 'DaysAttended': [365, 350, 360]})
5. Calculate the monthly customer retention rate based on the transaction logs.
Sample DataFrame:
df = pd.DataFrame({'Month': ['Jan', 'Feb', 'Mar', 'Jan', 'Feb', 'Mar'], 'CustomerID': [1, 1, 1, 2, 2, 3], 'TransactionCount': [1, 2, 1, 3, 2, 1]})
6. Determine the average time employees spent on projects, assuming you have start and end dates for each project participation.
Sample DataFrame:
df = pd.DataFrame({'Employee': ['John', 'Jane', 'Doe'], 'ProjectStart': pd.to_datetime(['2023-01-01', '2023-02-15', '2023-03-01']), 'ProjectEnd': pd.to_datetime(['2023-01-31', '2023-03-15', '2023-04-01'])})
7. Compute the month-on-month growth rate in sales for each product, highlighting products with more than 10% growth for consecutive months.
Sample DataFrame:
df = pd.DataFrame({'Month': ['Jan', 'Feb', 'Mar', 'Jan', 'Feb', 'Mar'], 'Product': ['A', 'A', 'A', 'B', 'B', 'B'], 'Sales': [200, 220, 240, 150, 165, 180]})
8. Identify the time of day (morning, afternoon, evening) when sales peak for each category of products.
Sample DataFrame:
df = pd.DataFrame({'Category': ['Electronics', 'Clothing', 'Electronics', 'Clothing'], 'TimeOfDay': ['Morning', 'Afternoon', 'Evening', 'Morning'], 'Sales': [300, 150, 500, 200]})
9. Evaluate the distribution of workload among employees based on the number of tasks assigned in the last six months.
Sample DataFrame:
df = pd.DataFrame({'Employee': ['John', 'Jane', 'Doe'], 'TasksAssigned': [20, 25, 15]})
10. Calculate the profit margin for each product category based on revenue and cost data.
Sample DataFrame:
df = pd.DataFrame({'Category': ['Electronics', 'Clothing'], 'Revenue': [1000, 500], 'Cost': [700, 300]})
#pandas #dataanalyst
3
376

1 Mar 2024
🚀 Started a new project called "EasyRation" using Node.js and Express! Designed login/signup, OTP, and index pages today. Excited to bring this idea to life! 💻✨ #NodeJS #expressjs #webdev #ProjectStart
2
38

17 Feb 2024
Try saving this as a .txt file and run it as a macro in Audacity on any audio file above 2 mins length. Must be the English version 3, I think. (1/6)
(Copy to Editor:)
Select:End="30" Mode="Set" Start="0"
Delete:
Select:End="120" Mode="Set" RelativeTo="ProjectStart" Start="0"
2
2
987

15 Jan 2024
[Make It Monday] I havent started a cross stitch project in SO LONG so I have NO idea what I am doing. Let's waste time together!
#vtuber
#pngtuber
#crossstitch
#projectstart
#new
#sigh
twitch.tv/curavera
1
2
6
141