
Diamond Hands algo now supports a deterministic toolbelt for QuantAnalysis and trading for Risk, Backtesting, and Sentiment. (Sharpe, Sortino, OU, and GEX)
39

Jun 6
I left June 1 for some much needed time in nature, and came back to -17% btc price. Typical. But then I reviewed the data and saw some interesting things:
6 days ago BTC was at $73,884.
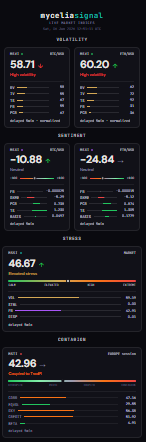
Mycelia's stress indices flagged elevated regime 7-10 hours BEFORE any price weakness occured.
May 31, 20:00 UTC: MSSI jumped 25 → 32 → 45 over three hours. MSVI climbed 22 → 34 in the same window. BTC still green or flat.
June 1, 06:00 UTC: BTC's first sustained down-hour. $73,350 → $73,136.
The decline ran six days straight. BTC bottomed near $59,400 on June 5 (so far), currently $60,900. -17.7% from peak.
MSXI sentiment exhausted at -50 around June 5 afternoon — textbook capitulation reading.
Today: sentiment recovered hard (MSXI -50 → -14, holding for hours). But MSVI just printed 63.4 — highest in the 24h window. Options market expanding fear premium, not compressing.
Sentiment-only recovery expanding IV often marks false bottoms. I'm watching closely.
Confirmation of bottom thesis: BTC > $61.5K AND MSVI < 50.
Refutation: BTC < $60K sustained. myceliasignal.com/docs/indic…
#btc #quantanalysis #btcsentiment #volatility
2
45

May 25
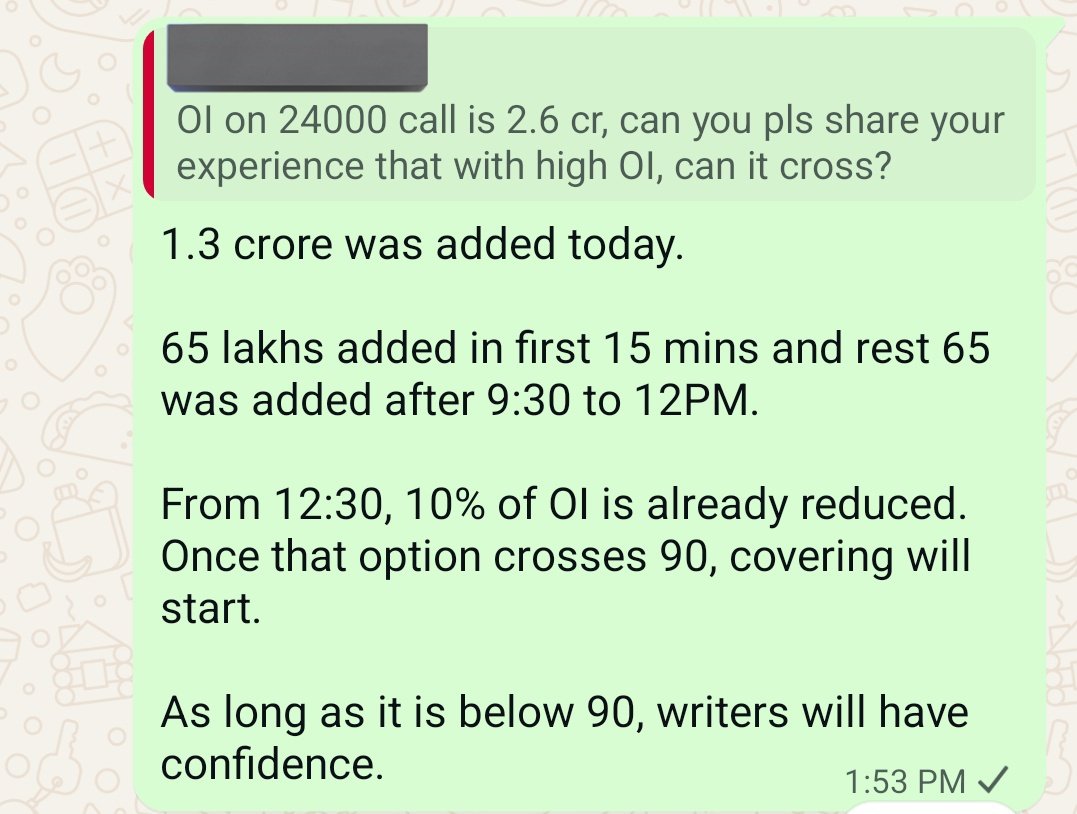
Conventional OI analysis teaches that highest OI strike acts as resistance.
But if it was that easy, everyone would have made money.
Dig deep to see who/when/where the writing happened.
#Nifty50 #QuantAnalysis #3DAnalysis
16
1,039

Apr 30
🚨 Hot PCE Print Meets Rising Stagflation Signals – Time to Reassess?
PCE data just came in hotter than expected, and the implications go well beyond the headline numbers.
Latest readings:
🔥 MoM PCE: 0.7%
🔥 MoM Core PCE: 0.3%
Both metrics remain ~50% above the Fed’s 2% target on a year-over-year basis. Yet 5Y5Y forward inflation expectations are still remarkably anchored near 2%. The Fed left the funds rate unchanged yesterday, but the commentary made one thing clear: not every FOMC member is comfortable with further easing right now.
Energy prices have played a role, but the deeper drivers of persistent inflation appear to be structural—ongoing money supply growth and fiscal deficits that continue to outpace revenue. Supply shocks tend to be disinflationary over time as they squeeze consumer purchasing power and eventually force companies to cut prices. The more durable challenge is stagflation risk.
My proprietary high-frequency Dynamic Z-Score Model (see chart below) is currently printing 41.7% — firmly inside the transition zone and flashing yellow once again.
In a true stagflation regime, both stocks and bonds can struggle simultaneously. Long-duration bonds, in particular, lose their traditional diversification benefit and can become a source of volatility. Many investors have never navigated even a mild stagflationary environment, and real assets (which have historically performed well during high inflation volatility) remain under-allocated in most portfolios.
With a new Fed Chair potentially stepping in this summer, the task of holding the funds rate steady while inflation re-accelerates will be anything but straightforward.
How are you positioning for this regime?
Are you tilting toward real assets, shortening duration, or staying the course? I’d love to hear your thoughts in the comments.
#Stagflation #Inflation #FedPolicy #PortfolioConstruction #QuantAnalysis #RealAssets
This is not investment advice. Past performance is not indicative of future results. All views are my own and for informational purposes only.

1
2
663

Apr 13
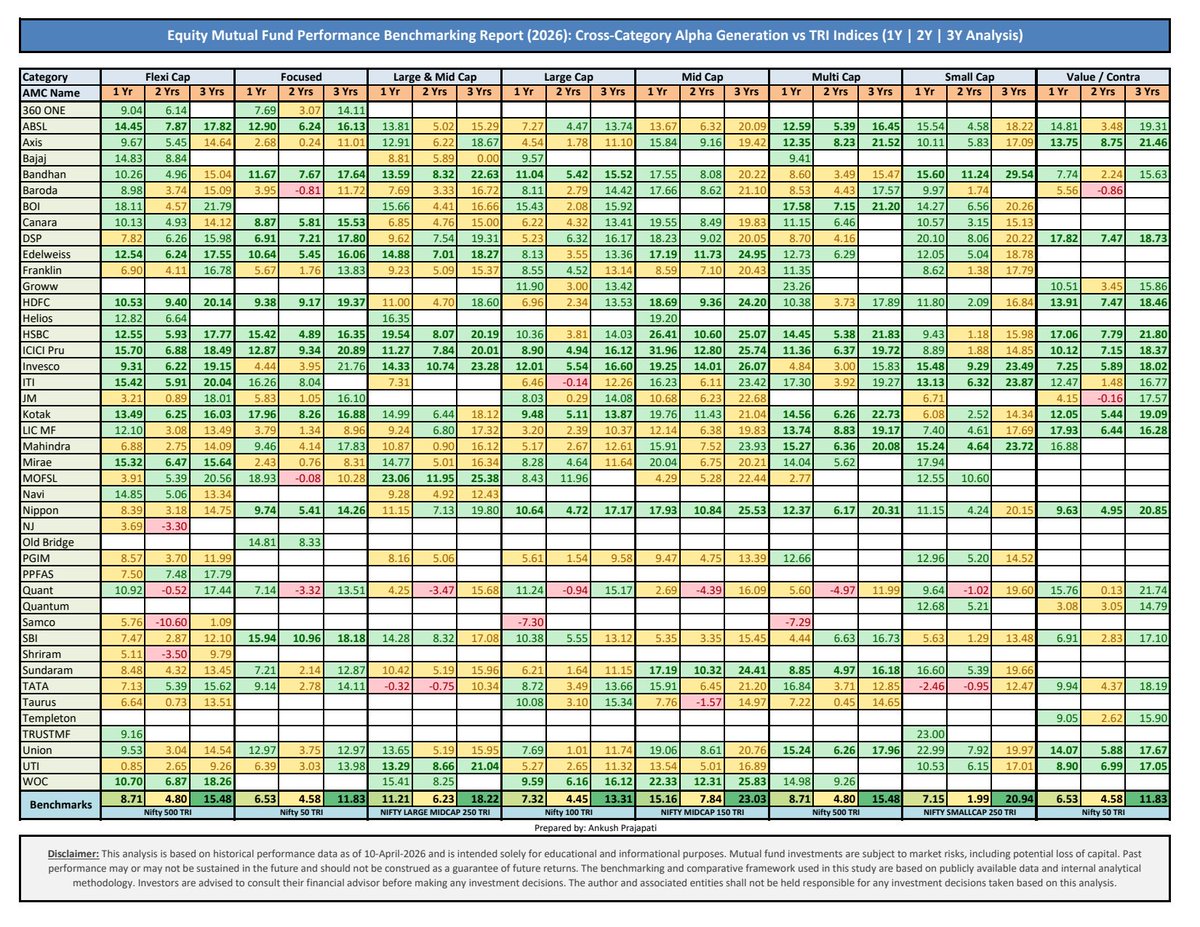
A multi-category, multi-period performance matrix comparing equity mutual funds against their respective TRI benchmarks:
📌 Benchmark Framework:
Nifty 100 TRI
Nifty 500 TRI
Nifty 50 TRI
Nifty LargeMidcap 250 TRI
Nifty Midcap 150 TRI
Nifty Smallcap 250 TRI
📊 Outcome:
Clear identification of alpha persistence vs mean reversion
Evidence of category-specific inefficiencies
Differentiation between beta-driven and skill-driven returns
PDF research access:
Telegram: t.me/ MVCmKWU5l6BiYzFl
#QuantAnalysis #MutualFundResearch
1
7
26
1,637

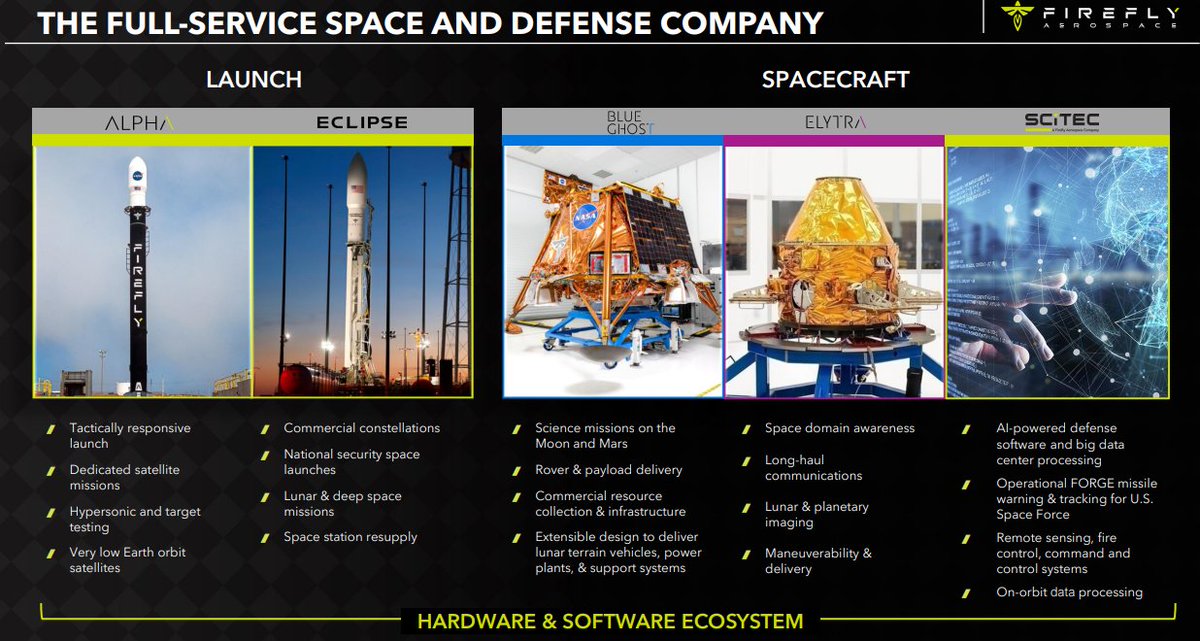
THE FIREFLY MANIFESTO $FLY: The Architecture of Orbital Dominance
If you are comparing Firefly Aerospace ($FLY) to Rocket Lab ($RKLB) based on launch frequency alone, you are making a rookie mistake.
It is like comparing a logistics trucking company to a hybrid of Palantir and Lockheed Martin.
Here is the brutal fundamental analysis of why the current $6.1B Market Cap is a significant market mispricing.
1⃣Revenue Segmentation: Software-First, Hardware-Second
Retail investors see the Alpha rocket. Smart Money sees SciTec.
➡️The SciTec Engine:
The acquisition of SciTec (completed late 2025) transformed $FLY into a data titan.
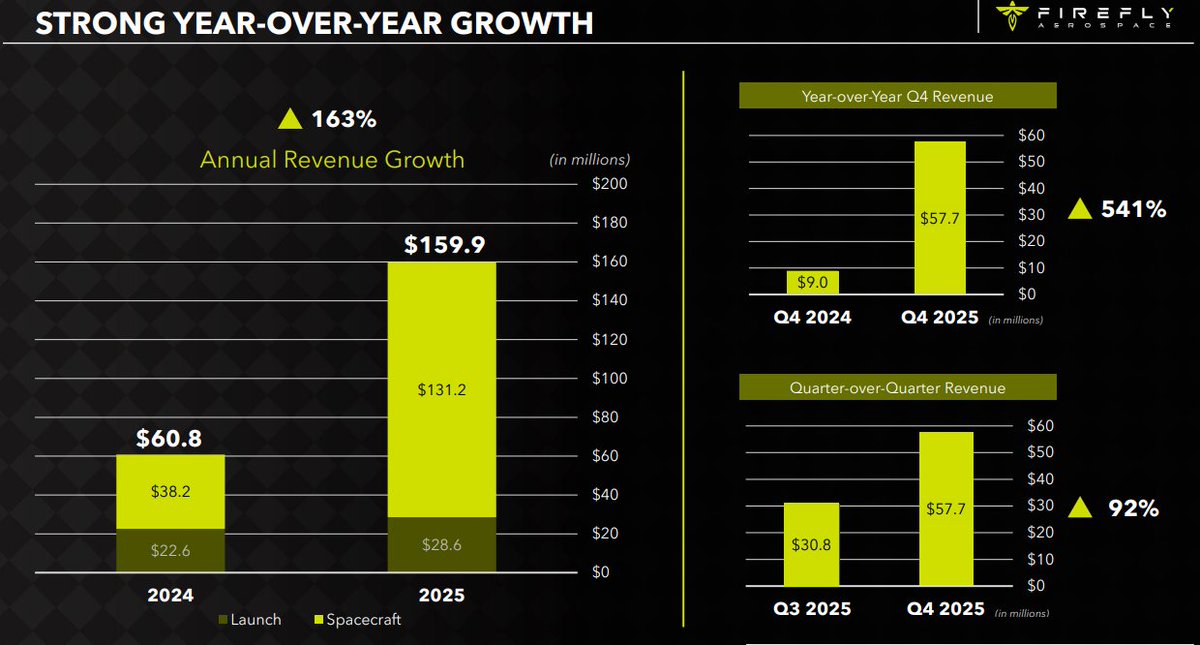
In the March 2026 10-K filing, Firefly reported record annual revenue of $159.9M ( 163% YoY).
➡️Margin Expansion:
The secret is in the mix. Revenue from Spacecraft Solutions (Defense SaaS) carries gross margins of 60-65%, while "pure launch" is a capital-intensive battle for 20-30%.
➡️The FORGE Monopoly:
$FLY is the prime contractor for the US Space Force’s FORGE program.
They are the first new player in 50 years to break the duopoly in Overhead Persistent Infrared (OPIR) missile warning systems.
2⃣NVIDIA x Firefly: The April 8, 2026 Breakthrough
Yesterday’s announcement of a formal collaboration with NVIDIA to power the Ocula lunar imaging service is a fundamental game-changer.
➡️Orbital Edge Computing:
By embedding NVIDIA Jetson modules into the Elytra orbital vehicle, Firefly enables AI-driven image processing directly in lunar orbit.
➡️Solving the Bottleneck:
Instead of downlink-heavy raw data, $FLY transmits "actionable insights" in real-time.
This bypasses the massive bandwidth constraints of deep space, making $FLY the only provider of real-time intelligence in the cislunar domain.
3⃣2026 Outlook: Numbers that Demand Authority
The FY2026 guidance is a "hawkish" signal to the street:
➡️Revenue Target:
Management is guiding $420M – $450M.
That is a nearly 3x jump year-over-year.
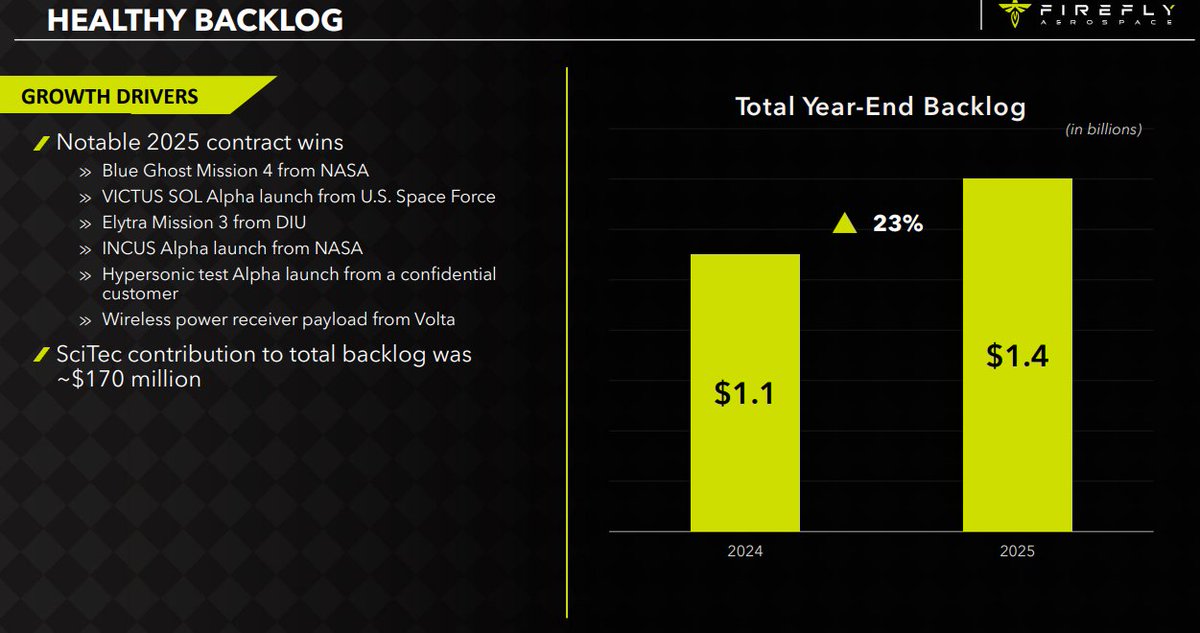
➡️The $1.4B Backlog:
This is a "hard" backlog, 90% anchored by Tier-1 government contracts (Space Force, NASA, NRO).
These aren't MOUs; they are contracted cash flows.
➡️Cash Runway:
With $893M in cash (as of Q4 2025), Firefly has the capital to reach operational break-even (est. 2027/28) without aggressive shareholder dilution.
4⃣ Tactical Doctrine: The "Victus Haze" Moat
In the contested space environment of 2026, the U.S. doesn't just need "cheap" launches; it needs Tactically Responsive Space (TRS).
Firefly is the only player in the 1200kg class certified for 24-hour "call-to-orbit" readiness.
The upcoming Victus Haze mission (June 2026) will prove that $FLY can replace a compromised intelligence satellite in a single day.
This is a "National Security Moat" that competitors cannot replicate with current hardware.
5⃣Lunar Dominance: Blue Ghost is a Platform, Not a Mission
With Blue Ghost Mission 2 slated for late 2026, $FLY owns the Lunar Supply Chain.
By controlling the Launcher (Alpha), the Transfer Vehicle (Elytra), and the Lander (Blue Ghost), they have eliminated the "middleman margin" that plagues other space startups.
The success of Mission 1 (first commercial company to complete 14 days of lunar operations) has already de-risked the platform for institutional backers.
⬇️ANALYTICAL VERDICT
The market is pricing $FLY based on "Launch Risk" (Hardware). Institutional data points to a Defense-Tech Scale-up.
Valuation Misalignment: $RKLB (MC ~$36B) vs. $FLY (MC ~$6B). While RKLB has higher absolute revenue, $FLY's software-heavy mix warrants a higher P/S multiple as it scales.
M&A Potential: At $6B, $FLY is the cheapest way for a Defense Prime (Northrop Grumman/Lockheed) to buy immediate orbital AI supremacy.
Bottom Line: You aren't investing in $FLY for the rockets. You are investing in the dominance of strategic data processing at the new frontier of U.S. national security.
#FireflyAerospace #FLY #SpaceIntelligence #NvidiaSpace #DefenseTech #QuantAnalysis #SpaceEconomy2026 #AlphaRocket #SciTec #LunarAI

What a day for the space sector! 🚀
Yesterday I mentioned how a potential SpaceX IPO could provide a massive boost to the entire industry and today, the boards are glowing green.
We aren't talking about 2-3% moves here; this is a full-scale breakout.
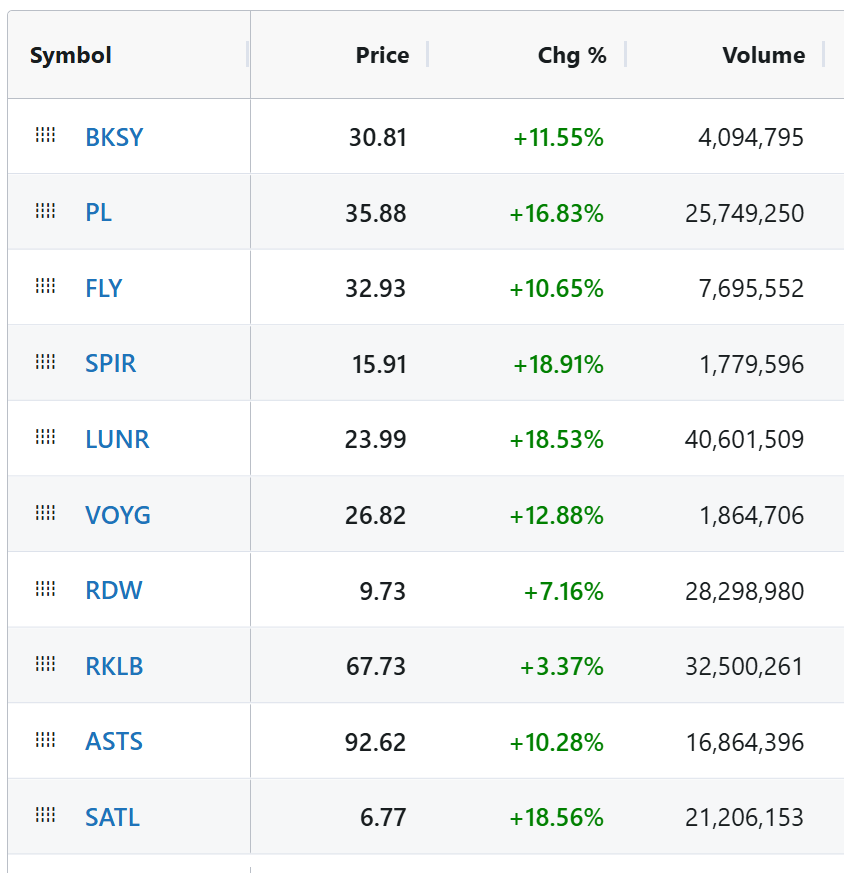
Just look at these numbers:
$SPIR 🟢 18.91%
$SATL 🟢 18.56%
$LUNR 🟢 18.53%
$PL 🟢 16.83%
$VOYG 🟢 12.88%
$BKSY 🟢 11.55%
$FLY 🟢 10.65%
$ASTS 🟢 10.28%
$RDW 🟢 7.16%
$RKLB 🟢 3.37%
The momentum is real.
Tomorrow I’ll be back with my first full report.
Stay tuned!
Quick question for you guys:
Which company do you want to see covered first?
The one that gets mentioned the most in the comments will be the first one I dive into! 👇
#SpaceEconomy #Investing #SpaceX #Stocks
7
11
66
26,963

Feb 28
🔥 ELITE QUANT PRO — ORACLE SIGNAL
$SOL | SHORT @ 90.4% confidence
📊 Entry: $78.7400
🎯 TP1: $67.2792
🎯 TP2: $58.1105
🛡️ SL: $86.3805
Powered by Elite Oracle Signal Engine v1.0
#EliteQuant #SOL #QuantAnalysis #CryptoTrading
1
110

Bitcoin is showing one of the most polarized setups of the cycle right now.
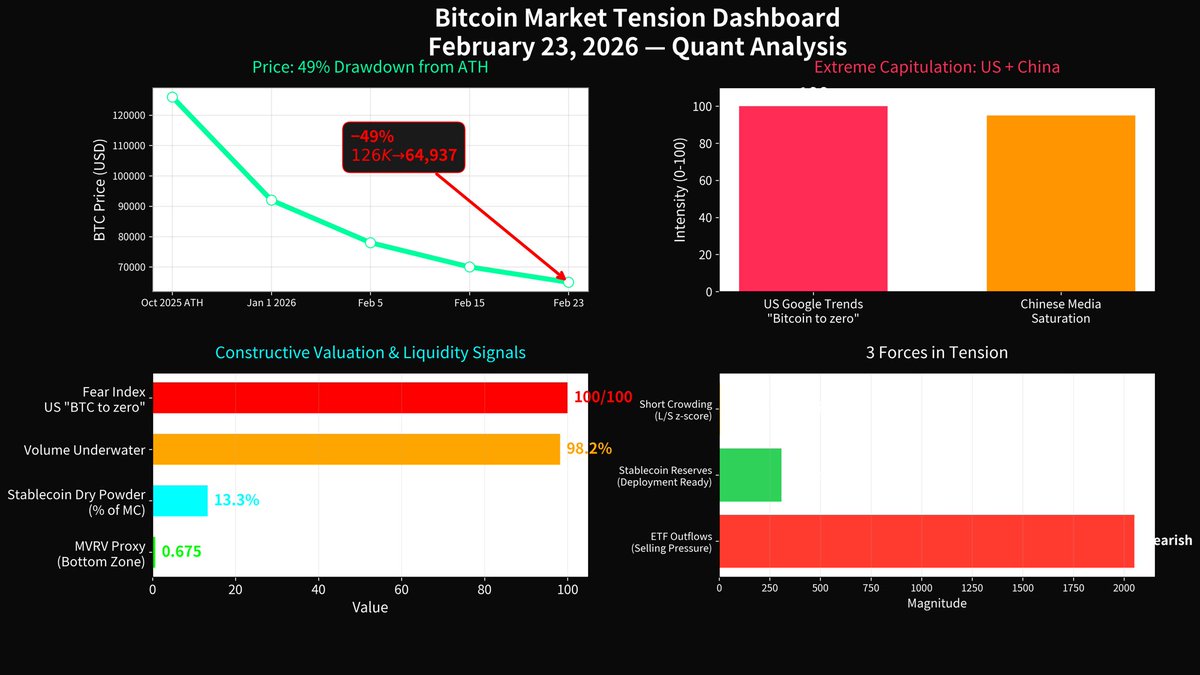
BTC is trading at $64,937 (February 23, 2026).
On the surface, sentiment is in full capitulation: Searches for “Bitcoin to zero” hit the absolute maximum of 100/100 on Google Trends in the United States — highest since the 2022 bottom. Chinese financial media, Weibo and WeChat are saturated with “比特币归零” narratives. Retail exhaustion is clear.
Yet the underlying data reveals a high-tension setup:
• MVRV Proxy at 0.675 — deep in the historical cycle-low zone where major bottoms have repeatedly formed. • 98.2% of recent on-chain volume currently underwater. • Stablecoin dry powder at $307.6 billion (13.3% of total crypto market cap) sitting near notable deployment levels. • Extreme short crowding across derivatives markets, with IV term structure in sharp backwardation — classic acute panic, not structural collapse.
We’re seeing sustained ETF selling pressure, but also the exact combination that has preceded meaningful relief rallies in prior cycles: maximum fear across the dominant English-speaking and Chinese markets coinciding with historically attractive valuation metrics and substantial sidelined liquidity.
This is not a prediction — it’s a clear observation of the current market tension.
See the full professional dashboard attached
When extreme capitulation meets constructive structural signals, the market often prepares for a regime shift. The only question is timing and confirmation.
Not calling the bottom. Simply reporting what the numbers are showing with unusual clarity.
What stands out most to you — the fear or the metrics underneath?
Serious insights only.
#Bitcoin #BTC #Crypto #QuantAnalysis #MarketSentiment #BTCAnalysis
1
1
2
74

📈 | Data Insights
📍 Core Dynamics:
• Supreme Court invalidated Trump's tariffs, potentially boosting retailers like Home Depot, Nike, and Target due to reduced import costs. This offers a clear tailwind for consumer-facing businesses.
• Average tax refunds surged 14%, indicating increased consumer purchasing power. Bank of America suggests this influx could benefit various stocks as taxpayers spend or save these larger sums.
• Dow Jones is nearing 50,000, signaling robust market momentum. Traders are eyeing options strategies to capitalize on a potential breakout above this significant psychological and technical level.
📉 Key Metrics:
• S&P 500: 6909.51; Nasdaq: 22886.07; Dow Jones: 49625.97; VIX: 19.09
• The VIX remains elevated near 19, suggesting lingering market caution despite recent index gains. Meanwhile, the Dow's proximity to 50,000 highlights strong upward trajectory but also potential resistance.
🧠 Alpha Insights:
Key rulings and consumer spending tailwinds are propelling market indices, while AI infrastructure and specific sector plays offer continued upside amidst a cautious volatility environment.
🔗 Sources:
• cnbc.com/2026/02/20/supreme-…
• cnbc.com/2026/02/20/these-st…
• cnbc.com/2026/02/20/the-dow-…
#MarketUpdate #StockMarket #Tariffs #TaxRefunds #DowJones #VIX #AI #QuantAnalysis
📈 | 數據洞察
📍 核心動態:
• 最高法院裁定川普關稅不合法,可能因進口成本降低,提振家得寶、耐吉、塔吉特等零售股,為消費型企業帶來明確順風。
• 平均退稅額激增14%,顯示消費者購買力增強。美國銀行預期,這筆額外資金無論用於消費或儲蓄,都可能使多檔股票受惠。
• 道瓊指數逼近50,000點,預示市場動能強勁。交易者正密切關注期權策略,以捕捉突破此重要心理與技術關卡的潛在機會。
📉 關鍵指標:
• 標普500: 6909.51; 那斯達克: 22886.07; 道瓊指數: 49625.97; VIX: 19.09
• VIX指數維持在19附近高位,儘管指數近期上漲,仍顯示市場存在謹慎情緒。同時,道瓊逼近50,000點,凸顯上升趨勢但也可能面臨阻力。
🧠 Alpha 洞察:
關鍵裁決和消費支出順風推動市場指數,而AI基礎設施和特定板塊在謹慎波動環境中持續展現上漲潛力。
1
48
📈 | Data Insights
📍 Core Dynamics:
• Mizuho upgrades Palantir, says AI demand makes recent sell-off ‘unjustifiable’.
Mizuho projects a 47% rally for PLTR, emphasizing strong AI sector demand countering recent price drops.
📉 Key Metrics:
• VIX: 20.09
The VIX indicates moderate market volatility, suggesting investors are weighing AI growth against broader market uncertainties.
🧠 Alpha Insights:
AI-driven growth stories continue to attract conviction buys from analysts despite recent sector pullbacks.
🔗 Sources:
• cnbc.com/2026/02/18/mizuho-u…
#AI #Palantir #StockMarket #QuantAnalysis
📈 | 數據洞察
📍 核心動態:
• Mizuho 因 AI 需求升級 Palantir,稱近期拋售「不合理」。
Mizuho 預計 Palantir 股價將反彈 47%,強調 AI 需求強勁,抵銷近期股價跌幅。
📉 關鍵指標:
• VIX: 20.09
VIX 指數顯示市場波動中等,反映投資者權衡 AI 成長潛力與廣泛市場不確定性。
🧠 Alpha 洞察:
儘管近期板塊回調,AI 驅動的成長股仍獲分析師堅定買入。
2
24
📈 | Data Insights
📍 Core Dynamics:
• AI disruption fears are causing sell-offs in several sectors, including media and software, but simultaneously, hyperscalers are boosting AI spending by 70% to $600B, driving opportunities.
• Consumer staples and utilities are rallying strongly in 2026, with top analysts recommending dividend stocks for consistent income amid market rotation.
Fears of AI impact are creating volatility, causing dips in names like Microsoft and Shopify, yet also spurring significant investment in AI infrastructure, presenting a complex landscape for investors to navigate.
The market shows a clear shift towards defensive and value-oriented sectors. This indicates a flight to safety and reliable income sources, as investors seek stability amidst broader tech sector adjustments and AI-driven uncertainty.
📉 Key Metrics:
• S&P 500: 6836.17, Nasdaq: 22546.67, Dow Jones: 49500.93, VIX: 20.60
The VIX at 20.60 reflects moderate volatility, aligning with mixed market sentiments where major indices are robust, but sector-specific uncertainties persist, especially regarding AI's long-term impact on various industries.
🧠 Alpha Insights:
Market presents a bifurcated opportunity: selectively buy dips in high-quality AI-affected stocks and embrace resilient income-generating value sectors.
🔗 Sources:
• cnbc.com/2026/02/15/consumer…
• cnbc.com/2026/02/12/top-hype…
#MarketInsights #AIInvestment #DividendStocks #ValueInvesting #TechStocks #Volatility #QuantAnalysis
📈 | 數據洞察
📍 核心動態:
• 人工智慧顛覆擔憂導致多個板塊拋售,包括媒體和軟體,但同時,超大規模雲服務商將AI支出提高70%至6000億美元,帶來機會。
• 2026年,消費必需品和公用事業板塊強勁反彈,頂級分析師推薦股息股,以在市場輪動中提供穩定收入。
對AI影響的擔憂正造成市場波動,導致微軟、Shopify等股價下跌,但同時也刺激了AI基礎設施的大量投資,為投資者帶來複雜局面。
市場明確轉向防禦性和價值導向型板塊。這表明在科技板塊調整和AI不確定性中,投資者正尋求安全和可靠的收入來源。
📉 關鍵指標:
• 標普500指數: 6836.17, 那斯達克指數: 22546.67, 道瓊指數: 49500.93, VIX恐慌指數: 20.60
VIX指數20.60反映中等波動性,市場情緒複雜。主要指數穩健,但AI對特定行業長期影響的不確定性仍持續存在。
🧠 Alpha 洞察:
市場呈現兩極化機會:選擇性逢低買入受AI影響的優質股,並擁抱具韌性的創收型價值板塊。
2
26

Jan 30
Gold: The "Safe Haven" that finally woke up... only to see Bitcoin at the finish line. 🏛️💤
Huge congrats to the Gold bugs! Since 2011, your favorite shiny rock skyrocketed from $1,400 to over $5,400. That’s a 289% return! You officially beat inflation and maybe bought a nice watch. 🥂
Meanwhile, back in the 21st century:
Bitcoin delivered a "slight" 10,500,000% return in the same period.
While Gold was struggling to triple, BTC was busy becoming the most liquid asset on Earth, dominating price discovery on Hyperliquid.
Gold is a great way to stay rich if you're already a billionaire. Bitcoin is how you get there. 🛡️📈
#Bitcoin #Gold #QuantAnalysis #Hyperliquid #BTC #FinancialFreedom $BTC $PAXG

3
45

Jan 26
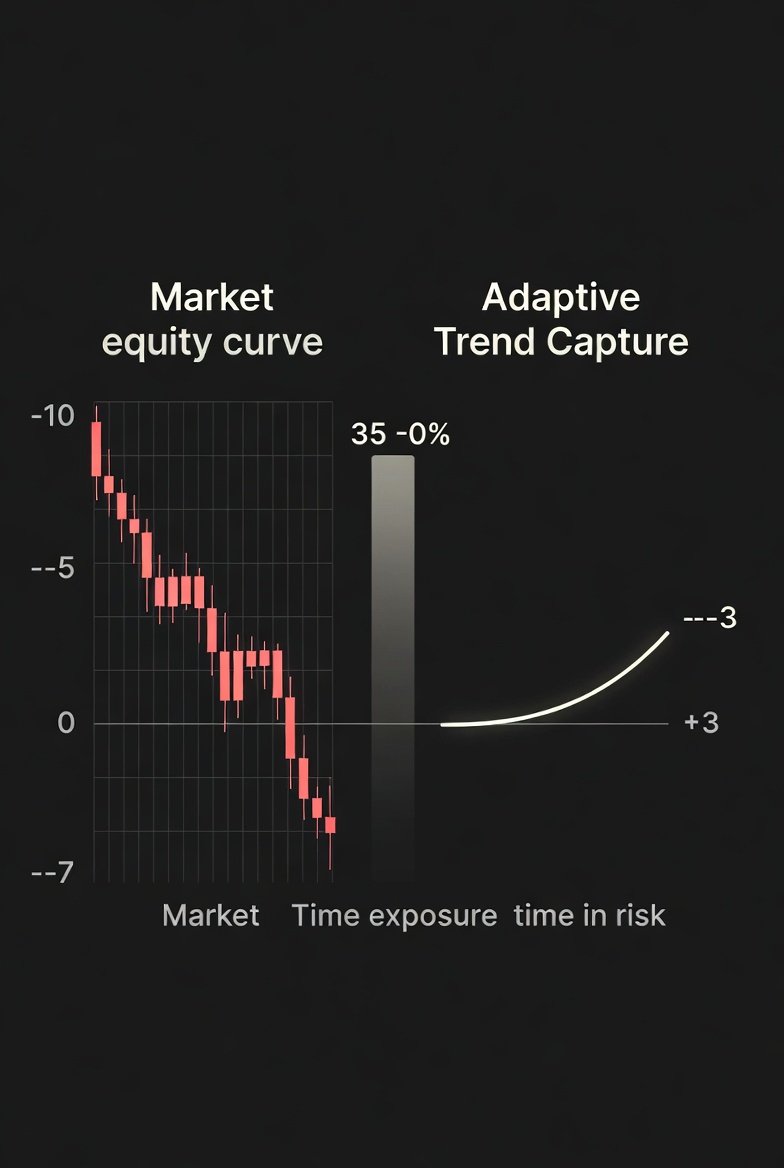
Over the last month a modeled run of the @multiplifi Adaptive Trend Capture strategy would show a structurally different performance curve versus the market. While the benchmark absorbed an estimated minus 7 to minus 10 percent drawdown from volatility expansion and failed continuation the strategy would aim for a plus 2 to plus 4 percent net return. Maximum drawdown would stay near 3 percent driven by volatility filters and fast de risk rules. Market exposure would be active only 35 to 40 percent of sessions which reframes performance away from win rate and toward time weighted risk efficiency. The strategy edge is not higher accuracy but the removal of the worst 20 percent of market days which historically generate the majority of aggregate losses. Over this month alpha would come from when not to trade rather than how often to be right.
#QuantAnalysis #CryptoMarkets
8
8
194

AILYTIS AIE Engine: AI Capital Flow
AIE uses neural networks for 24/7 data-driven growth and millisecond-level precision.
#AI #Fintech #ComputingPower #BigData #QuantAnalysis #SmartAlgorithm #TechDriven #RiskManagement

9
1
21
672

8/8: We are watching a potential regime change in real-time. The risk/reward here is asymmetric in favor of the metal.
If the breakout holds, silver may give wild move.
#Silver #SPX #Commodities #Investing #MacroEconomics #QuantAnalysis
2
273

Jan 6
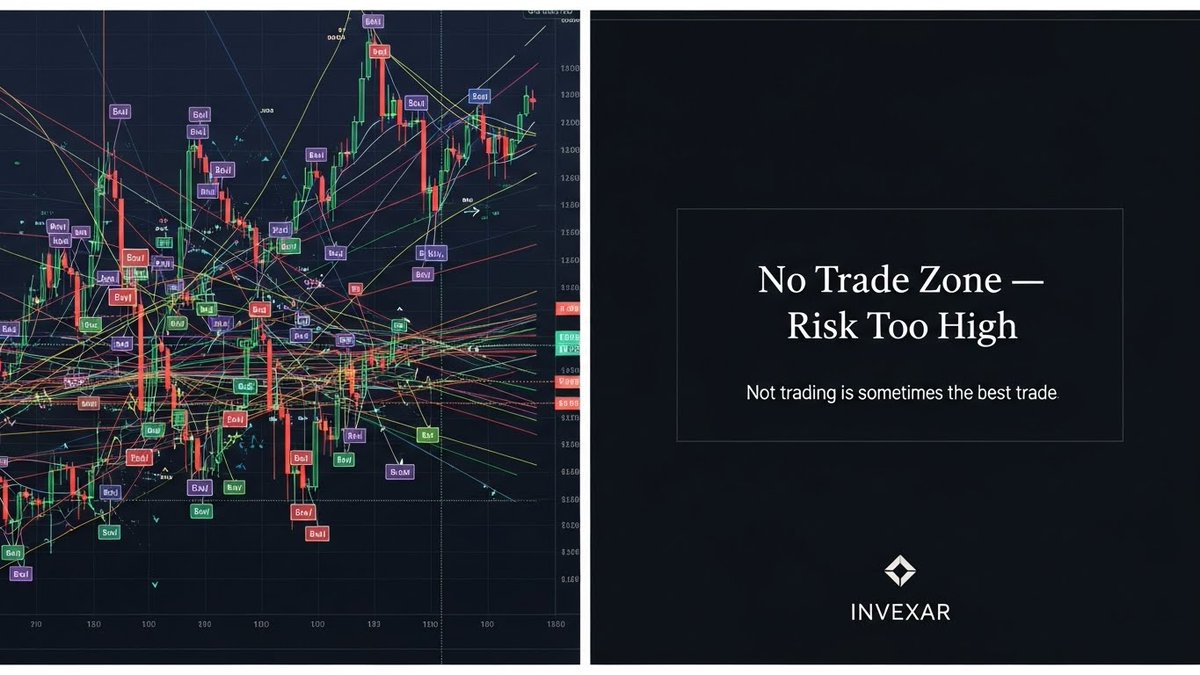
Most traders don’t lose money from bad setups.
They lose money from too many setups.
Overtrading feels productive.
In reality, it’s fear and impatience wearing a mask.
#Invexar #AITrading #Overtrading #QuantAnalysis #TradeSmart #CryptoDiscipline #StockMarketMindset #TradingWith
3
2
16

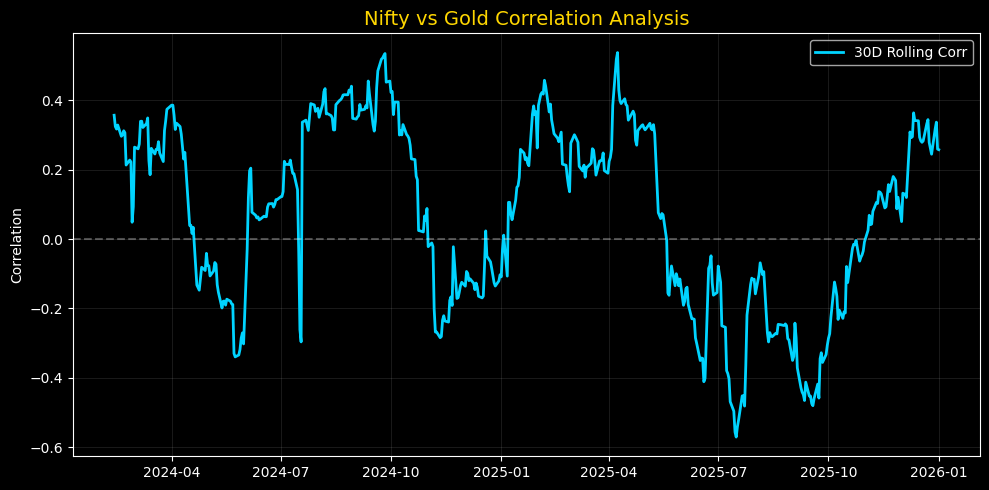
Quant Alert: Nifty vs Gold 📉
Correlation is at a critical 0.35. Equities and Gold moving together suggests high uncertainty. Mean Reversion is likely; expect a sharp trend reversal. Stay cautious!
#KrishnaXtrade #QuantAnalysis #GOLD #Nifty50
1
4
133

Jan 2
Assets don't move in isolation. They move in symphonies.
While you stare at one chart, @ParadyzeFi is analyzing a 50x50 Correlation Matrix in real time on @injective .
The AI detects "Sympathy Plays." If Token A (Leader) breaks out, it statistically calculates which Token B (Laggard) has a 90% correlation but hasn't moved yet.
It buys Token B milliseconds before the crowd realizes the connection.
This is Statistical Lag Arbitrage. You aren't guessing the future; you are trading the echo of the present.
$INJ #CorrelationMatrix #PairTrading #SympathyPlays #QuantAnalysis #DataScience

Jan 1

Amateurs trade price. Pros trade Volatility.
Before major events, Implied Volatility (IV) spikes due to fear. Options become expensive. After the event, IV crashes. This is a predictable cycle.
@ParadyzeFi empowers users to execute IV Harvesting strategies (like Short Straddles or Iron Condors) on @injective ’s derivative layer.
The AI identifies when Volatility is "overpriced" relative to historical moves. It sells the premium to fearful traders and buys it back cheaper when the dust settles.
You are essentially selling insurance to the market during a storm. It’s one of the most profitable strategies in finance.
$INJ #ImpliedVolatility #IVCrush #OptionsTrading #ShortVol #QuantStrategies

243
178
1,114
4 Dec 2025
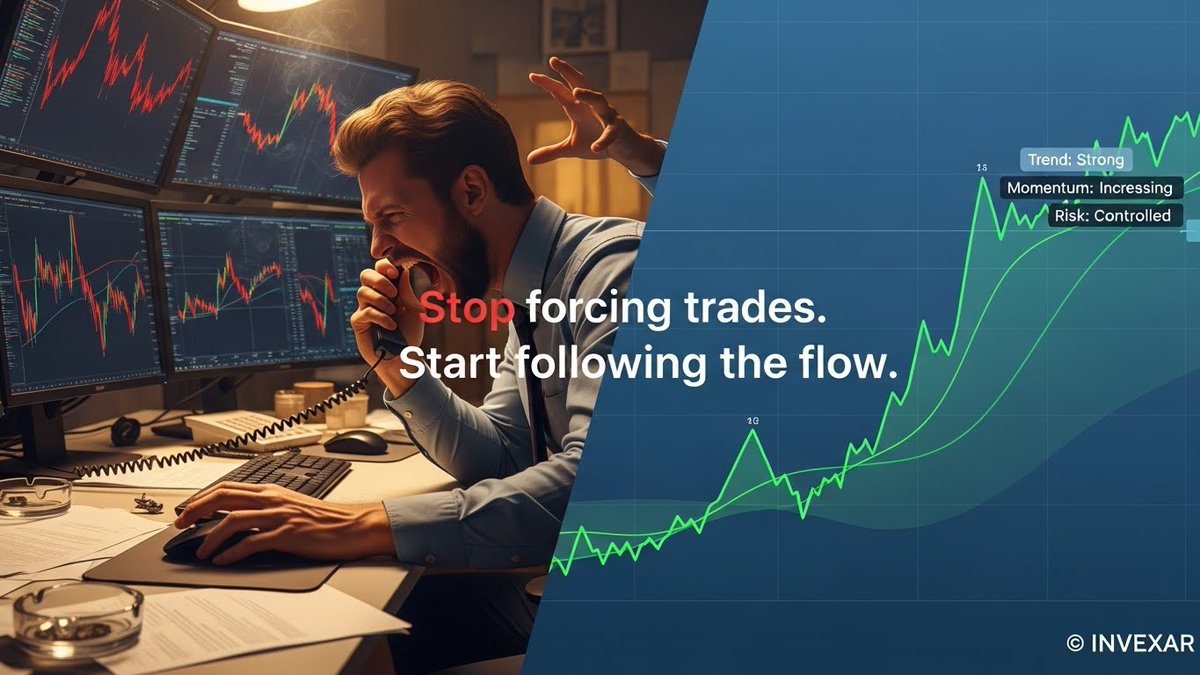
Traders lose money because they try to force the market to move their way.
But the market doesn’t bend to emotions or opinions.
It moves based on data, liquidity, and sentiment.
#Invexar #AITrading #MarketFlow #CryptoInsights #QuantAnalysis #StockMarketMindset #TradeSmart
3
2
16

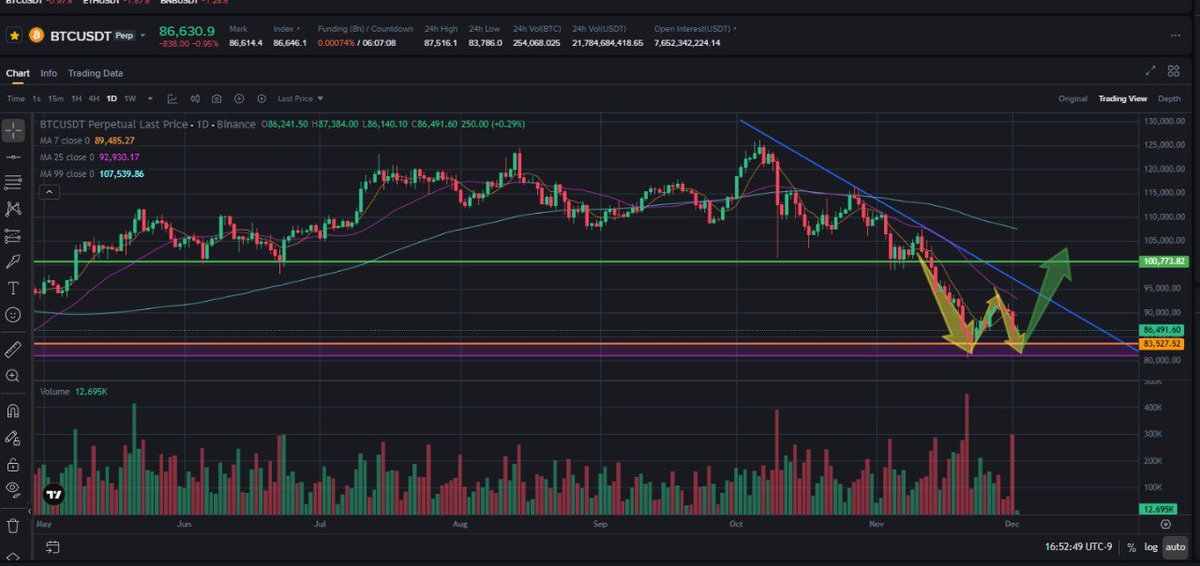
The technical structure analysis released on December 1st has been fully validated:
BTC's W-bottom pattern broke out as expected, with price action highly consistent with model predictions.
Investors who built positions based on this framework significantly outperformed the market average during this rebound.
In a market turbulent period, verifiable, structured research is the source of excess returns.
Subsequent key ranges, trend inflection points, and risk monitoring models have been updated on our homepage. Please follow us for continuous systematic analysis.
#BTC #Bitcoin #CryptoResearch #MarketOutlook #QuantAnalysis


Panic for most, opportunity for those who read my work. BTC tapped 84k and V-bounced instantly. If the W-pattern confirms, the upside could surprise. Entry levels sent to members.
#BitcoinNews #CryptoSignals #TradeIdeas #Bullish #CryptoAlert
2
133