
May 13
Talking to TelecomTV at the recent FutureNet World 2026 event in London, Fabrizio Campanale, VP of network operations for TV and in-home engineering @sunrise, discusses the potential of demand-driven networks, the fruitful combination of AI and telemetry data, the current state of agentic AI in telecom operations and more.
▶️ Watch the full interview: telecomtv.com/content/ai/sun…
#FutureNetWorld #Telecoms #TelemetryData #Data #AgenticAI #AI
2
2
90

Apr 7
Apica has updated its Ascent platform (v2.16) to support synthetic telemetry data, along with RUM and SLO dashboards, giving DevOps teams more control over the massive amounts of data observability platforms now require.
Find out more 👉 buff.ly/SFSPelm
#Apica #DevOps #TelemetryData #Observability
3
2
254

Not all pipelines are created Visionary. 🚀
Most exist, but we deliver. 🎯
Upscale your telemetry pipeline: apica.io/flow/
#observability #telemetry #telemetrydata

2
3
52

18 Aug 2025
Join @mezmodata & @linuxfoundation for a free live webinar TOMORROW at 11:00 AM PDT: "Bridging the Dev-SRE Gap with Active Telemetry." Learn more & register: hubs.la/Q03Bk_Hg0 #OpenSource #Linux #DevOps #TelemetryData #AI #SRE #StorageManagement

1
15
3,831
12 Aug 2025
Join @mezmodata & @linuxfoundation for a free live webinar on Tuesday, August 19 at 11:00 AM PDT: "Bridging the Dev-SRE Gap with Active Telemetry." Learn more & register: hubs.la/Q03Chf5Z0 #OpenSource #Linux #DevOps #TelemetryData #AI #SRE #StorageManagement
1
10
3,543
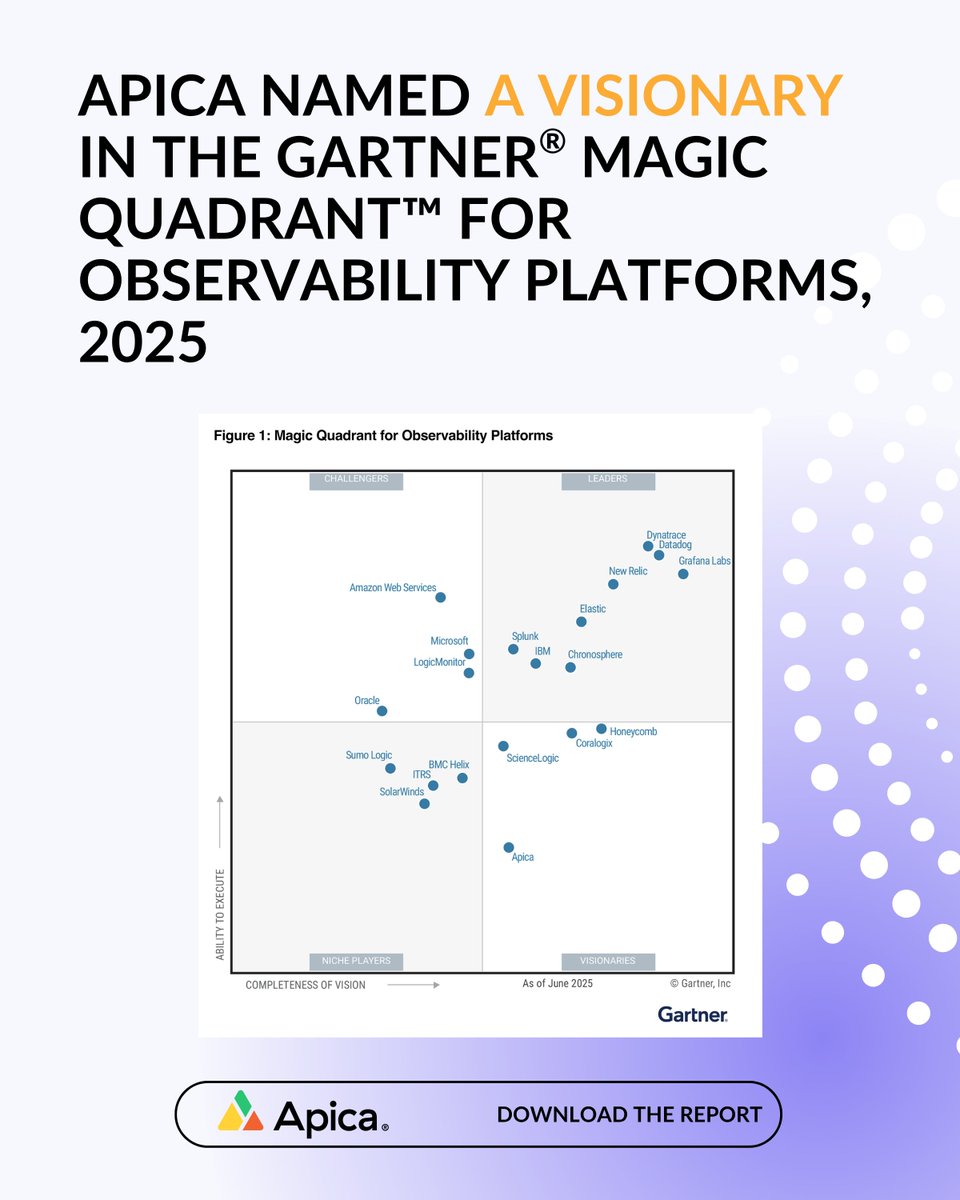
Apica has been named a Visionary in the 2025 Gartner® Magic Quadrant™ for Observability Platforms!
We help you use your existing tools, cut costs by up to 40%, and avoid vendor lock‑in. 🚀
Read the full report: apica.io/gartner-observabili…
#observability #telemetrydata #ITOps
1
2
37
Apica has been named a Visionary in the 2025 Gartner® Magic Quadrant™ for Observability Platforms! 🚀
We help you use your existing tools, cut costs by up to 40%, and avoid vendor lock‑in.
Read the report: apica.io/gartner-observabili…
#observability #telemetrydata #ITOps

1
3
32
Want your data in Apica Ascent in minutes? 🚀
New video demos step-by-step ingestion:
🔹 Install OpenTelemetry on Linux
🔹 Update config
🔹 Verify logs in Ascent
👉 Watch the complete playlist: youtu.be/0bKKm44n58U
#opentelemetry #observability #telemetrydata
2
20
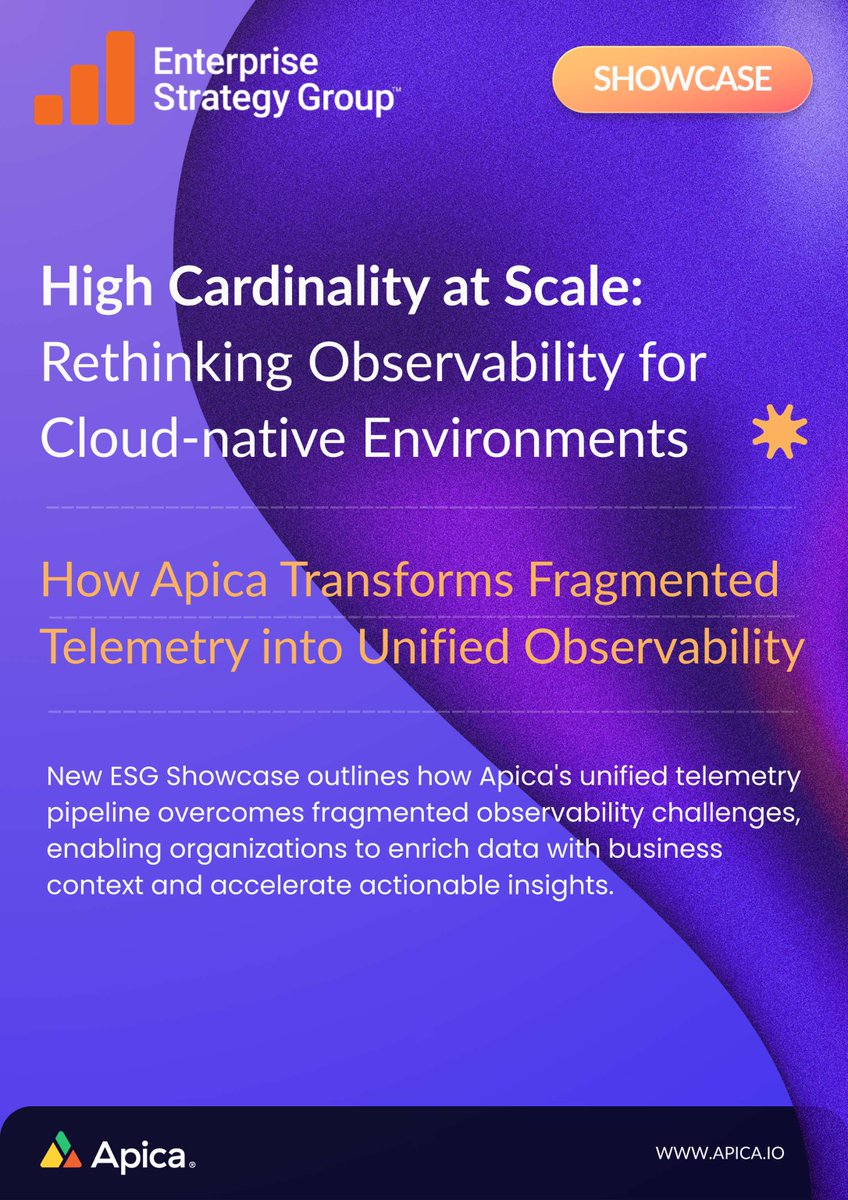
A new Enterprise Strategy Group Showcase highlights four critical failures in how enterprises approach monitoring.
Streamline your monitoring strategy with Apica's unified #telemetry pipeline and enhance compliance.
Explore the Showcase: apica.io/esg-showcase-2025/
#TelemetryData
2
33

26 Feb 2025
Sawmills @SawmillsAI Raises $10 Million in Seed Round
#AI #ML #Telemetry #TelemetryData #TelemetryManagement #Observability #DataManagement #AIInfrastructure #OpenTelemetry #SaaS #SeedRound #Funding
thesaasnews.com/news/sawmill…
2
50
Magic happens when customers become collaborators! At Ascend 2025 in Stockholm, your insights are shaping not just our products but our entire direction. Thank you for guiding our innovation in telemetry data management.🚀
#CustomerFirst #TelemetryData #Observability #OTeL


1
1
52
Ready, set… LAUNCH! 🚀
Tomorrow is the day. Stay tuned for something big related to telemetry data management!
#TechInnovation #TelemetryData #observability #TechUpdates #BigDataSolutions #DataInnovation
1
3
59

19 Dec 2024
Log collection is important for maintaining the health, performance, and security of systems.🪵 Our PMM Karl Kalash lays out common methods for capturing log data, and the role of a #TelemetryPipelines in log collection. Check it out! okt.to/YVj8ay
#telemetrydata
1
44

25 Oct 2024
#Composability is a key architectural capability in @CloudFabrix offerings, guided by three value pillars 💫. Discover how various stakeholders can rapidly achieve business outcomes in this insightful whitepaper 📑. Access here 🔗 cloudfabrix.com/resources/ai…
#ComposableAnalytics #LowCode #TelemetryData #AIOps #CloudFabrix
3
5
52
22 Oct 2024
A recent #Gartner report highlights that massive data volumes drive complexity and costs exceeding as much as $10M annually for large enterprises. But with #TelemetryPipeline, enterprises can cut through the data overload and save big. Learn more from this insightful blog: cloudfabrix.com/blog/telemet… by @srinimiriyala
#observabilitypipeline #telemetry #telemetrydata #AIOps #CloudFabrix
4
6
56
24 Sep 2024
🔍 Looking to enhance your #DataManagement practices while automating 🚀 your #telemetrydata? #CloudFabrix has the solution! Learn how our Robotic Observability Pipelines 🤖 can help you take complete control 💪 of your #telemetry data by diving into this insightful blog 💫 by @shail_manjrekar.
cloudfabrix.com/blog/take-co…
#DataAutomation #OpenTelemetry #Observability #ITAutomation
3
4
108

30 Jul 2024
The Success of AIOps Requires Synthetic Internet Telemetry Data
aeliusventure.co.uk/the-succ…
#AIOps #SyntheticData #InternetTelemetry #DataAnalytics #ITAutomation #ArtificialIntelligence #MachineLearning #TelemetryData #Aeliusventure
2
65

5 Jul 2024
💼 Consumer deposit balances are evolving. Understand the shifts and equip your #bank or #creditunion with strategies from our latest #TelemetryData report. Access the insights here 👉 bit.ly/4biS30n

1
3
333

7 Jun 2024
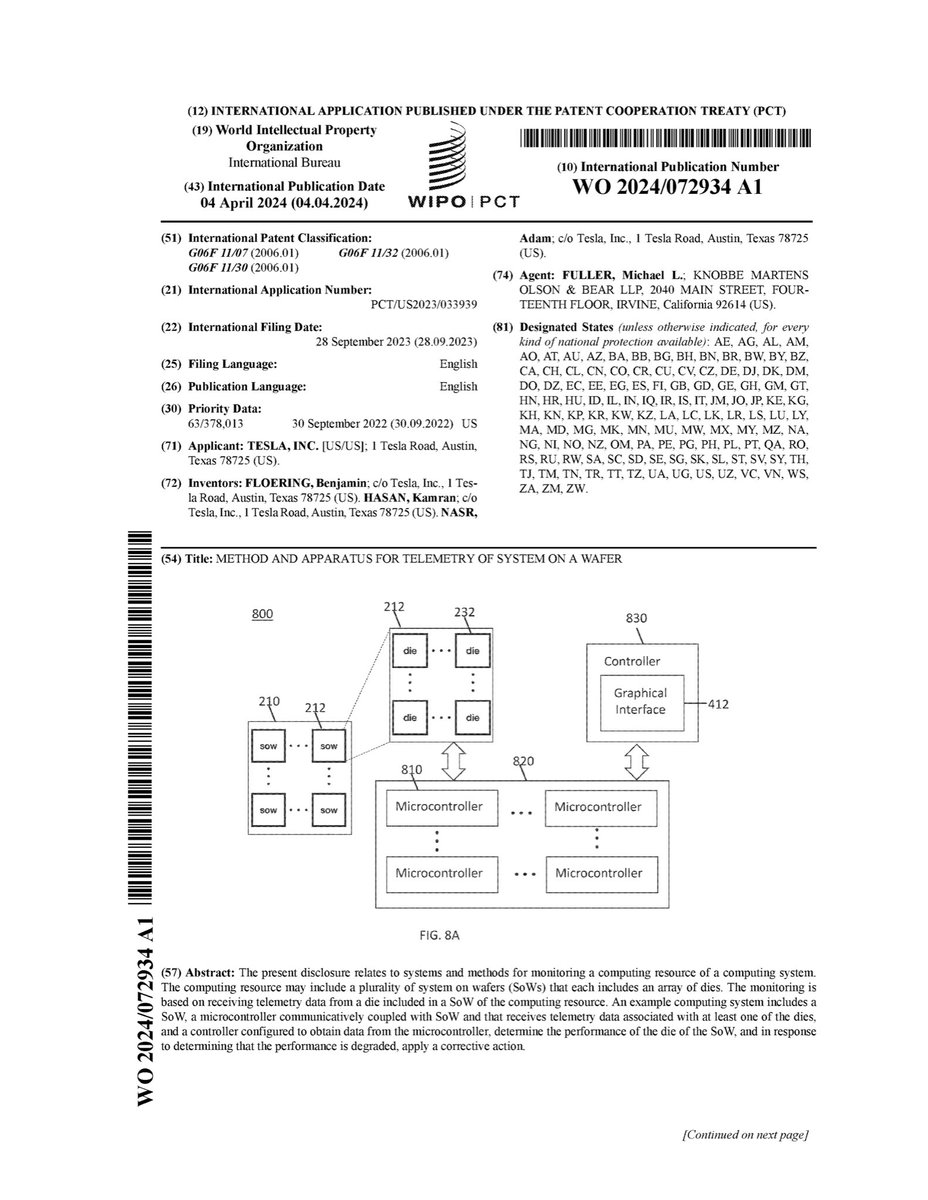
#Tesla's patent WO2024072934A1 discloses an innovative performance monitoring system for #Dojo, its AI training supercomputer that leverages an array of systems on wafers (SoWs).
This technology could significantly enhance Dojo's reliability and prevent performance degradation by identifying and addressing issues in individual dies.
1️⃣ Problems to be Solved:
- Difficulty in real-time monitoring of individual dies within a high-density computing system
- Performance degradation of the entire SoW due to issues in a portion of the dies
- Inefficient utilization of computing resources within the system
2️⃣ Key Technologies and Their Effects:
- Telemetry data collection from individual dies:
: Each die in the SoW array generates telemetry data (e.g., temperature, voltage, current, usage, bandwidth, latency)
: Microcontrollers receive telemetry data from one or more dies
: Controller obtains and processes telemetry data from microcontrollers
- Real-time monitoring and performance optimization:
: Controller identifies each die and associates telemetry data with specific dies
: Performance metrics are determined for individual dies based on the processed telemetry data
: Corrective actions (e.g., throttling, deactivating, reinitializing, power control) are applied when performance metrics satisfy thresholds
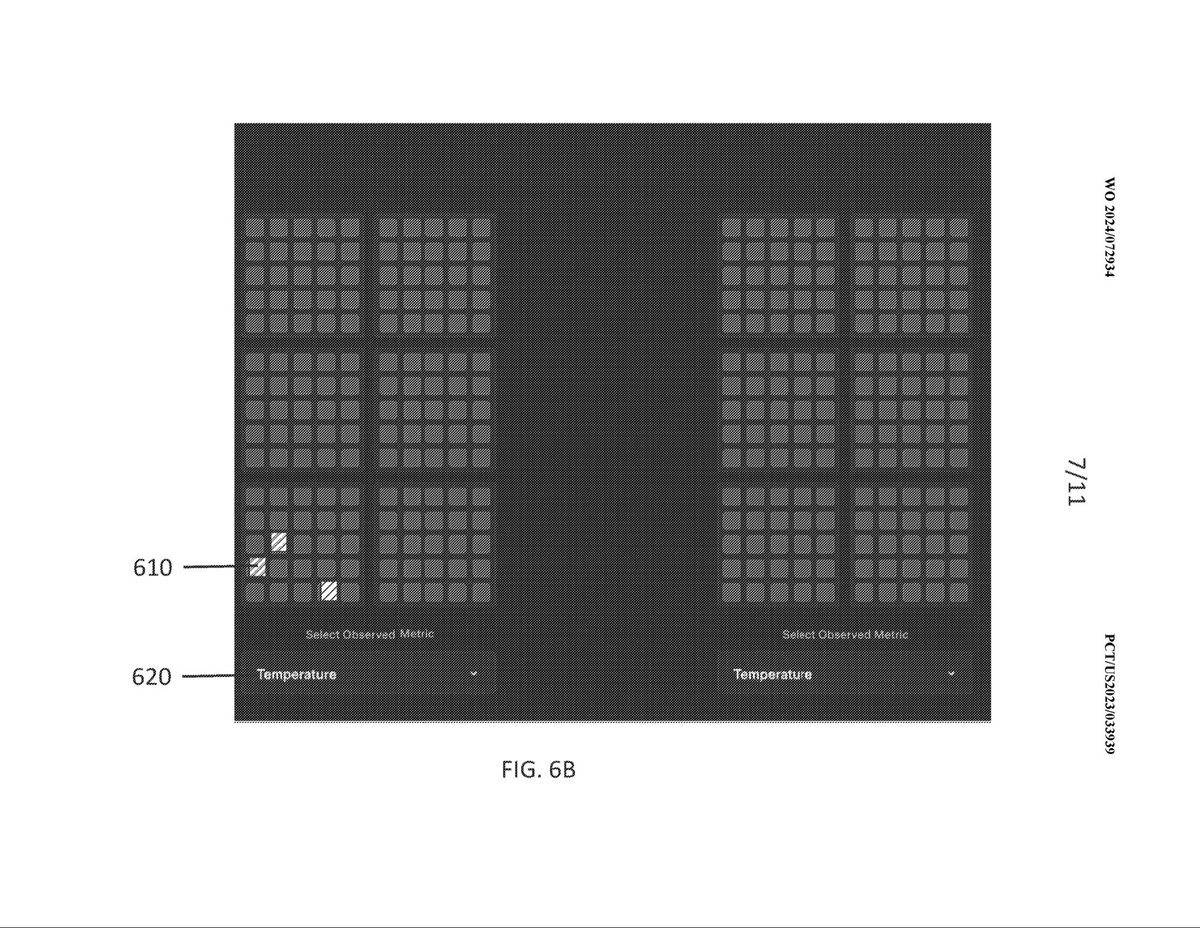
- Graphical representation of performance metrics:
: Controller generates graphical representations of performance metrics at various resolutions (e.g., SoW level, die level)
: Visualization aids in debugging and performance enhancement
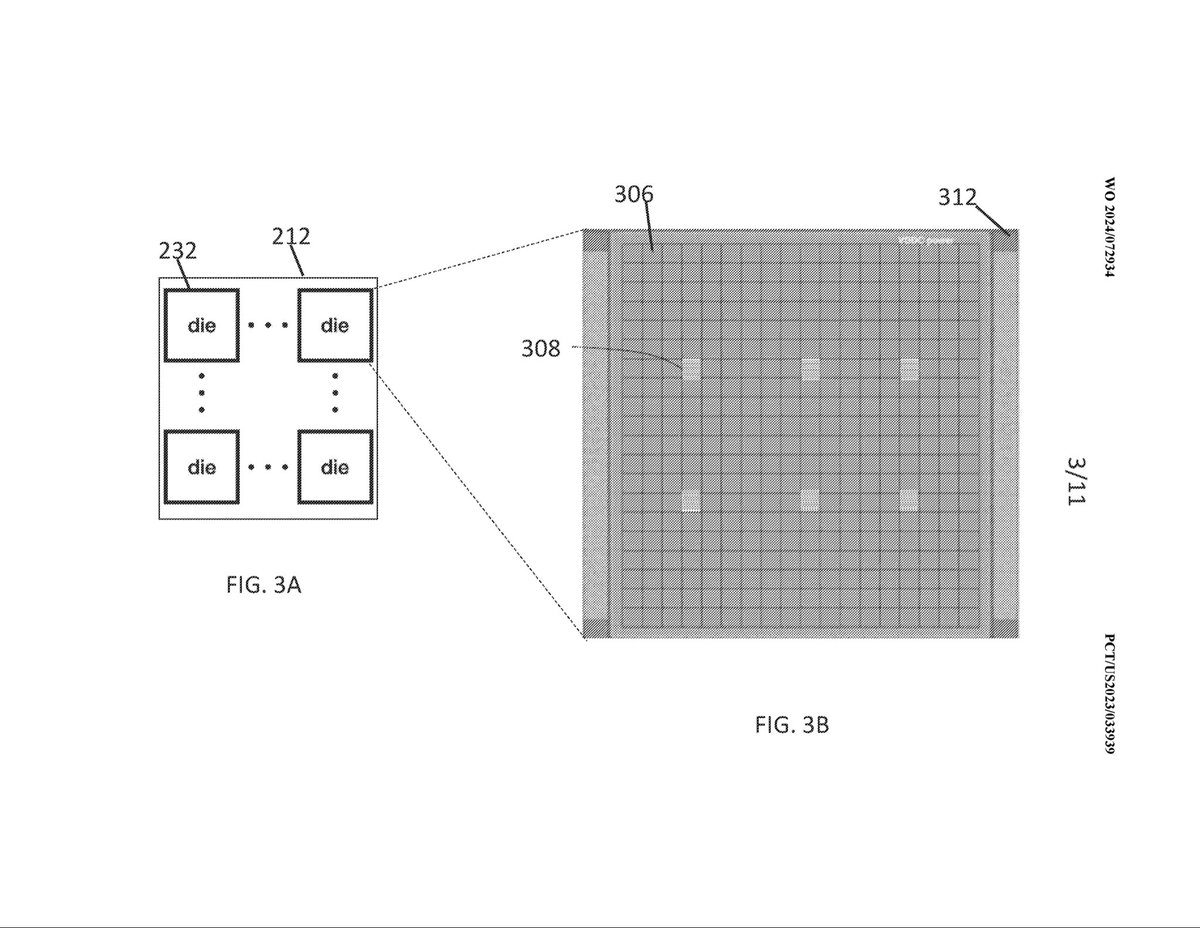
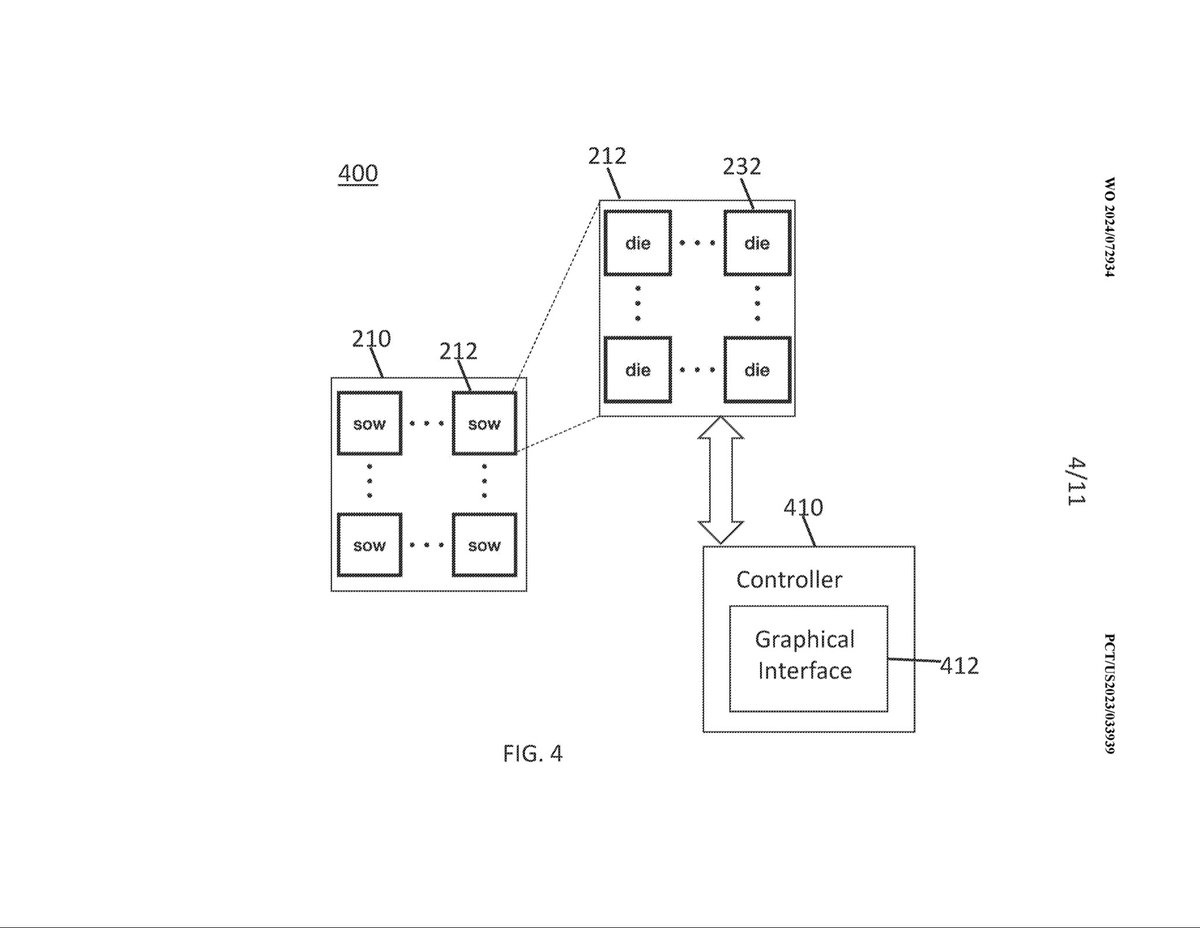
3️⃣ Key Figures:
- Fig. 2: Example computing system with an array of SoWs and an electronic module array
- Fig. 3A, 3B: SoW with an array of dies, each die containing compute nodes and global nodes for telemetry data generation
- Fig. 4: Interactions between the controller and SoWs/dies for telemetry data collection and processing
- Fig. 6A, 6B: Graphical representations of processed telemetry data at SoW and die levels
4️⃣ Claim 1:
A computing system comprising:
- an array of dies included on a system on a wafer (SoW), wherein the dies of the array are configured to output telemetry data;
- a microcontroller configured to receive telemetry data associated with at least one die of the array of dies; and
- a controller configured to obtain data that comprises the telemetry data from the microcontroller, determine a performance metric of a particular die of the array of dies by processing the obtained data, and apply a corrective action in response to determining that the performance metric satisfies a threshold.
💡 Patent: WO2024072934A1
- Title: Method and Apparatus for Telemetry of System on a Wafer
- Applicant: Tesla, Inc.
- Link: patents.google.com/patent/WO…
$TSLA #SoW #SystemOnWafer #Dojo #TelemetryData #PerformanceMonitoring
1
9
610

Stop overlooking valuable insights and dive into the world of telemetry data to transform your business operations. Read more on INPUT. #datainsights #telemetrydata
ow.ly/pPWW50RPrZc
1
532