
May 15
How does it interact with pgvector and textsearch? I want to search for a node/edges semantically and/or on keyword and fetch n neighbors
1
2
89

Feb 27
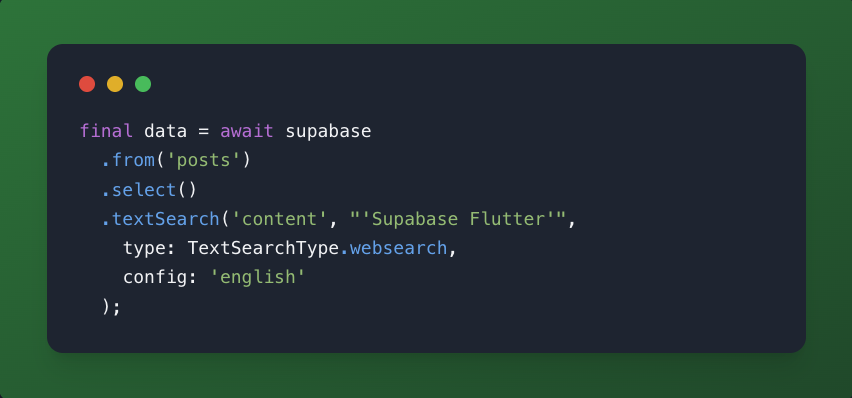
Supabase makes implementing a search feature incredibly easy!
Just call the `textSearch` filter, and you now have a keyword search feature in your app 🔎

3
4
57
4,674


23 Dec 2025
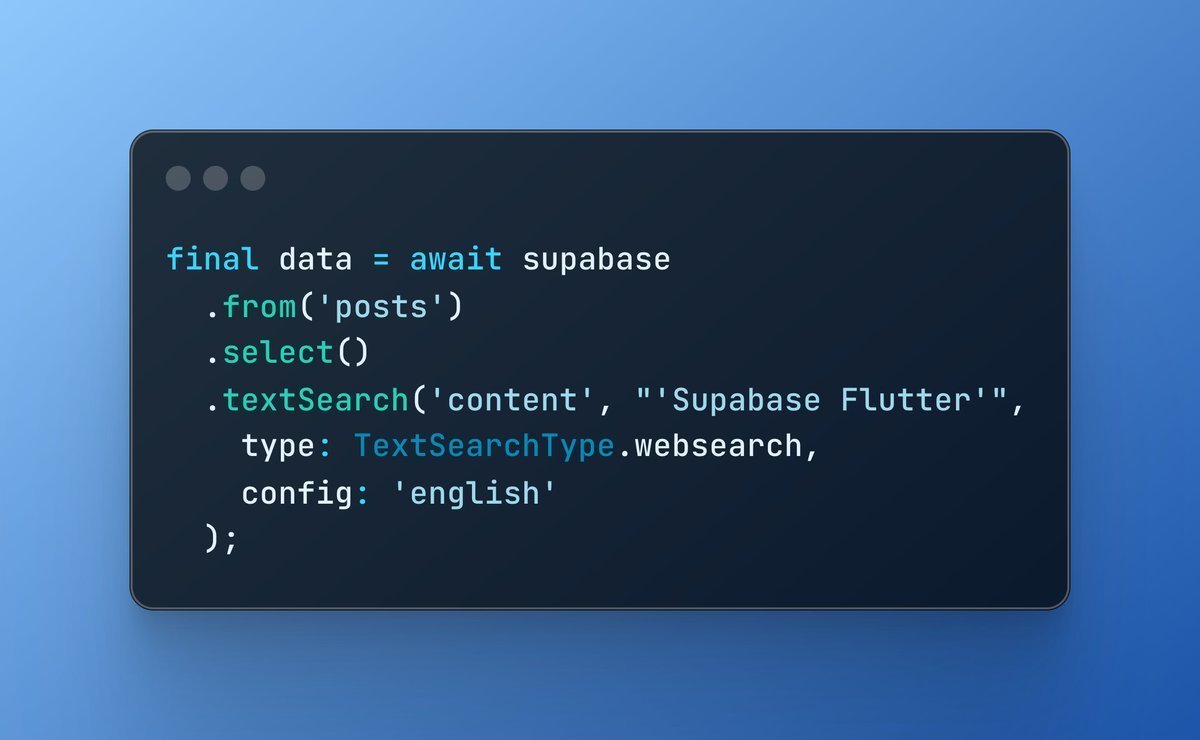
Supabase makes implementing a search feature incredibly easy!!
Just call the `textSearch` filter, and you now have a keyword search feature in your app
3
132

22 Dec 2025
𝐒𝐮𝐩𝐩𝐨𝐫𝐭𝐢𝐧𝐠 𝐭𝐞𝐱𝐭 𝐬𝐞𝐚𝐫𝐜𝐡 𝐟𝐫𝐨𝐦 𝐞𝐯𝐞𝐫𝐲 𝐚𝐧𝐠𝐥𝐞: 𝐬𝐞𝐦𝐚𝐧𝐭𝐢𝐜, 𝐥𝐞𝐱𝐢𝐜𝐚𝐥, 𝐚𝐧𝐝 𝐡𝐲𝐛𝐫𝐢𝐝
Sometimes you want semantic understanding.
Sometimes you need exact keywords or phrases.
Often, you need a combination, depending on the use case.
This guide walks through how Qdrant supports text search from multiple angles:
- Semantic (dense vector) search for intent
- Lexical / keyword-based text search for exact terms
- Hybrid patterns that let you combine and tune both approaches
- Filters and ranking controls to match real application needs
Whether you’re building search or RAG, the guide focuses on when to use which approach and how to wire them together cleanly, without forcing a single retrieval strategy everywhere.
Read the documentation:
qdrant.tech/documentation/gu…
#Qdrant #Search #TextSearch #VectorSearch #HybridSearch #RAG #LLMOps #AIEngineering

2
10
913
20 Dec 2025
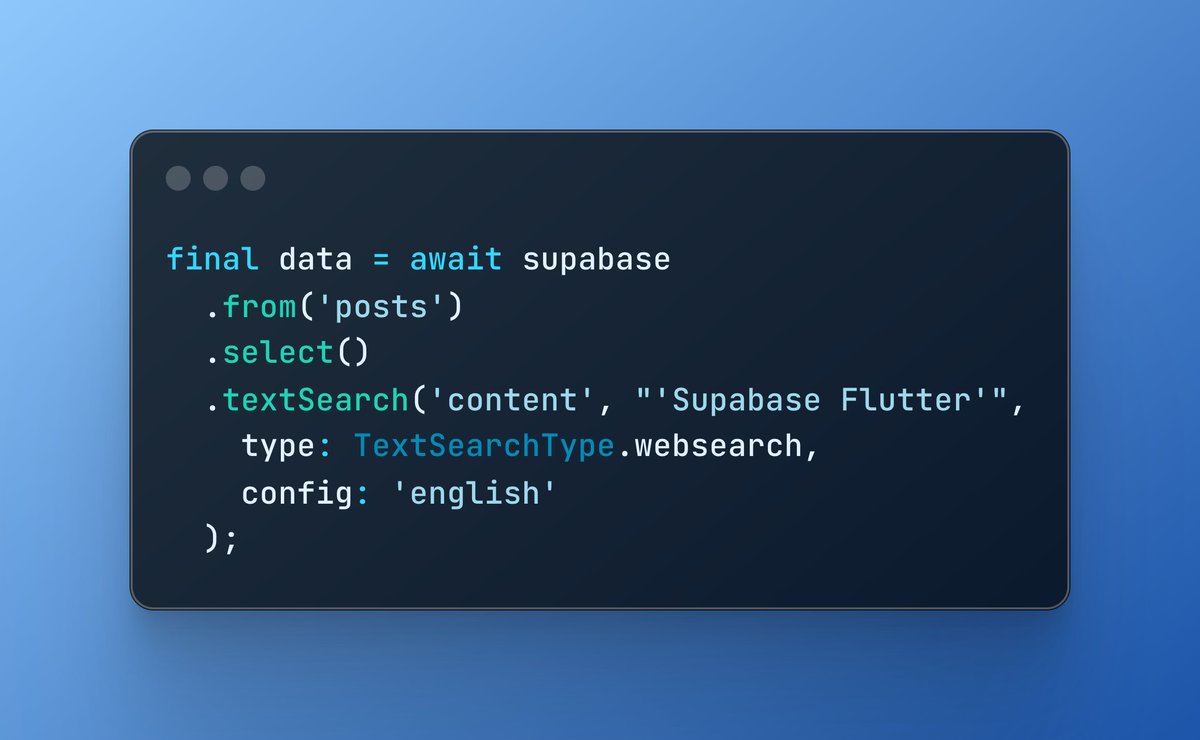
Supabase makes implementing a search feature incredibly easy!
Just call the `textSearch` filter, and you now have a keyword search feature in your app 🔎
12
13
321
25,273
19 Oct 2025
Supabase makes implementing a search feature incredibly easy!
Just call the `textSearch` filter and you now have a keyword search feature in your app 🔎

19
12
315
149,729

26 Aug 2025
Qwen code is great, but please fix the sudden termination after textsearch error 🙏
4
13
2,421
18 Aug 2025
iLike and textSearch may be similar, but there are some slight differences.
iLike looks for exact match case insensitively, while textSearch is able to pick up different forms of texts. When you search for "runs" or "running", it will pick up those with "run" in the text.
iLike might be more suited if you are searching for things usernames, where as textSearch is more suited for keyword search.
5
541
18 Aug 2025
Supabase makes implementing a search feature incredibly easy!
Just call the `textSearch` filter and you now have a keyword search feature in your app 🔎

26
19
306
31,696
29 Jun 2025
Supabase makes implementing a search feature incredibly easy!
Just call the `textSearch` filter, and you now have a keyword search feature in your app 🔎

14
28
518
39,738
16 May 2025
Supabase makes implementing a search feature incredibly easy!
Just call the `textSearch` filter, and you now have a keyword search feature in your app 🔎

4
9
157
8,657

29 Apr 2025
PostgreSQL本体のtextsearchは残念ながら日本語非対応ですね(昔textsearch_jaという日本語対応モジュールもありましたが)
さすがにPGroongaに形態素解析器の組み合わせは無理だとしても、pg_bigm(Auroraも対応)で2-gramのインデックスを作って対応できると良いんですが
fujitsu.com/jp/products/soft…
1
1
2
766
22 Feb 2025
Supabase makes implementing a search feature incredibly easy!
Just call the `textSearch` filter and you now have a keyword search feature in your app 🔎

14
27
424
28,646

16 Jan 2025
Could SOLR pass a language exam with my accented data, or should it stick to Math? 📉
Source: devhubby.com/thread/how-to-i…
#Indexing #TextSearch #Solr #Developers #accent #solr
2
8
31

1 Jan 2025
Build A CLI in OCaml with the Cmdliner Library: In this tutorial we are building a simple CLI named textsearch which is able to search a provided piece of string (probably a word) in a given text file.
Prior knowledge of components… dlvr.it/TH6Sgs #OCaml #OCamlPlanet
2
11
629

31 Dec 2024
FYI code
import geopandas as gpd
import matplotlib.pyplot as plt
from shapely.geometry import box
# 1) Read world shapefile
shapefile_path = r"ne_110m_admin_0_countries.shp"
world = gpd.read_file(shapefile_path)
# 2) Ensure WGS84
world = world.to_crs("EPSG:4326")
# 3) Define highlight countries & color map
highlight_countries = [
"Saudi Arabia", "Bahrain", "Kuwait", "Oman", "Qatar",
"United Arab Emirates", "Israel", "Syria",
"Turkey", "Romania", "Moldova", "Ukraine"
]
color_map = {
"Saudi Arabia": "#ffcccb",
"Bahrain": "#ffb6c1",
"Kuwait": "#ffc0cb",
"Oman": "#ffa07a",
"Qatar": "#f08080",
"United Arab Emirates": "#ff6347",
"Israel": "#ff4500",
"Syria": "#fa8072",
"Turkey": "#ff7f50",
"Romania": "#ff8c00",
"Moldova": "#ffa500",
"Ukraine": "#ff1493"
}
# 4) Clip out far-eastern Russia etc. by bounding box
# Adjust as needed: (min_lon, min_lat, max_lon, max_lat)
minx, miny, maxx, maxy = (18, 12, 60, 50)
bbox_poly = box(minx, miny, maxx, maxy)
# 5) Clip the world to that bounding box (partially cuts off large countries)
region = gpd.clip(world, bbox_poly)
# 6) Build a polygon for the 'ocean' portion by subtracting land from the bounding box
land_union = region.unary_union # merges all land geometry
ocean_area = bbox_poly.difference(land_union)
# Create a GeoDataFrame for the ocean polygon
ocean_gdf = gpd.GeoDataFrame(geometry=[ocean_area], crs="EPSG:4326")
# 7) Assign highlight colors vs. white for everything else
region["color"] = region["NAME"].map(color_map).fillna("white")
# 8) Plot
fig, ax = plt.subplots(figsize=(10, 8))
# Plot the ocean first
ocean_gdf.plot(ax=ax, color="skyblue", zorder=1)
# Plot the region (countries) on top
region.plot(
ax=ax,
color=region["color"],
edgecolor="black",
linewidth=0.5,
zorder=2
)
# 9) Label highlighted countries
for country in highlight_countries:
subset = region[region["NAME"] == country]
if not subset.empty:
centroid = subset.geometry.centroid.iloc[0]
ax.text(
centroid.x, centroid.y, country,
fontsize=9,
ha="center", va="center",
color="black",
bbox=dict(facecolor="white", alpha=0.7, pad=1.0),
zorder=3
)
# 10) Final styling
ax.set_title("Eastern Europe & the Middle East (WGS84)", fontsize=14, fontweight="bold")
ax.set_axis_off()
plt.tight_layout()
# 11) Save/show
output_path = r"C:\pythonprojects\textsearch\improved_map.png"
plt.savefig(output_path, bbox_inches="tight", dpi=300)
plt.show()
print(f"Map saved to {output_path}")
1
150
29 Dec 2024
Supabase makes implementing a search feature incredibly easy!
Just call the `textSearch` filter and you now have a keyword search feature in your app 🔎
18
27
523
35,923

1 Dec 2024
bolt.newとSupabaseで全文検索!
supabase-jsのtextSearchフィルターを使うと楽にキーワード検索が実装できます!その際、複数のカラムを検索対象としたいとき、複数のカラムをgenerated columnで一つにまとめると例えば商品名+説明文を検索対象にできます!
1 Dec 2024

Keyword search feature with bolt.new and Supabase!
A few pointers:
- Use the textSearch method on Supabase
- Use generated columns to search across multiple columns.
bolt took care of creating indexes and using pg_trgm extension to enhance the search experience!
3
30
2,132
1 Dec 2024
Keyword search feature with bolt.new and Supabase!
A few pointers:
- Use the textSearch method on Supabase
- Use generated columns to search across multiple columns.
bolt took care of creating indexes and using pg_trgm extension to enhance the search experience!
5
16
130
15,157