
Jun 12
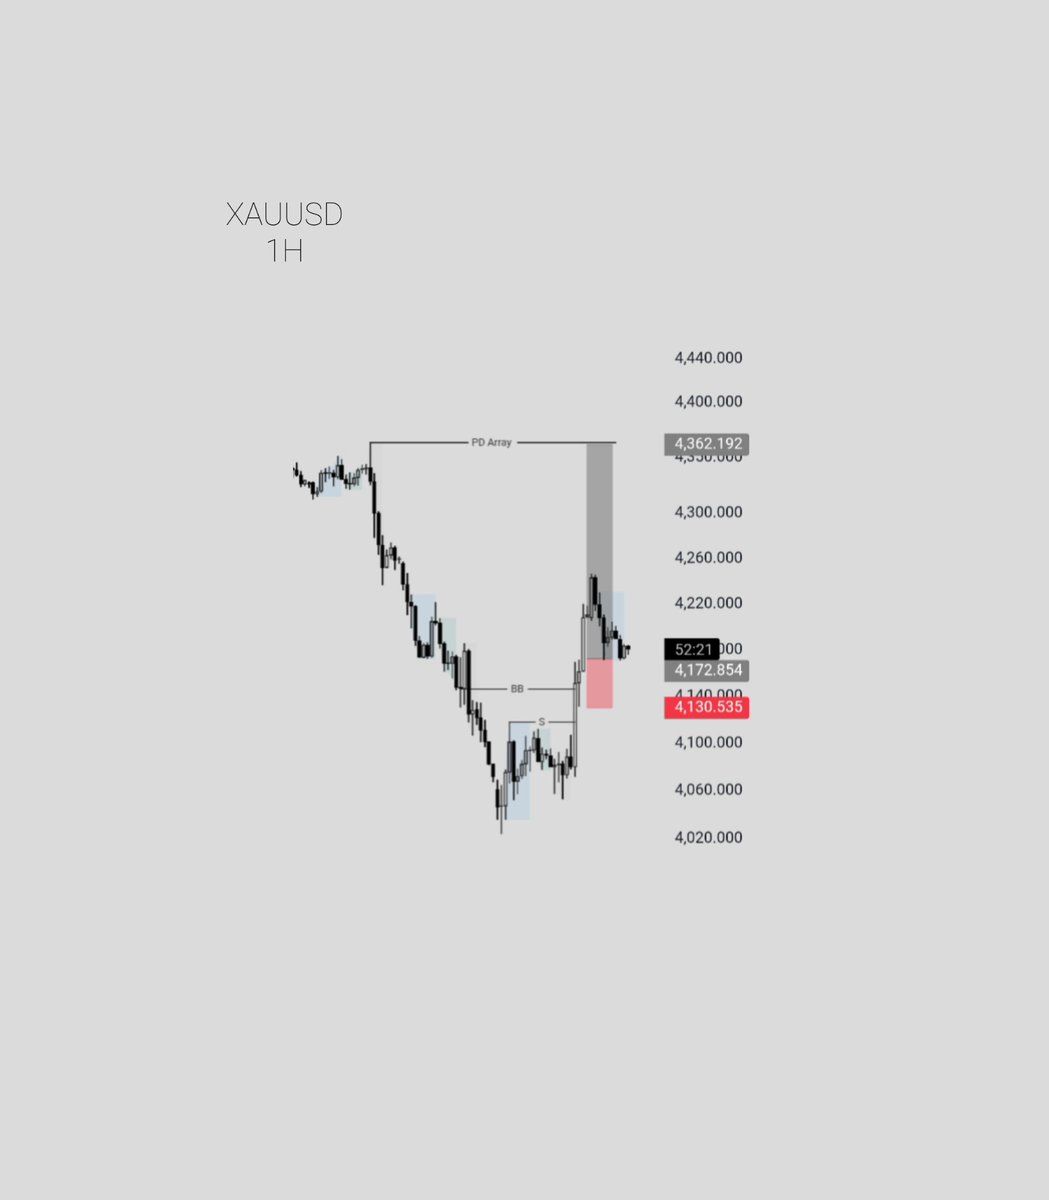
The market often revisits important PD Arrays before continuing its intended direction.
Remember:
The market doesn't respect your opinion—it respects liquidity, structure, and PD Arrays.
#XAUUSD #ICT #SMC #ForexEducation #PriceAction #TradingKnowledge
Can i get gm 🤗
3
59

Jun 10
📖 交易小知识|订单类型选择
你知道吗?不同订单类型适合不同场景:
• 市价单 → 快速成交
• 限价单 → 控制价格
灵活使用订单类型,能帮你更好地管理风险和机会
Bitbaby支持多种高级订单,欢迎探索!
#Bitbaby #TradingKnowledge #OrderTypes

1
1
1,050

Jun 10
📖 Trading Knowledge|Choosing Order Types
Did you know? Different order types fit different situations:
• Market Order → Instant execution
• Limit Order → Price control
Using order types flexibly helps manage risk and seize opportunities better
Bitbaby supports various advanced orders — feel free to explore!
#Bitbaby #TradingKnowledge #OrderTypes

2
1,309

Jun 10
What do gold, oil, equities and forex all have in common? They are all influenced by the US dollar.
For traders, learning how the $USD shapes global markets can make the difference between chasing moves and understanding them.
Learn more and take the quiz 👉 ow.ly/nl3k50Z9f0h
#TradingKnowledge #GlobalMarkets #USDollar #CommoditiesTrading #TradingEducation
General advice only. All trading involves risk.
Refer to our PDS and TMD. AFSL 254963.
1
39

Apr 16
Did You Know? Tight Spreads Start with Liquidity 👀
High liquidity means less friction, more precision. 📊
That’s where consistency lives.
Trade where liquidity works in your favor 💪
#TenTrade #liquidity #tradingknowledge #forexeducation #marketfacts
2
1
4
270

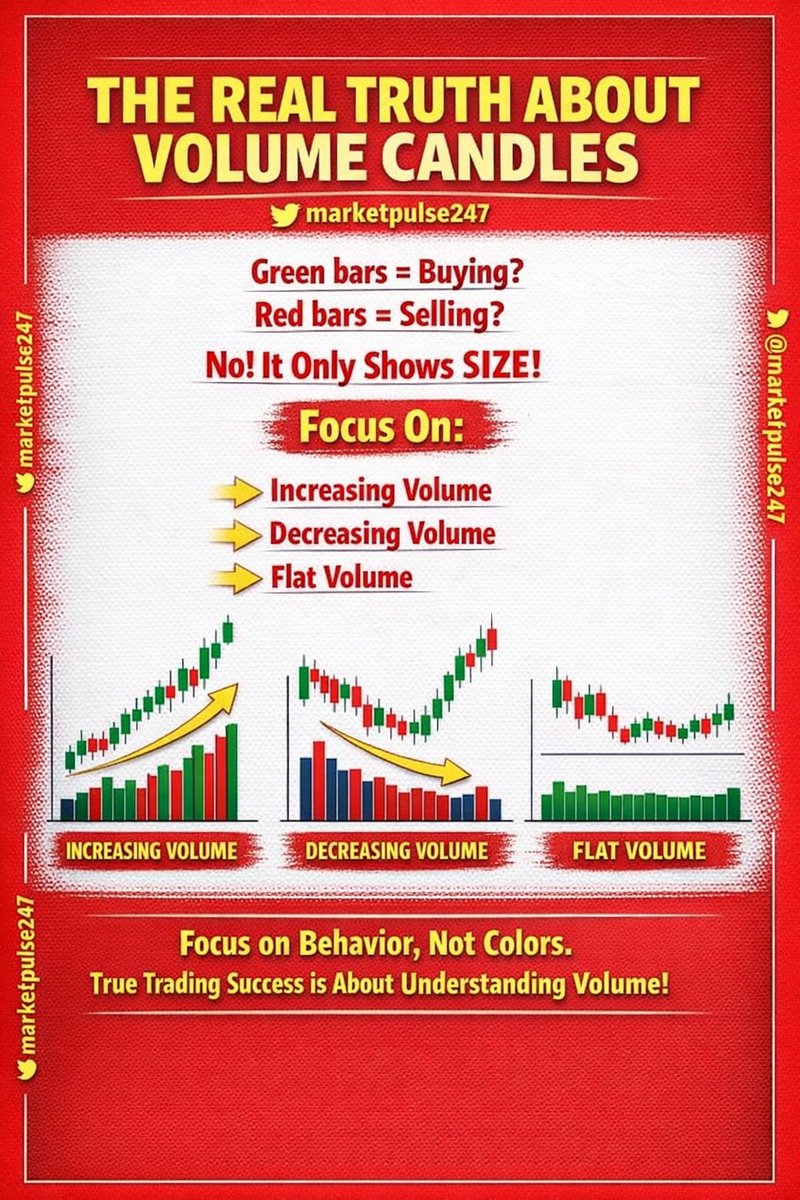
🔥 The Truth About Volume Candles That Every Trader Must Know 🔥
In the world of trading, there are many assumptions that traders blindly follow without questioning their accuracy. One of the most common misconceptions revolves around volume candles. Many traders believe that green volume bars indicate buying pressure and red volume bars indicate selling pressure. This belief feels logical on the surface, but in reality, it is misleading and often results in poor trading decisions.
The truth is simple yet powerful. The color of volume candles does not represent buying or selling activity. It only reflects the size of the total transactions that took place during a particular time period. Volume simply measures how much trading activity has occurred, not who is in control.
Understanding this concept can completely transform the way you analyze charts and make trading decisions.
Let us break this down in a simple and practical way so that you can apply it immediately in your trading journey.
First, you need to understand what volume actually represents. Every trade in the market consists of both a buyer and a seller. Without one, the other cannot exist. So when you see volume increasing, it does not mean only buyers are active or only sellers are active. It means both sides are participating heavily. The color is just derived from whether the price closed higher or lower than the previous candle, not from actual buying or selling dominance.
This is why relying on color can lead to confusion and false confidence.
Instead of focusing on color, smart traders focus on how volume behaves. There are three key patterns that truly matter.
The first is Increasing Volume.
When volume is increasing, it indicates growing interest and participation in the market. If price is moving up along with rising volume, it suggests that the move is supported by strong market involvement. This often leads to continuation because more traders are entering the move.
Similarly, if price is falling and volume is increasing, it shows strong selling activity in terms of participation, not dominance. It signals that the downtrend could continue because the move has strength behind it.
Increasing volume is like fuel being added to a fire. The more the fuel, the stronger and longer the move can last.
The second important concept is Decreasing Volume.
When volume starts to decline, it signals that interest in the current move is fading. If the price is rising but volume is decreasing, it often indicates a weak rally. Fewer participants are willing to support higher prices, which increases the chances of a reversal or a sudden drop.
On the other hand, if price is falling but volume is decreasing, it suggests that the selling pressure is losing momentum. This can be an early indication that the market may soon stabilize or reverse upward.
Decreasing volume is a warning sign. It tells you that the current move may not be sustainable.
The third concept is Flat Volume.
Flat or consistent volume usually appears during consolidation phases. In such situations, the market is neither strongly bullish nor bearish. Price tends to move in a range, and volume remains relatively stable.
This phase is often ignored by impatient traders, but it is actually one of the most important stages in the market. During consolidation, large institutional players quietly build their positions. Once they are ready, a strong breakout often follows.
Flat volume represents calm before the storm. It is the preparation phase before a significant move.
If you truly want to improve your trading performance, you must shift your focus from appearance to behavior. Colors can be deceptive, but patterns reveal the truth. By understanding whether volume is increasing, decreasing, or staying flat, you gain a much deeper insight into market dynamics.
Most beginners get trapped because they rely on simple visual cues like color. Professional traders, however, dig deeper and analyze the structure behind the data.
This small shift in perspective can make a huge difference in your consistency and confidence.
💡 Conclusion
Volume candles are not about green or red. They are about participation and intensity. The real edge in trading comes from understanding how volume behaves, not how it looks. When you start focusing on increasing, decreasing, and flat volume, you move one step closer to thinking like a professional trader and staying ahead of the crowd.
x.com/@marketpulse247
#VolumeAnalysis #TradingPsychology #SmartTrading #PriceAction #StockMarketIndia #IntradayTrading #SwingTrading #OptionTrading #TechnicalAnalysis #MarketEducation #TraderMindset #LearnTrading #TradingStrategy #StockMarketTips #VolumeMatters #MarketInsights #TradeSmart #FinancialFreedom #InvestingIndia #ChartReading #TradingBasics #ProTrader #RetailTrader #MarketLogic #StockEducation #TradingCommunity #WealthCreation #TradeLikeAPro #MarketWisdom #TradingJourney #LearnAndEarn #RiskManagement #MoneyManagement #StockTipsIndia #Nifty50 #BankNifty #PriceActionTrading #VolumeTruth #MarketAnalysis #TradingKnowledge #TradeBetter #MarketSecrets #ConsistencyInTrading #ProfitableTrading #TradingEdge #MarketStructure
3
4
173
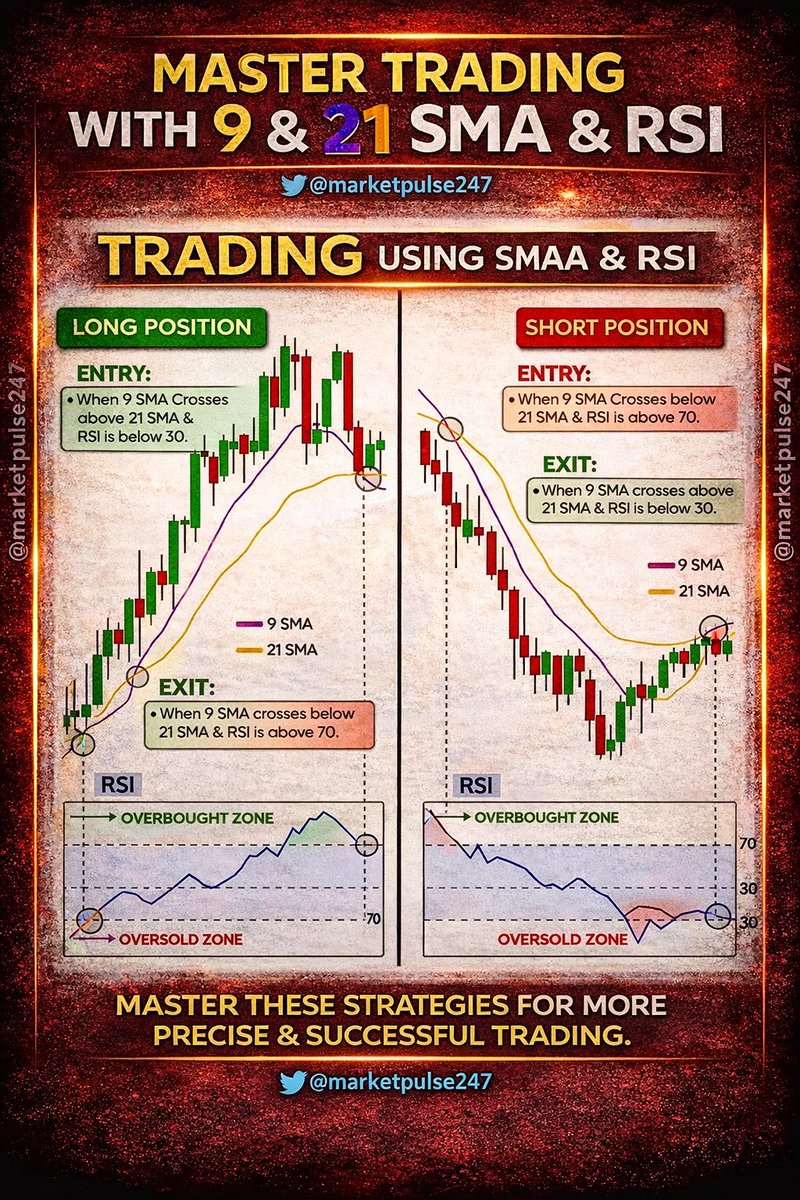
MASTER TRADING WITH 9 AND 21 SMA AND RSI STRATEGY
Trading becomes simple when you follow a structured system instead of random decisions. One of the most powerful and beginner friendly strategies is the combination of 9 SMA, 21 SMA, and RSI. This strategy helps you identify trend direction, entry timing, and exit points with clarity. Let us break it down step by step in a practical and easy to understand way.
1 The foundation of this strategy is moving averages. The 9 SMA represents short term price movement while the 21 SMA represents a slightly longer trend. When these two lines interact, they give strong signals about market direction. When the 9 SMA moves above the 21 SMA, it indicates bullish momentum. When it moves below, it signals bearish momentum.
2 For a long position, the ideal setup begins when the 9 SMA crosses above the 21 SMA. This crossover suggests that buyers are gaining control and the trend may move upward. However, entering blindly is not a smart move. You need confirmation.
3 This is where RSI plays a crucial role. RSI measures momentum and helps identify overbought and oversold conditions. For a strong long entry, RSI should be below 30 or just moving out of the oversold zone. This indicates that the stock was recently under pressure and is now ready for a bounce.
4 Once both conditions align, SMA crossover and RSI confirmation, the probability of a successful trade increases. This combination filters out weak signals and improves accuracy.
5 Exit strategy is equally important. For long trades, you should exit when the 9 SMA crosses below the 21 SMA or when RSI reaches above 70. This indicates that the market is becoming overbought and a reversal or correction may occur.
6 For short positions, the logic is reversed. When the 9 SMA crosses below the 21 SMA, it signals bearish momentum. This is your first indication that the trend may move downward.
7 RSI confirmation for short trades comes when it is above 70 or coming down from the overbought zone. This shows that the market was previously strong but is now losing strength, creating an opportunity to sell.
8 Entry in short trades should be taken only when both conditions align. This avoids false signals and keeps your trading disciplined.
9 Exit for short trades should be planned when the 9 SMA crosses above the 21 SMA or when RSI drops near 30. This indicates that selling pressure is reducing and a bounce may happen.
10 One of the biggest advantages of this strategy is its simplicity. You do not need complex indicators or confusing setups. Just two moving averages and one momentum indicator can give you clear direction.
11 Risk management is the key to survival. Always use a stop loss. For long trades, place it below the recent swing low. For short trades, place it above the recent swing high. This protects your capital and keeps losses small.
12 Patience is what separates successful traders from the rest. Many traders jump into trades without waiting for confirmation. This leads to losses. Waiting for the right setup may feel slow, but it improves your win rate significantly.
13 Market conditions also matter. This strategy works best in trending markets. In sideways markets, moving averages may give false signals. In such cases, it is better to avoid overtrading.
14 Practice is essential. The more charts you analyze, the better you will understand how SMA and RSI behave in different conditions. Over time, you will gain confidence and improve your timing.
15 Consistency is the final piece of the puzzle. Following the same rules again and again builds discipline. Trading is not about one big profit, it is about consistent small wins over time.
CONCLUSION
The combination of 9 SMA, 21 SMA, and RSI is a powerful yet simple trading strategy that can transform your approach to the market. It gives you clear entry and exit signals, helps you understand trend direction, and keeps your trading structured. When combined with patience, discipline, and proper risk management, this strategy can significantly improve your results. Master the process, trust the system, and you will trade with confidence instead of confusion.
#trading #stockmarket #technicalanalysis #movingaverages #sma #rsi #tradingstrategy #intradaytrading #swingtrading #stocktrading #priceaction #marketanalysis #tradingtips #learntrading #traderlife #marketstructure #trendtrading #breakouttrading #supportandresistance #tradingeducation #financialmarkets #stockmarketindia #nifty50 #banknifty #equitymarket #tradingcommunity #investing #wealthcreation #moneygrowth #marketinsights #tradingmindset #riskmanagement #chartanalysis #patterntrading #markettrends #tradingjourney #stockanalysis #tradingknowledge #technicaltrading #daytrading #scalping #marketpsychology #smarttrading #pricepatterns #marketlearning #tradingrules
3
4
204
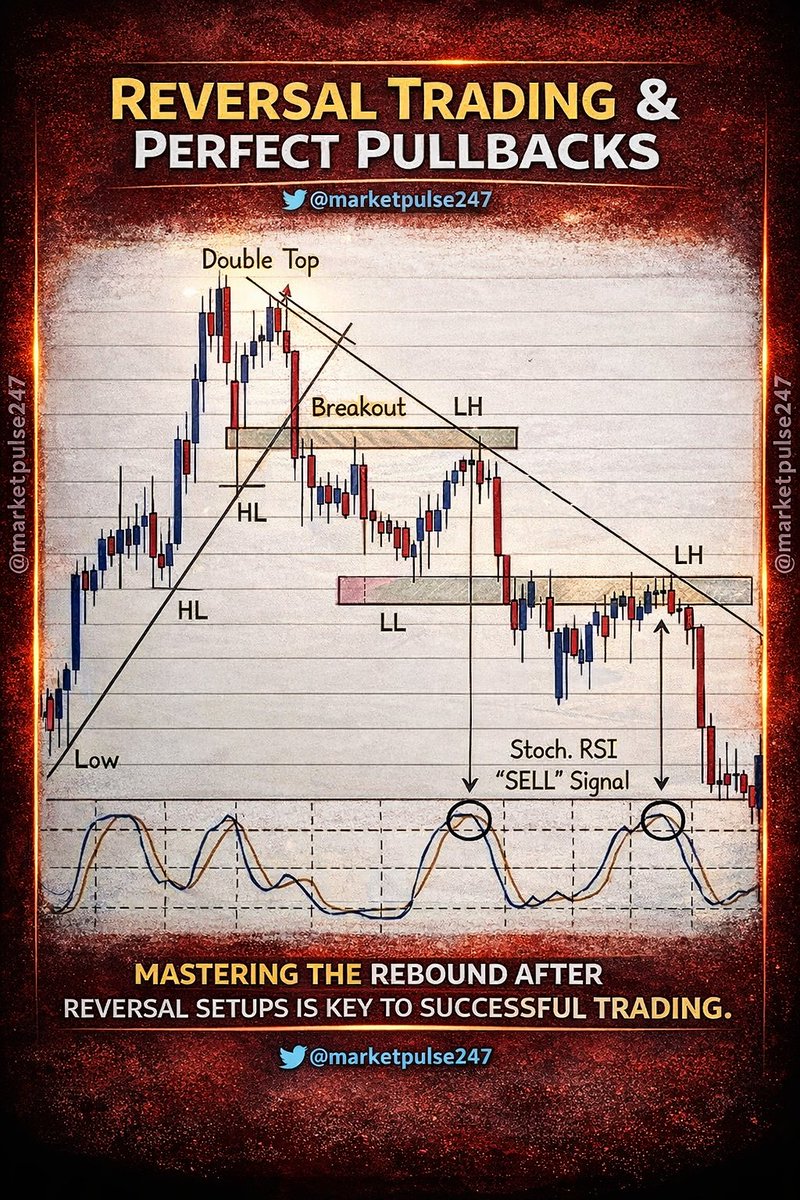
REVERSAL TRADING AND PERFECT PULLBACK STRATEGY EXPLAINED
The market does not move in a straight line. It trends, pauses, reverses, and then continues again. The real skill in trading is not just catching trends but understanding when a trend is about to reverse and how to enter at the right pullback. This is where reversal trading combined with perfect pullbacks becomes a powerful strategy for consistent profits.
1 The journey starts with identifying a strong uptrend. The chart clearly shows higher highs and higher lows, which confirms bullish strength. Many traders get comfortable here and keep buying, but smart traders stay alert. Trends do not last forever, and signs of exhaustion always appear before a reversal.
2 One of the most reliable reversal signals is the double top pattern. This forms when price tests the same resistance level twice but fails to break higher. The second rejection is a warning sign that buyers are losing strength. This is where experienced traders start preparing for a potential trend change instead of blindly buying.
3 After the double top, the price breaks below support. This is known as the breakout, but in this case, it is a breakdown signaling the start of a downtrend. However, entering immediately after the breakdown can be risky because markets often retest the breakout zone.
4 This is where the concept of pullback becomes important. After the breakdown, price often comes back to retest the previous support which now acts as resistance. This area is marked clearly in the chart. Many traders miss this opportunity because they chase the initial move, but professionals wait patiently for this retest.
5 The formation of a lower high confirms that the trend has changed. Earlier the market was making higher highs, but now it fails to reach previous highs. This shift from higher highs to lower highs is a clear indication of bearish control. This is one of the most important confirmations in reversal trading.
6 As the trend continues downward, the market starts forming lower lows. This creates a clear structure of a downtrend. Traders who understand this structure can ride the trend instead of fighting it. The key is to align with the market, not against it.
7 The Stochastic RSI indicator adds another layer of confirmation. When the price pulls back and the indicator shows an overbought condition, it signals a potential sell opportunity. In the chart, the sell signals are clearly marked where the indicator peaks and starts turning downward.
8 Combining price action with indicators increases the probability of success. Price action tells you what is happening, and indicators help confirm it. When both align, the trade becomes stronger and more reliable.
9 Risk management is what separates successful traders from the rest. Even the best setups can fail. Always place a stop loss above the recent lower high when taking a sell trade. This protects your capital and keeps you in the game for the long term.
10 Patience is the real edge in this strategy. Many traders lose money because they rush into trades. Waiting for the perfect pullback, confirmation of lower high, and indicator signal requires discipline, but it significantly improves accuracy.
11 Consistency comes from repeating the same process again and again. Identify the trend, wait for reversal signals, confirm the structure change, and enter on pullbacks. This structured approach removes emotional decision making and builds confidence over time.
12 The beauty of this strategy is its simplicity. You do not need complex indicators or complicated systems. Just understanding market structure, support and resistance, and timing your entry correctly can transform your trading.
CONCLUSION
Reversal trading with perfect pullbacks is not about predicting the market but about reacting to what the market is showing. When you combine chart patterns like double top with structure shifts like lower highs and confirmations from indicators like Stochastic RSI, you create a high probability trading setup. The real power lies in patience, discipline, and execution. Master this approach and you will stop chasing the market and start trading with confidence and clarity.
x.com/Marketpulse247/status/…
#trading #stockmarket #priceaction #reversaltrading #pullbacktrading #technicalanalysis #chartanalysis #tradingstrategy #intradaytrading #swingtrading #stocktrading #marketstructure #lowerhigh #higherlow #doubletop #breakout #breakdown #supportandresistance #stochasticrsi #tradingtips #learntrading #traderlife #marketanalysis #financialmarkets #stockmarketindia #nifty50 #banknifty #equitymarket #tradingcommunity #investing #wealthcreation #moneygrowth #marketinsights #tradingmindset #riskmanagement #patterntrading #markettrends #chartpatterns #tradingjourney #stockanalysis #tradingknowledge #technicaltrading #daytrading #scalping #marketpsychology #smarttrading #pricepatterns #marketlearning #tradingrules

REVERSAL TRADING AND PERFECT PULLBACK STRATEGY EXPLAINED
The market does not move in a straight line. It trends, pauses, reverses, and then continues again. The real skill in trading is not just catching trends but understanding when a trend is about to reverse and how to enter at the right pullback. This is where reversal trading combined with perfect pullbacks becomes a powerful strategy for consistent profits.
1 The journey starts with identifying a strong uptrend. The chart clearly shows higher highs and higher lows, which confirms bullish strength. Many traders get comfortable here and keep buying, but smart traders stay alert. Trends do not last forever, and signs of exhaustion always appear before a reversal.
2 One of the most reliable reversal signals is the double top pattern. This forms when price tests the same resistance level twice but fails to break higher. The second rejection is a warning sign that buyers are losing strength. This is where experienced traders start preparing for a potential trend change instead of blindly buying.
3 After the double top, the price breaks below support. This is known as the breakout, but in this case, it is a breakdown signaling the start of a downtrend. However, entering immediately after the breakdown can be risky because markets often retest the breakout zone.
4 This is where the concept of pullback becomes important. After the breakdown, price often comes back to retest the previous support which now acts as resistance. This area is marked clearly in the chart. Many traders miss this opportunity because they chase the initial move, but professionals wait patiently for this retest.
5 The formation of a lower high confirms that the trend has changed. Earlier the market was making higher highs, but now it fails to reach previous highs. This shift from higher highs to lower highs is a clear indication of bearish control. This is one of the most important confirmations in reversal trading.
6 As the trend continues downward, the market starts forming lower lows. This creates a clear structure of a downtrend. Traders who understand this structure can ride the trend instead of fighting it. The key is to align with the market, not against it.
7 The Stochastic RSI indicator adds another layer of confirmation. When the price pulls back and the indicator shows an overbought condition, it signals a potential sell opportunity. In the chart, the sell signals are clearly marked where the indicator peaks and starts turning downward.
8 Combining price action with indicators increases the probability of success. Price action tells you what is happening, and indicators help confirm it. When both align, the trade becomes stronger and more reliable.
9 Risk management is what separates successful traders from the rest. Even the best setups can fail. Always place a stop loss above the recent lower high when taking a sell trade. This protects your capital and keeps you in the game for the long term.
10 Patience is the real edge in this strategy. Many traders lose money because they rush into trades. Waiting for the perfect pullback, confirmation of lower high, and indicator signal requires discipline, but it significantly improves accuracy.
11 Consistency comes from repeating the same process again and again. Identify the trend, wait for reversal signals, confirm the structure change, and enter on pullbacks. This structured approach removes emotional decision making and builds confidence over time.
12 The beauty of this strategy is its simplicity. You do not need complex indicators or complicated systems. Just understanding market structure, support and resistance, and timing your entry correctly can transform your trading.
CONCLUSION
Reversal trading with perfect pullbacks is not about predicting the market but about reacting to what the market is showing. When you combine chart patterns like double top with structure shifts like lower highs and confirmations from indicators like Stochastic RSI, you create a high probability trading setup. The real power lies in patience, discipline, and execution. Master this approach and you will stop chasing the market and start trading with confidence and clarity.
#trading #stockmarket #priceaction #reversaltrading #pullbacktrading #technicalanalysis #chartanalysis #tradingstrategy #intradaytrading #swingtrading #stocktrading #marketstructure #lowerhigh #higherlow #doubletop #breakout #breakdown #supportandresistance #stochasticrsi #tradingtips #learntrading #traderlife #marketanalysis #financialmarkets #stockmarketindia #nifty50 #banknifty #equitymarket #tradingcommunity #investing #wealthcreation #moneygrowth #marketinsights #tradingmindset #riskmanagement #patterntrading #markettrends #chartpatterns #tradingjourney #stockanalysis #tradingknowledge #technicaltrading #daytrading #scalping #marketpsychology #smarttrading #pricepatterns #marketlearning #tradingrules
3
4
160
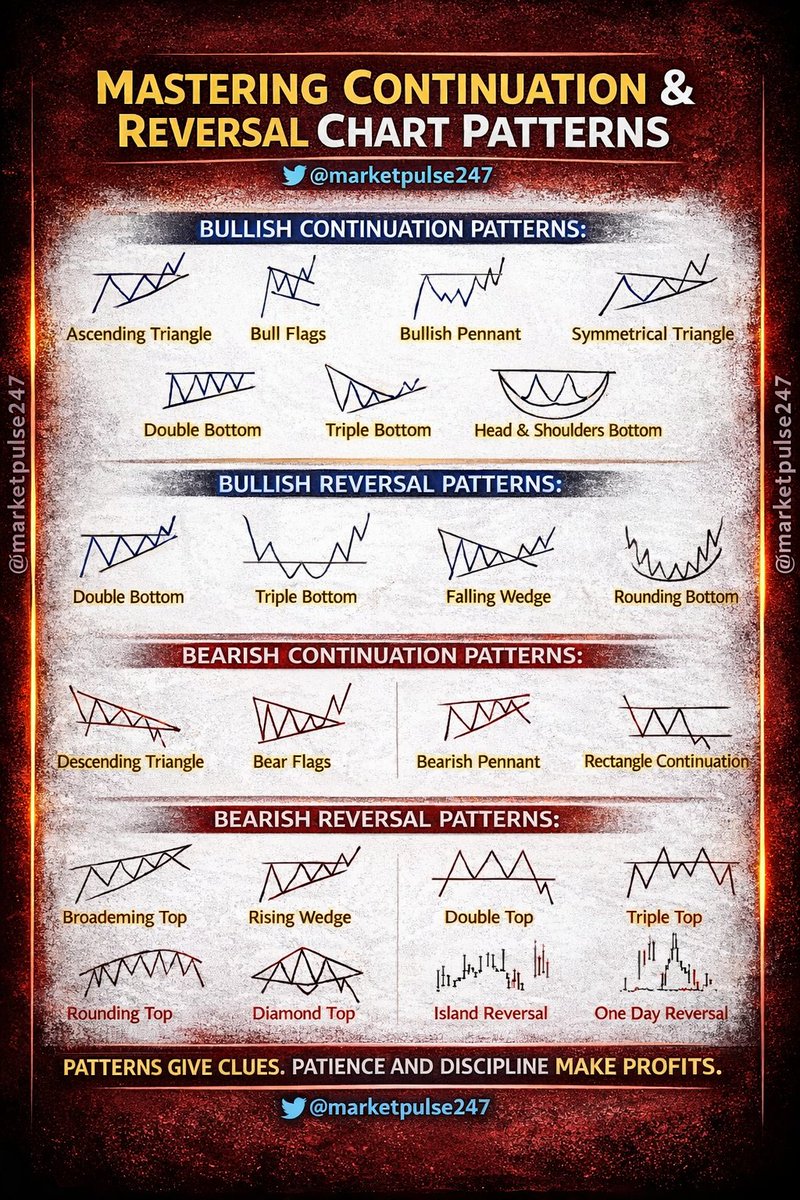
MASTERING CONTINUATION AND REVERSAL CHART PATTERNS FOR SMART TRADING
Understanding chart patterns is like learning the language of the market. Every movement, every pause, and every breakout tells a story. If you can read these patterns correctly, you can anticipate where the price is likely to move next. Let’s break down the most important continuation and reversal patterns in a simple, practical, and human way so you can actually use them in your trading journey.
1 Bullish continuation patterns signal that the trend is strong and likely to continue upward. These patterns usually form after a small pause in an uptrend. The ascending triangle is one of the most powerful patterns where the price keeps making higher lows while facing resistance at the same level. Once it breaks out, the move can be sharp. Bull flags are another favorite among traders. After a strong upward move, the price consolidates in a small downward channel before continuing higher. Bullish pennants look similar but are more compact and form a tight triangle before the breakout. Cup with handle is a classic long term pattern where the price forms a rounded bottom followed by a small pullback before breaking out. Symmetrical triangles can move in either direction but in an uptrend they often continue upward after consolidation.
2 Bullish reversal patterns indicate a shift from a downtrend to an uptrend. These are powerful because they mark the beginning of a new trend. Double bottom is one of the easiest to identify where the price tests the same low twice and then reverses upward. Triple bottom is similar but shows even stronger support as the price bounces three times from the same level. Falling wedge is a bullish pattern where price contracts while moving downward and eventually breaks upward. Head and shoulders bottom is a reliable reversal pattern that shows weakening selling pressure followed by a breakout. Rounding bottom is a slow and steady reversal where the price gradually shifts from selling to buying pressure.
3 Bearish continuation patterns tell you that the downtrend is likely to continue after a brief pause. Descending triangle is the opposite of ascending triangle where the price makes lower highs while holding a support level before breaking down. Bear flags form after a sharp fall followed by a small upward consolidation before continuing downward. Bearish pennants are similar but tighter in structure. Rising wedge is a dangerous pattern where the price moves upward in a narrowing range but eventually breaks down sharply. Rectangle continuation shows price moving sideways before continuing the downward trend.
4 Bearish reversal patterns signal that an uptrend is losing strength and may reverse downward. Broadening top shows increasing volatility with higher highs and lower lows before a breakdown. Rising wedge again appears here as a reversal pattern when formed after an uptrend. Double top and triple top are classic patterns where the price fails to break resistance multiple times and then falls. Head and shoulders top is one of the most reliable reversal patterns in trading. Rounding top indicates a slow shift from buying to selling pressure. Diamond top and island reversal are rare but powerful signals of a major trend change. One day reversal is a sharp signal where the price quickly changes direction in a single session.
5 The key to using these patterns is not just identifying them but confirming them. Always wait for a proper breakout with volume before entering a trade. Many traders lose money by predicting instead of reacting. The market rewards patience and discipline more than speed.
6 Risk management is equally important. No pattern works one hundred percent of the time. Always use stop loss and manage your position size. Even the best setup can fail, but with proper risk control, you can stay profitable in the long run.
7 Practice is what makes you confident. The more charts you study, the better you become at spotting these patterns in real time. Over time, you will develop an instinct that helps you act quickly and accurately.
CONCLUSION
Chart patterns are not magic but they are powerful tools when used correctly. They give you a structured way to understand market behavior and make informed decisions. If you combine pattern recognition with patience, discipline, and proper risk management, you can significantly improve your trading performance. Remember, the market always leaves clues, and those who learn to read them stay ahead of the crowd.
#trading #stockmarket #chartpatterns #technicalanalysis #priceaction #tradingstrategy #intradaytrading #swingtrading #stocktrading #marketanalysis #bullish #bearish #supportandresistance #breakouttrading #tradingeducation #learntrading #traderlife #marketstructure #candlestickpatterns #tradingtips #financialmarkets #stockmarketindia #nifty50 #banknifty #equitymarket #tradingcommunity #investing #wealthcreation #moneygrowth #marketinsights #tradingmindset #riskmanagement #patterntrading #markettrends #chartanalysis #tradingjourney #stockanalysis #tradingknowledge #technicaltrading #daytrading #scalping #marketpsychology #smarttrading #pricepatterns #marketlearning #tradingrules #investingtips #financialfreedom
3
6
277
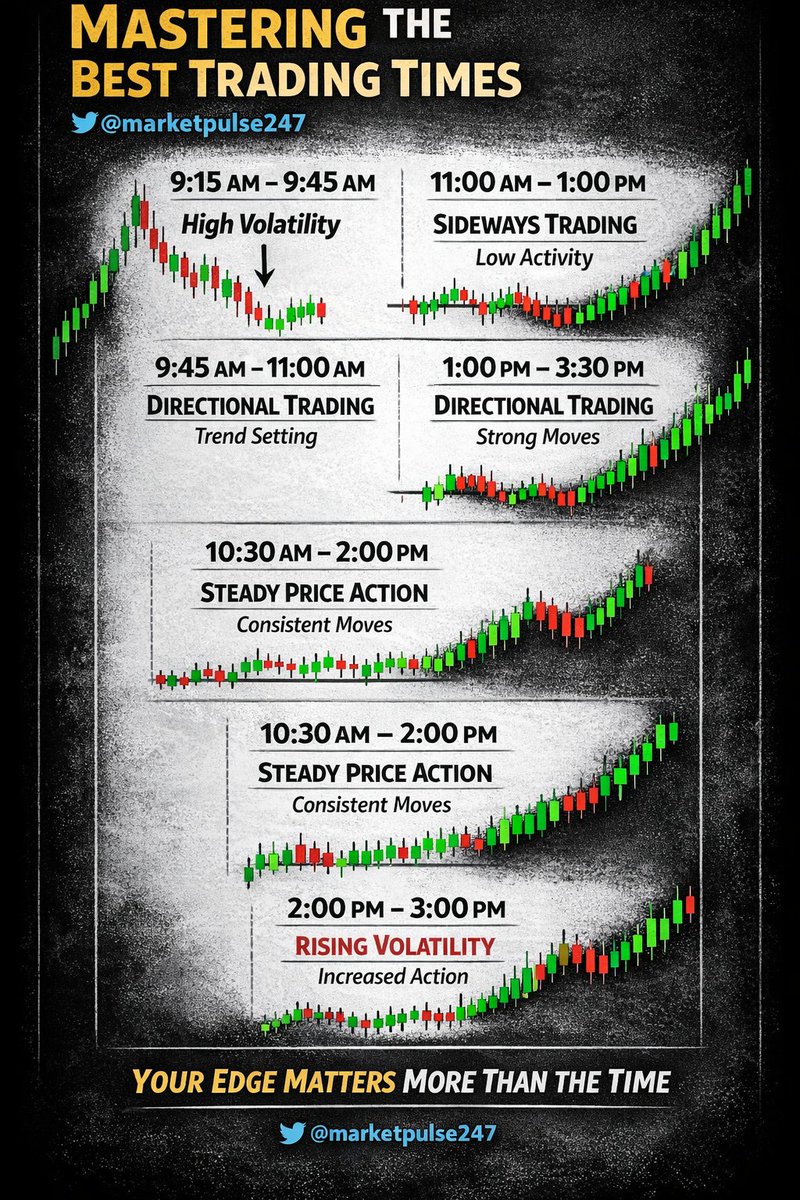
BEST TRADING TIME YOU DIDN’T KNOW
The stock market is not just about buying and selling at random moments. It moves in phases, and each phase carries a different personality. If you truly understand how the market behaves at different times of the day, your trading can become sharper, more confident, and more consistent. Let’s break down the trading day in a practical and human way so you can connect with it and use it effectively.
9:15 am to 9:45 am is the most energetic phase of the market. This is when the market opens and reacts to overnight news, global cues, and trader sentiment. Prices move fast and sometimes unpredictably. This is the ideal time for momentum trading because stocks tend to make strong directional moves. However, this phase requires quick decision making and strict risk management. If you hesitate here, you may miss the move or get trapped in false breakouts.
9:45 am to 11:00 am is when the market starts settling down a bit. The initial chaos reduces, and clearer trends begin to form. This is a great window for directional trading because you can identify whether the market is leaning bullish or bearish. Traders who missed the opening move often enter here after confirming the trend. Patience during the first 30 minutes pays off in this phase.
11:00 am to 1:00 pm is typically the slowest period of the day. The market often moves sideways with limited volatility. Many traders lose money here because they try to force trades when there is no clear direction. This is a time for discipline. Instead of trading aggressively, experienced traders either reduce position size or stay out completely. Sometimes the best trade is no trade.
1:00 pm to 3:30 pm marks the return of momentum and direction. As the market approaches closing, institutional players become active again. This creates fresh opportunities for directional trading. Breakouts and reversals during this phase can be powerful because they are often backed by strong volume. Traders who remain patient throughout the day are rewarded here.
10:30 am to 2:00 pm is known for relatively steady price action. Compared to the opening and closing hours, this period offers smoother movements and better structure. For traders who prefer less noise and more predictable setups, this can be a comfortable window. Strategies like range trading or pullback trading tend to work well here.
9:15 am to 10:30 am is the high volatility zone. This is where big moves happen quickly. While this creates opportunities, it also increases risk. Many beginners get attracted to this phase because of the excitement, but without proper discipline, losses can be just as fast as profits. If you are trading in this window, your stop loss and position sizing must be precise.
2:00 pm to 3:00 pm often sees a rise in volatility again. Traders start adjusting positions before market close, and this leads to sudden price movements. This is a great time for short term trades, especially if you can identify strong setups. However, false breakouts can also occur, so confirmation is key.
At the end of the day, timing is important, but it is not everything. Many traders keep searching for the perfect time, but they forget one crucial truth. No matter what time you trade, your edge matters the most. Your strategy, your discipline, your risk management, and your mindset will always define your success more than the clock.
CONCLUSION
The market gives opportunities throughout the day, but not all hours are equal. If you align your trading style with the right time window, you increase your probability of success. But never forget, time alone will not make you profitable. Your edge is your real power. Master your edge, respect the market’s rhythm, and you will stay ahead of the crowd.
x.com/Marketpulse247/status/…
#trading #stockmarket #intradaytrading #tradingtips #sharemarket #daytrading #stockmarketindia #nifty50 #banknifty #momentumtrading #technicalanalysis #tradingstrategy #priceaction #stocktrading #tradinglife #trader #investing #marketanalysis #equitymarket #financialfreedom #tradingeducation #markettrends #intradaytips #profitmaking #riskmanagement #stocktips #tradingmindset #marketpsychology #supportandresistance #chartanalysis #breakouttrading #volatility #marketvolatility #scalping #swingtrading #indianstockmarket #nseindia #bseindia #tradingcommunity #moneygrowth #wealthcreation #financialmarkets #stockanalysis #learntrading #tradingjourney #marketinsights #intradaystrategy #tradingknowledge #moneymanagement
BEST TRADING TIME YOU DIDN’T KNOW
The stock market is not just about buying and selling at random moments. It moves in phases, and each phase carries a different personality. If you truly understand how the market behaves at different times of the day, your trading can become sharper, more confident, and more consistent. Let’s break down the trading day in a practical and human way so you can connect with it and use it effectively.
9:15 am to 9:45 am is the most energetic phase of the market. This is when the market opens and reacts to overnight news, global cues, and trader sentiment. Prices move fast and sometimes unpredictably. This is the ideal time for momentum trading because stocks tend to make strong directional moves. However, this phase requires quick decision making and strict risk management. If you hesitate here, you may miss the move or get trapped in false breakouts.
9:45 am to 11:00 am is when the market starts settling down a bit. The initial chaos reduces, and clearer trends begin to form. This is a great window for directional trading because you can identify whether the market is leaning bullish or bearish. Traders who missed the opening move often enter here after confirming the trend. Patience during the first 30 minutes pays off in this phase.
11:00 am to 1:00 pm is typically the slowest period of the day. The market often moves sideways with limited volatility. Many traders lose money here because they try to force trades when there is no clear direction. This is a time for discipline. Instead of trading aggressively, experienced traders either reduce position size or stay out completely. Sometimes the best trade is no trade.
1:00 pm to 3:30 pm marks the return of momentum and direction. As the market approaches closing, institutional players become active again. This creates fresh opportunities for directional trading. Breakouts and reversals during this phase can be powerful because they are often backed by strong volume. Traders who remain patient throughout the day are rewarded here.
10:30 am to 2:00 pm is known for relatively steady price action. Compared to the opening and closing hours, this period offers smoother movements and better structure. For traders who prefer less noise and more predictable setups, this can be a comfortable window. Strategies like range trading or pullback trading tend to work well here.
9:15 am to 10:30 am is the high volatility zone. This is where big moves happen quickly. While this creates opportunities, it also increases risk. Many beginners get attracted to this phase because of the excitement, but without proper discipline, losses can be just as fast as profits. If you are trading in this window, your stop loss and position sizing must be precise.
2:00 pm to 3:00 pm often sees a rise in volatility again. Traders start adjusting positions before market close, and this leads to sudden price movements. This is a great time for short term trades, especially if you can identify strong setups. However, false breakouts can also occur, so confirmation is key.
At the end of the day, timing is important, but it is not everything. Many traders keep searching for the perfect time, but they forget one crucial truth. No matter what time you trade, your edge matters the most. Your strategy, your discipline, your risk management, and your mindset will always define your success more than the clock.
CONCLUSION
The market gives opportunities throughout the day, but not all hours are equal. If you align your trading style with the right time window, you increase your probability of success. But never forget, time alone will not make you profitable. Your edge is your real power. Master your edge, respect the market’s rhythm, and you will stay ahead of the crowd.
#trading #stockmarket #intradaytrading #tradingtips #sharemarket #daytrading #stockmarketindia #nifty50 #banknifty #momentumtrading #technicalanalysis #tradingstrategy #priceaction #stocktrading #tradinglife #trader #investing #marketanalysis #equitymarket #financialfreedom #tradingeducation #markettrends #intradaytips #profitmaking #riskmanagement #stocktips #tradingmindset #marketpsychology #supportandresistance #chartanalysis #breakouttrading #volatility #marketvolatility #scalping #swingtrading #indianstockmarket #nseindia #bseindia #tradingcommunity #moneygrowth #wealthcreation #financialmarkets #stockanalysis #learntrading #tradingjourney #marketinsights #intradaystrategy #tradingknowledge #moneymanagement
3
4
179

Inflation is cooling—but what happens next? Rising oil prices could shift the outlook again. Understanding these trends can help you make more informed trading decisions.
Read more: bit.ly/4stTy5t 📉📈
#MarketInsights #Inflation #TradingKnowledge
2
2
48

📊 Before crypto, there was TradFi. But what exactly is it, and why does it still matter today? 🏦
If you’ve been in crypto for a while, you’ve probably heard the term TradFi.
It stands for Traditional Finance: the financial system most of the world still uses today.
This includes:
• Banks 🏦
• Stock markets 📈
• Governments and central banks
• Payment systems and financial institutions
In TradFi, transactions are usually handled through intermediaries like banks or brokers who verify, process, and control financial activity.
So what’s the difference compared to crypto?
Crypto (and DeFi: Decentralized Finance) removes or reduces the need for intermediaries by using blockchain technology.
Transactions can happen directly between users, often faster and with more transparency.
Why does TradFi still matter?
Because it remains the foundation of global finance:
🔹 Most capital still flows through traditional systems
🔹 Regulations and policies are shaped by TradFi institutions
🔹 Crypto markets are often influenced by TradFi events (interest rates, inflation, stock market trends)
For beginners, understanding TradFi helps you see where crypto comes from and what it’s trying to improve.
For experienced traders, it’s essential. Market movements in crypto are often tied to macroeconomic factors driven by TradFi.
In simple terms:
You can’t fully understand crypto without understanding the system it’s evolving from.
#TradFi
#CryptoEducation
#FinancialMarkets
#BlockchainBasics
#CryptoTrading
#MacroEconomics
#DigitalAssets
#TradingKnowledge
#GlobalFinance
#BingXLearning

1
4
37

What Is Slippage in Trading?
When you place a trade, you expect it to execute at a specific price. But sometimes the order fills at a slightly different price. This difference is called slippage.
Slippage happens because orders are matched based on available liquidity. If there aren’t enough orders at your target price, the trade executes at the next available level. This often occurs during high volatility or in markets with lower liquidity.
Order type also matters when it comes to slippage:
🔹 Slippage – the difference between expected price and executed price
🔹 Why it happens – fast price movement or low liquidity
🔹 Market vs Limit order – market orders execute instantly, limit orders wait for your chosen price
In crypto markets, some slippage is normal. The key is understanding when it happens and choosing the right order type for your trade.
Trade with structure on Aivora 👇
aivora.com
#Aivora #CryptoEducation #CryptoTrading #Slippage #TradingBasics #TradingKnowledge
26
3
37
3,632
Market Structure: The Foundation of Every Trend
Many traders rely on indicators, but the most important signal is often price structure. Market structure shows how price moves through highs and lows, helping traders understand whether the market is trending up or down.
In an uptrend, price forms higher highs and higher lows, showing strong demand. In a downtrend, price forms lower highs and lower lows, meaning sellers control the market. Reading this pattern helps traders understand who is in control.
Traders track a few basic structure signals:
🔹 HH (Higher High) – price breaks above the previous high
🔹 HL (Higher Low) – pullback that holds above the previous low
🔹 LH (Lower High) – bounce that fails to break the previous high
🔹 LL (Lower Low) – price breaks below the previous low
A trend can change when this pattern breaks. For example, if an uptrend suddenly breaks a higher low, the market structure may be turning bearish.
Understanding market structure gives context before using indicators or strategies. If you can read the structure, you can read the market.
Trade with structure on Aivora 👇
aivora.com
#Aivora #TradingEducation #MarketStructure #CryptoTrading #TechnicalAnalysis #TradingKnowledge

23
16
79
4,283
What Is Market Cap? Stop Looking Only at Coin Price
Many beginners think a low price means a coin is cheap. A token at $0.0001 feels like a huge opportunity compared to something like Bitcoin. But price alone means nothing without context.
What actually matters is market capitalization. Market cap shows the total value of a cryptocurrency and is calculated by multiplying price with circulating supply. A coin can look cheap per unit, but if the supply is massive, the total value may already be very large.
Another important concept is the difference between supply types:
🔹 Market Cap = Price × Circulating Supply
🔹 Circulating Supply is the number of tokens currently in the market
🔹 Total Supply includes tokens that may unlock in the future
That’s why a $0.0001 coin isn’t automatically cheap. If billions or trillions of tokens exist, the market cap may already be huge, leaving limited room for growth.
Smart traders don’t judge projects by price. They analyze market cap, supply dynamics, and real demand. Price is just a number, but market cap reveals the bigger picture.
Trade with structure on Aivora 👇
aivora.com
#Aivora #CryptoEducation #MarketCap #CryptoBasics #CryptoTrading #TradingKnowledge

21
26
104
4,593

Feb 15
J.P. Morgan in 1912: "Gold is money. Everything else is credit."
#FinanceHistory #Gold #MarketInsights #EconomicWisdom #TradingKnowledge #Investing

5
9
128

Forex or Crypto — Which Market Fits YOU Best? 🤔
Every trader wants profits… but not every market suits every trader.
This blog helps you understand the real difference between Forex & Crypto
from volatility, liquidity, trading hours, to risk levels —
so you can choose what actually matches your strategy.
If you’re confused where to focus — this is a must-read. 📚
🔗 Read the full blog here:
finsaitrade.com/blogs/forex-…
#ForexVsCrypto #TradingEducation #LearnTrading #TradingKnowledge #FinsaiAcademy #FinsaiTrade
1
10
77
Tokenized stocks sound like shares, but do they give you shareholder rights? The answer matters. 📉📈
Tokenized stocks are gaining attention in crypto, but many traders still ask a key question:
Do they actually make you a shareholder?
Tokenized stocks are digital assets that track the price of traditional shares. They’re designed to offer market exposure, not legal ownership.
That distinction is important.
Here’s why it matters:
🔹 No voting rights or dividends in most cases
🔹 Tokenized stocks follow price movements, not corporate governance
🔹 They’re built for accessibility and flexibility, not shareholder privileges
For beginners, this clears up a common misunderstanding:
Tokenized stocks are about price exposure, not owning part of a company.
For experienced traders, they offer an alternative way to trade global markets, often with extended hours, smaller position sizes, and faster execution, while understanding the limits is essential for risk management.
As finance and blockchain continue to intersect, knowing what you’re actually trading becomes just as important as tracking price action.
BingX breaks down these concepts to help traders navigate new financial instruments with clarity, not confusion.
#TokenizedStocks #CryptoEducation
#TradingBasics #MarketExposure
#CryptoTrading #FinancialLiteracy
#BlockchainFinance #BingXLearning
#TradingKnowledge #CryptoCommunity
2
6
103

1
1
6
919

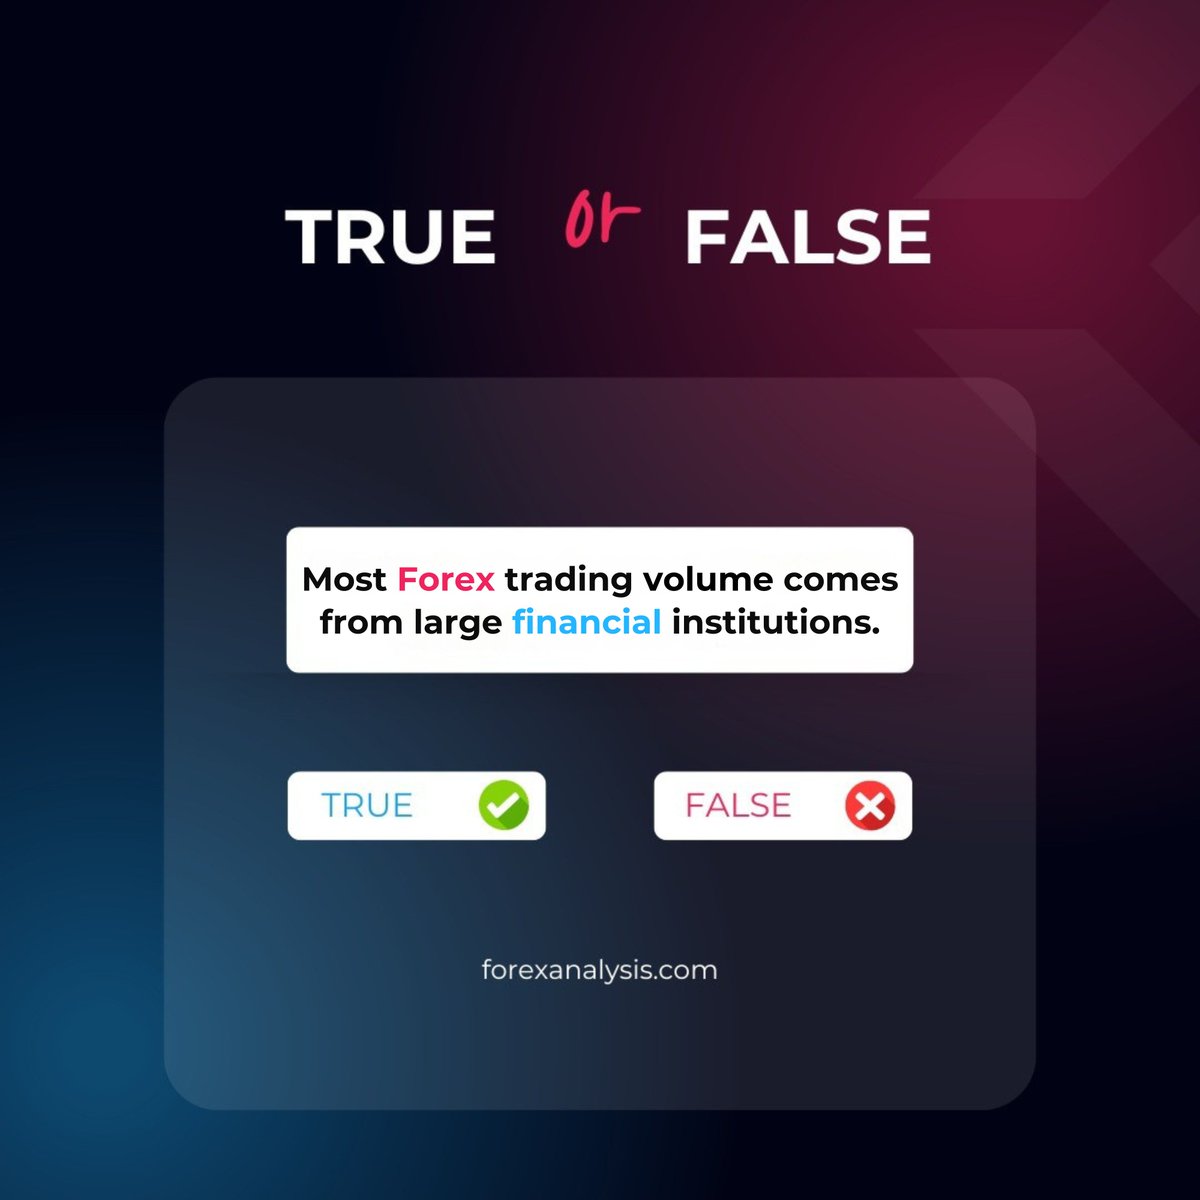
💡 True or False?
Most Forex trading volume comes from large financial institutions. ✅❌
What’s your guess? Drop your answer below! ⬇️
.
.
.
#ForexQuiz #TradingKnowledge #ForexFacts #MarketInsights #TraderEducation
15
151