
May 20
Power BI just removed one of the biggest pains in reporting.
Visual Calculations are now Generally Available.
Running totals, moving averages, rank… all directly inside the visual.
No DAX. No extra measures. No more waiting.
I put together a 10-second video showing exactly how it works.
This is going to save report authors (and us) hours every week.
Which calculation are you most excited to stop writing in DAX?
#PowerBI #MicrosoftFabric #VisualCalculations #DAX #DataStorytelling
1
2
54

1
9
733

Feb 21
Support for visual calculations, and their lineage, has arrived along with support for enhanced meta data (#PBIR). Get insights into lineage so you can make changes to visuals, reports and semantic models with confidence. Try it out: app.datavizioner.com/signup #visualcalculations
2
48
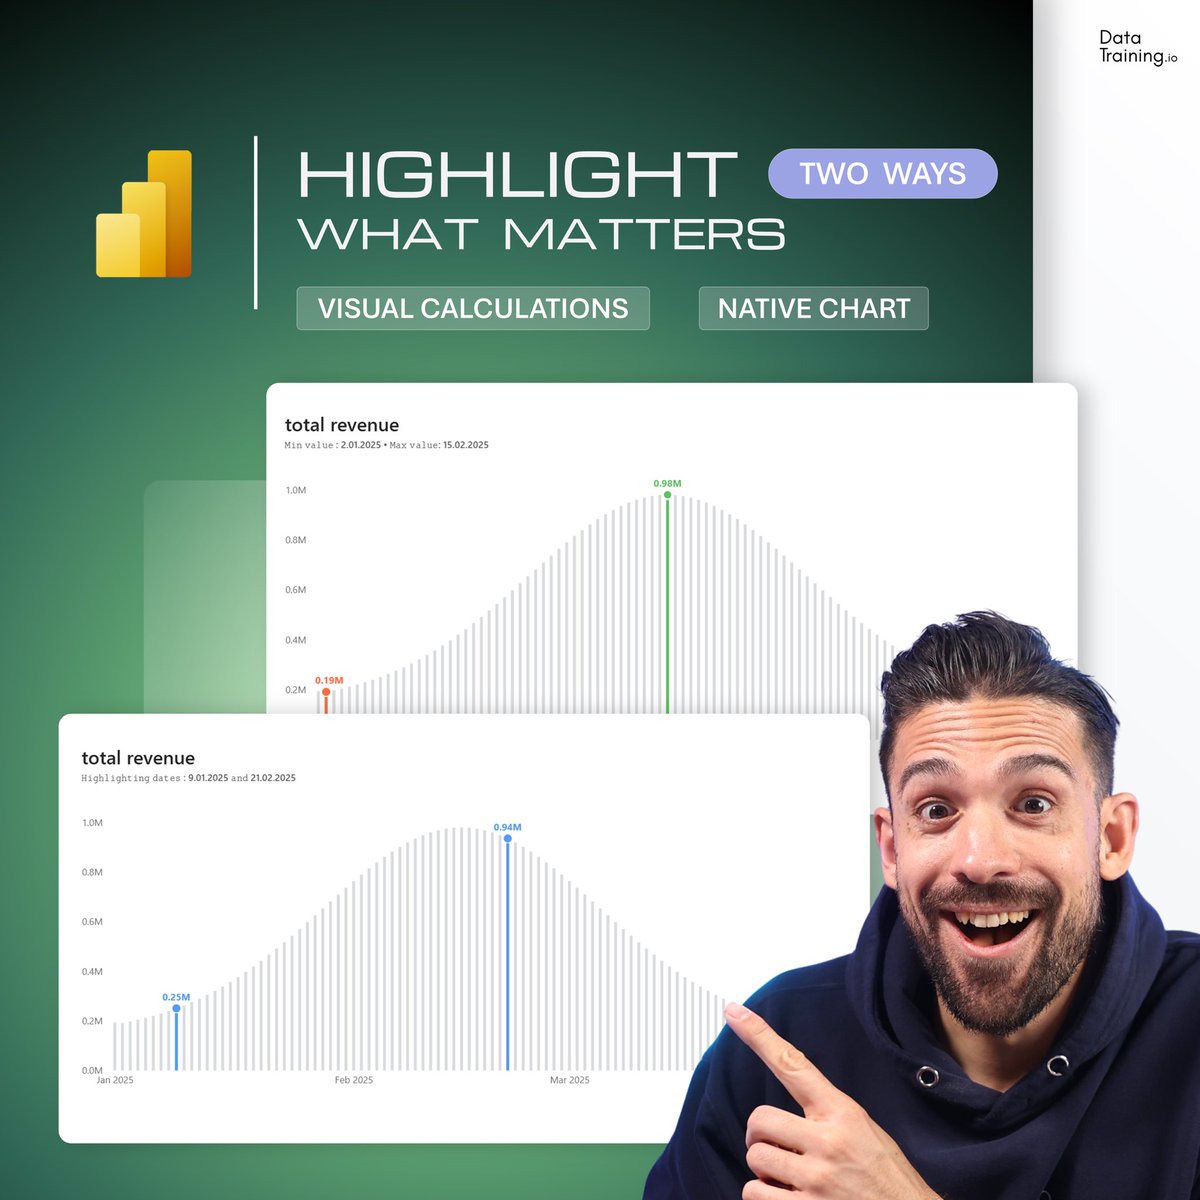
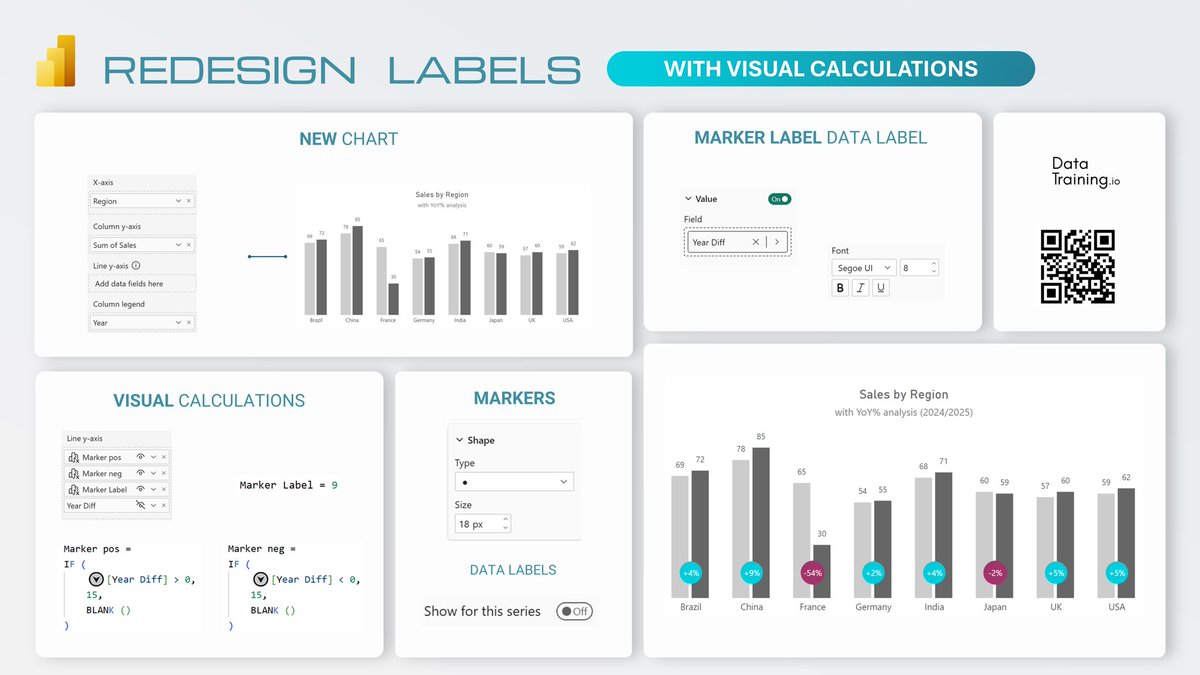
✨Redesign Labels with Visual Calculations in Power BI
If growth numbers are what matters most, here is how highlight what HAS CHANGED, not just what IS.
Step 1: Build the Base Chart: Combo
Create a chart with two columns for the same category.
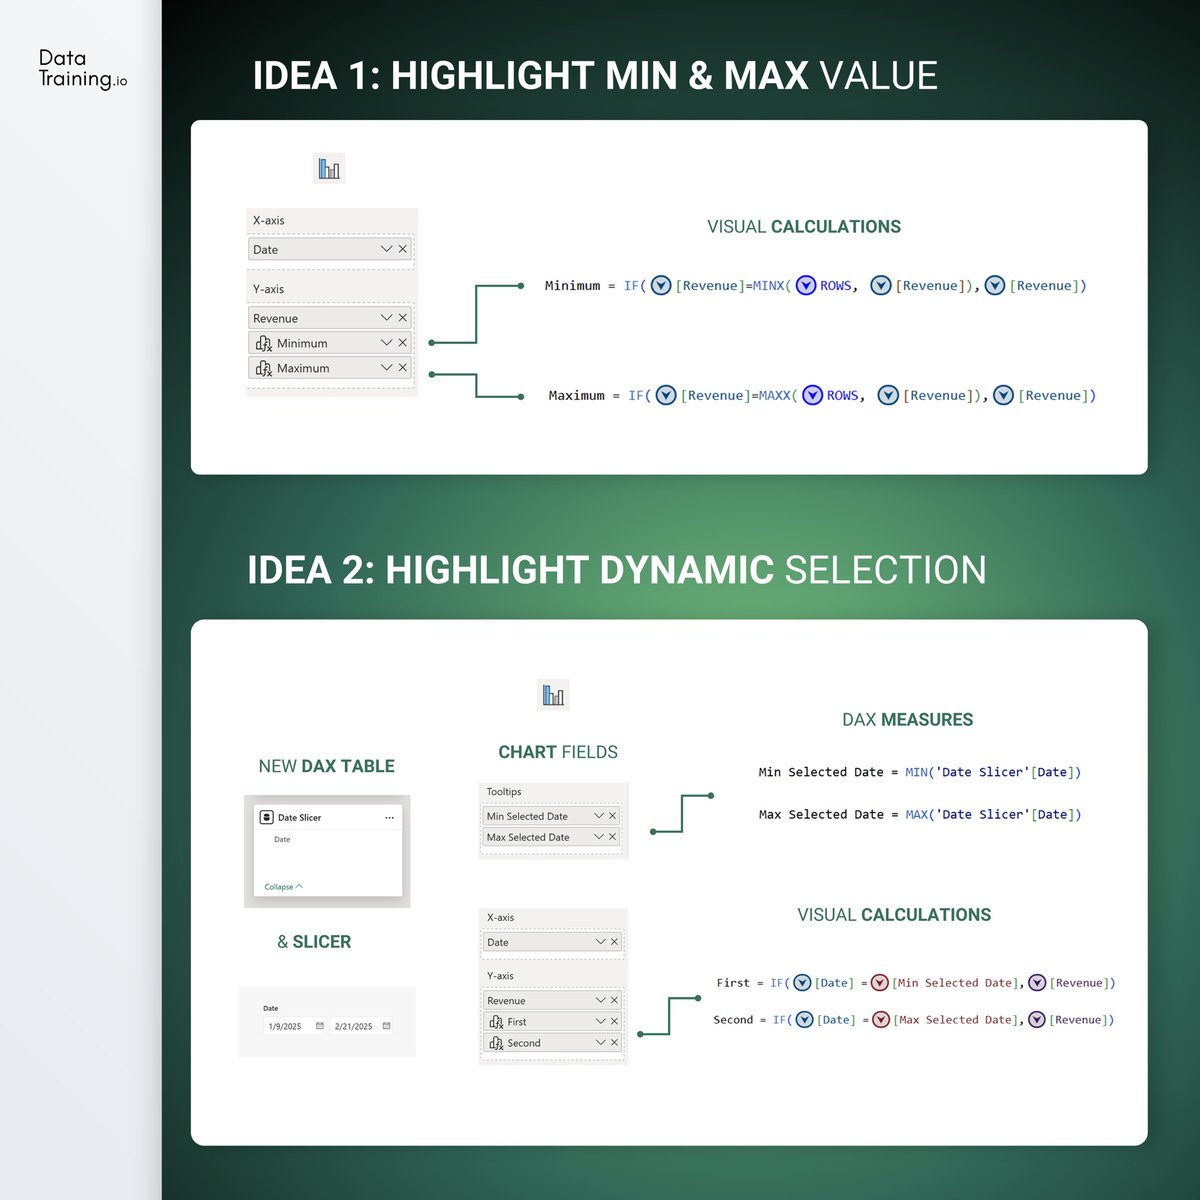
Step 2: Use Visual Calculations
Add visual calculations for positive and negative markers.
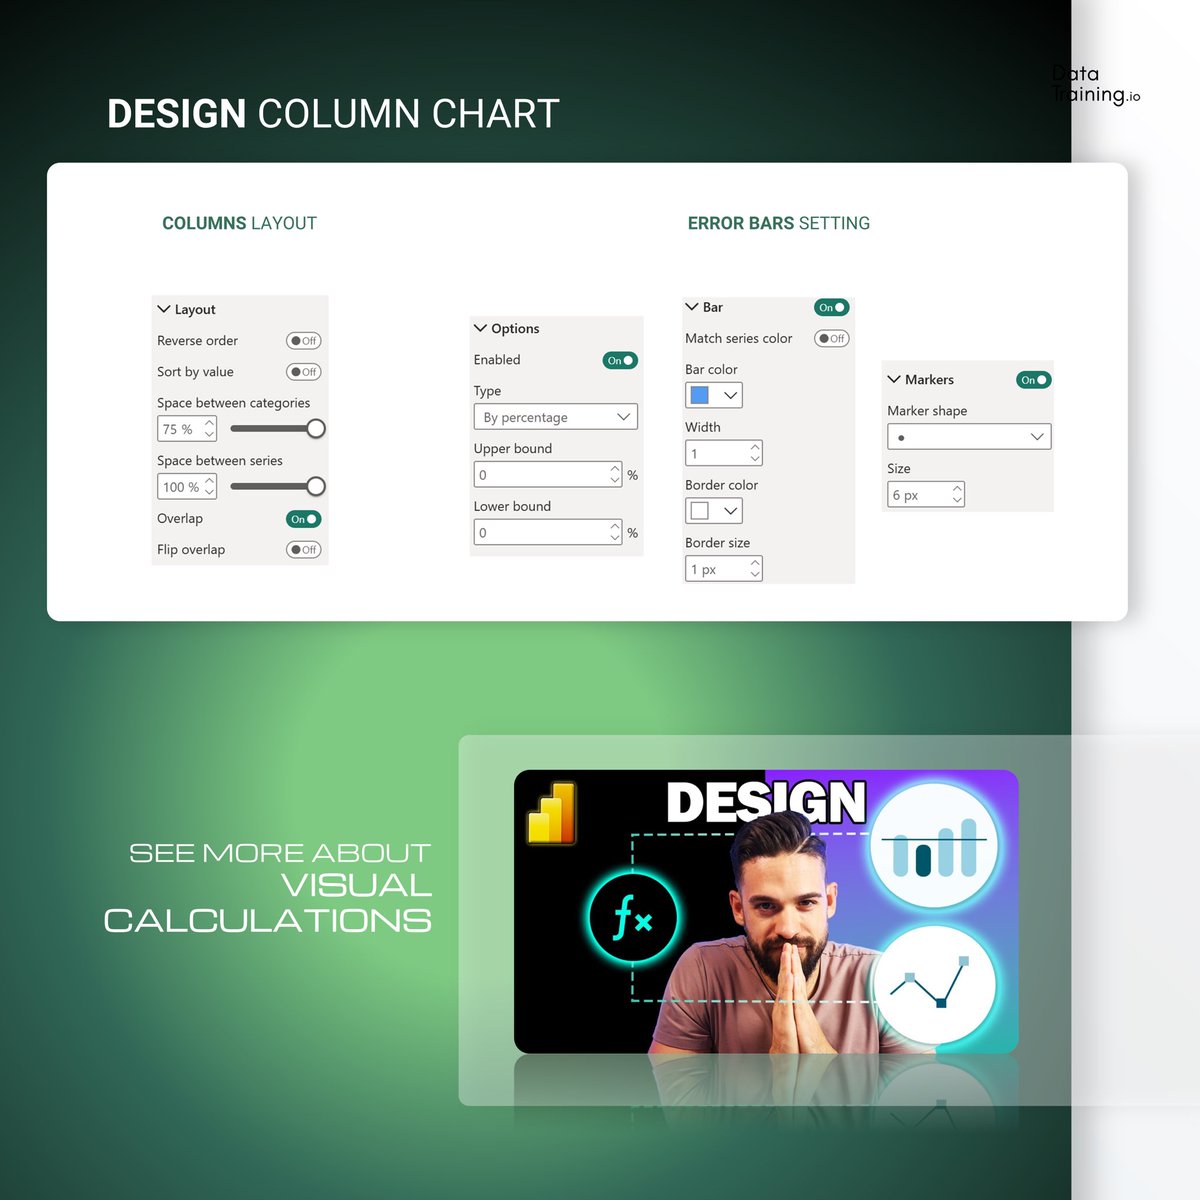
Step 3: Add Invisible Lines and Markers
Use the visual calculations for line Y-Axis. Add and format the markers.
Step 4: Scale Markers
Increase the marker size to the maximum.
Step 5: Add Marker Labels
Create a label measure, for example a year difference.
Assign it to the marker label.
#powerbi #labels #report #design #visualcalculations
3
2
24
870
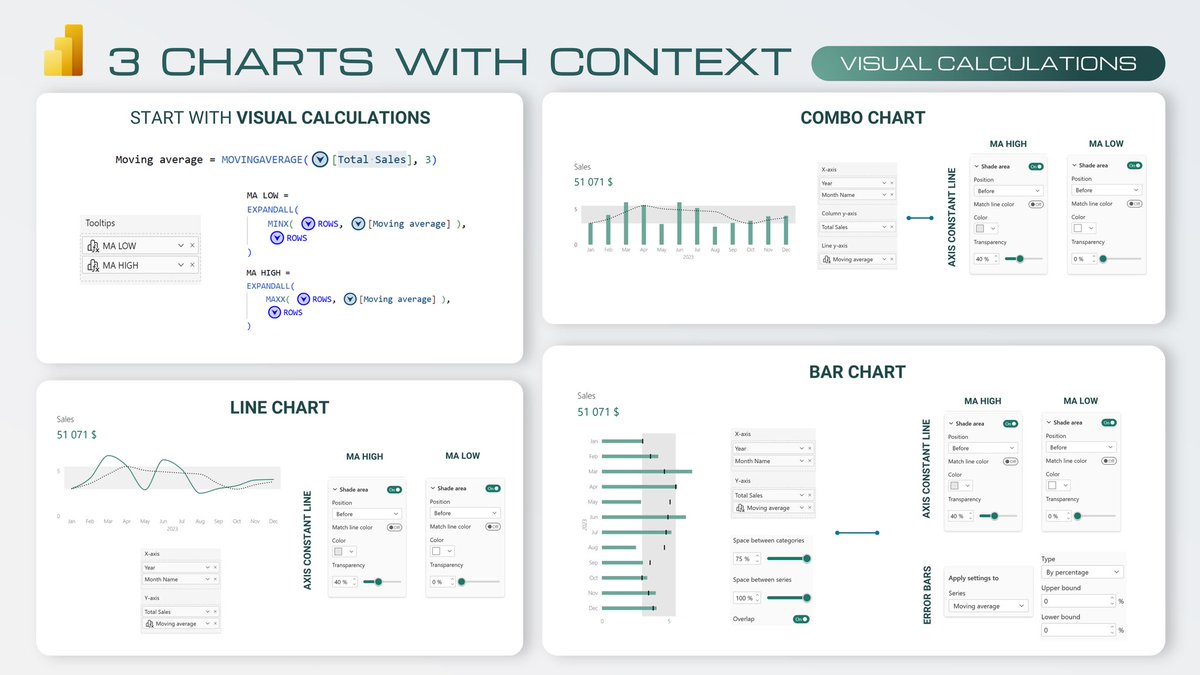
✨Adding Context to the Numbers with Visual Calculations
Moving average range in 3 main chart types.
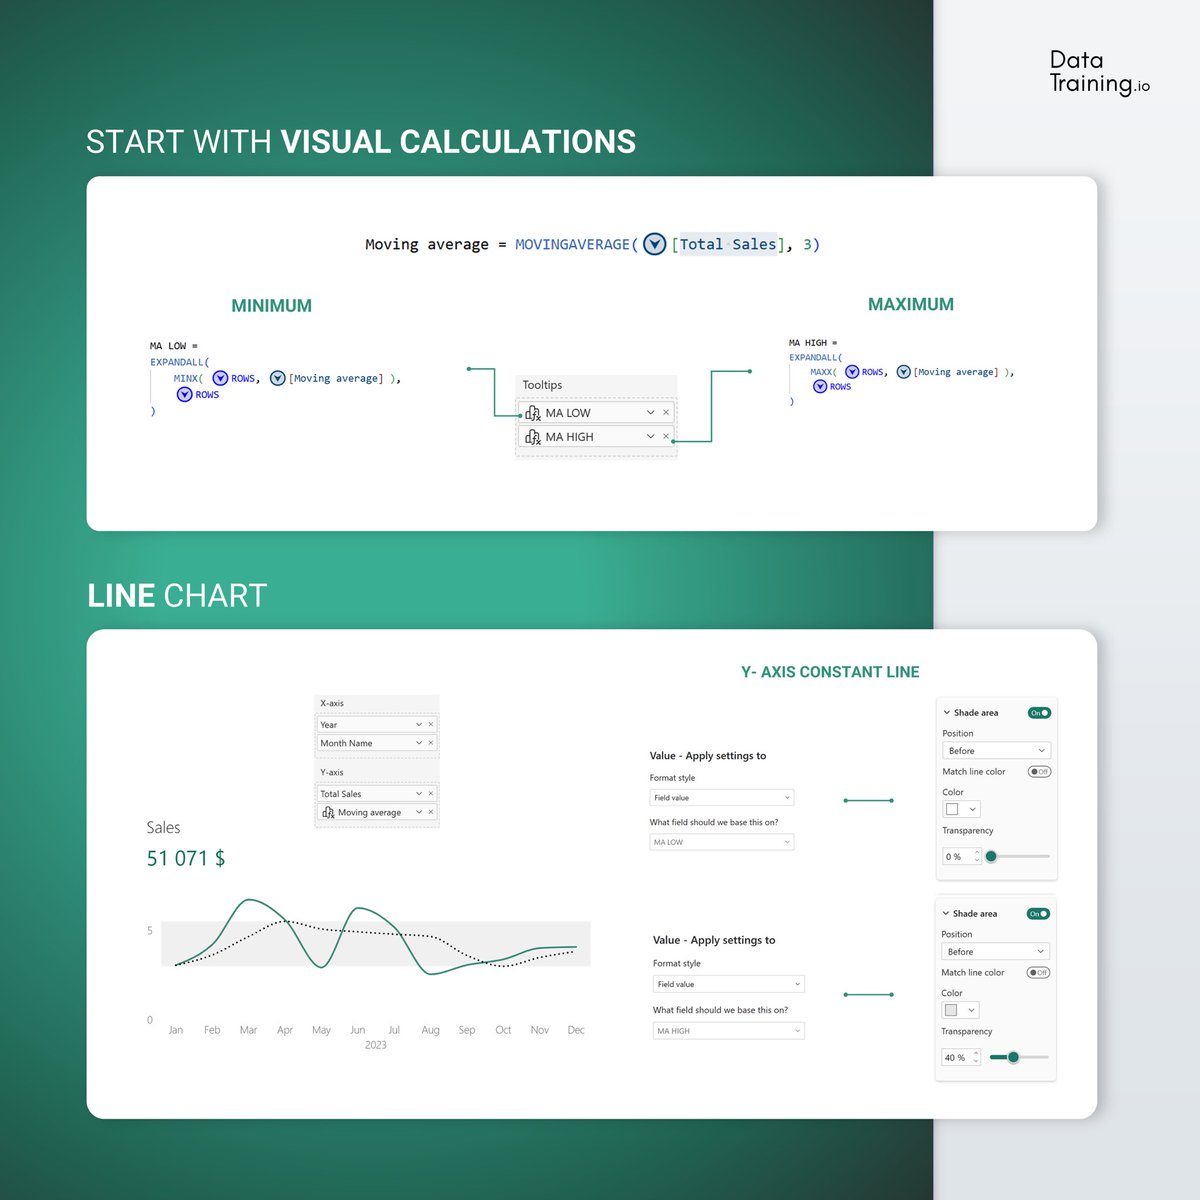
Step 1: Visual Calculations!
Create Moving Average, then calculate MA Min and MA Max inside the visual.
Step 2: Axis Constant Lines
Use axis constant lines with shading for MA Min and MA Max. It will show the range between both values.
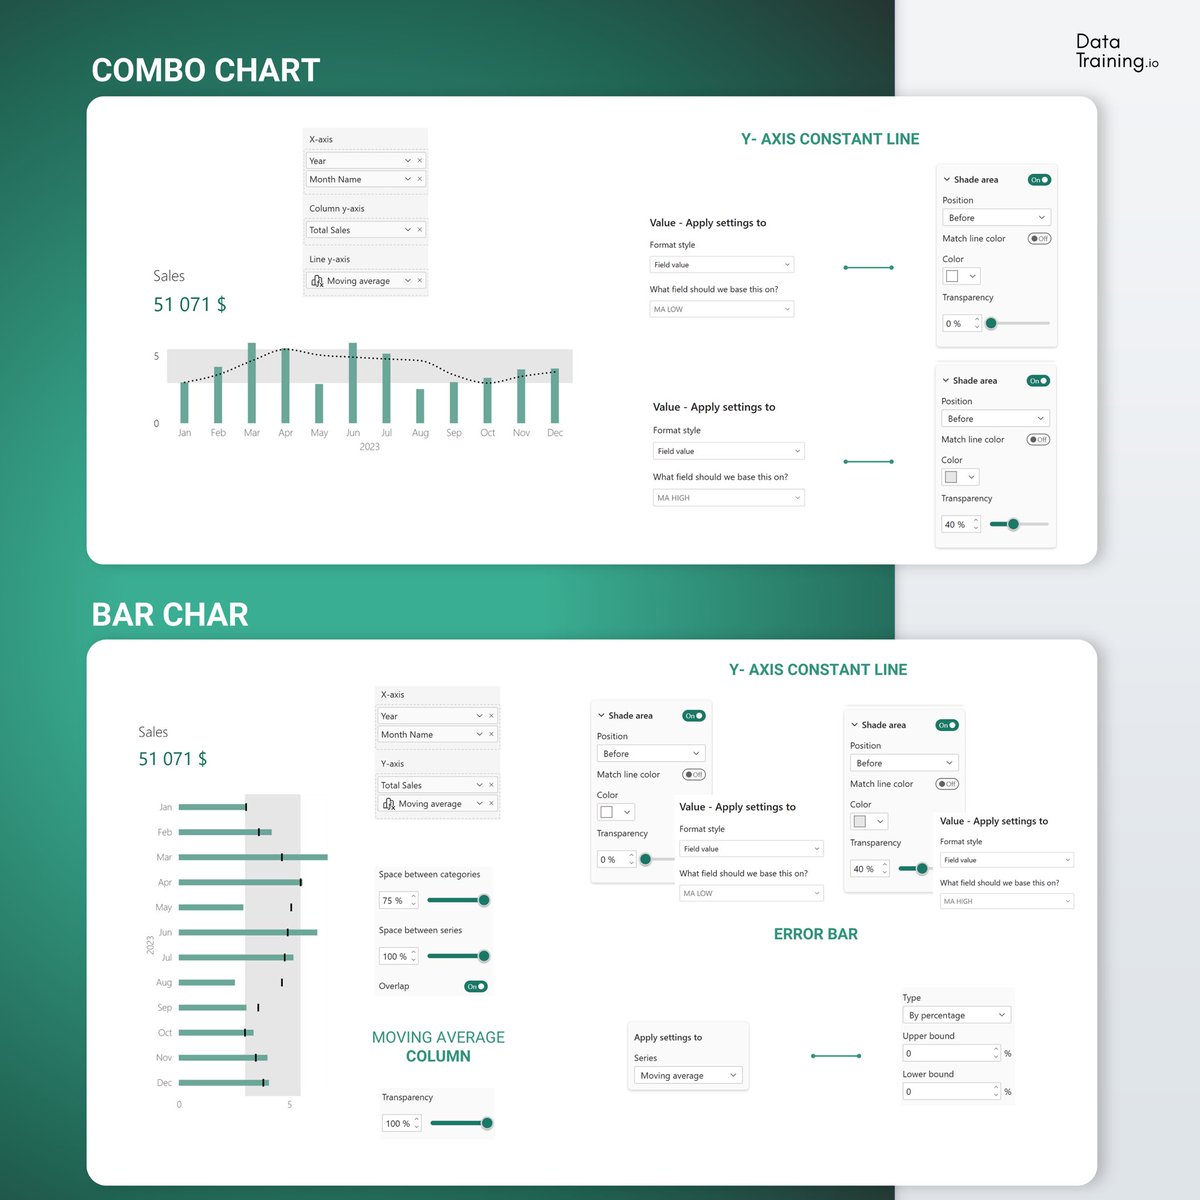
Step 3: Chart Variants
Apply the same logic of step 3 for:
• Line Chart
• Combo Chart
• Bar Chart
Step 4: Moving Average Focus
Add for moving average bar Error Bars to reinforce the range on bar chart. Make bar 100% transparent
Next Power BI Design Transformation begins in 29 days! 🚀Link below
#powerbi #context #charts #visualcalculations
1
4
28
856

26 Dec 2025
Three Examples for Visualizing Context with Visual Calculations in Power BI 🚀
#powerbi #visualization #report #design #visualcalculations


1
1
2
830

11 Mar 2025
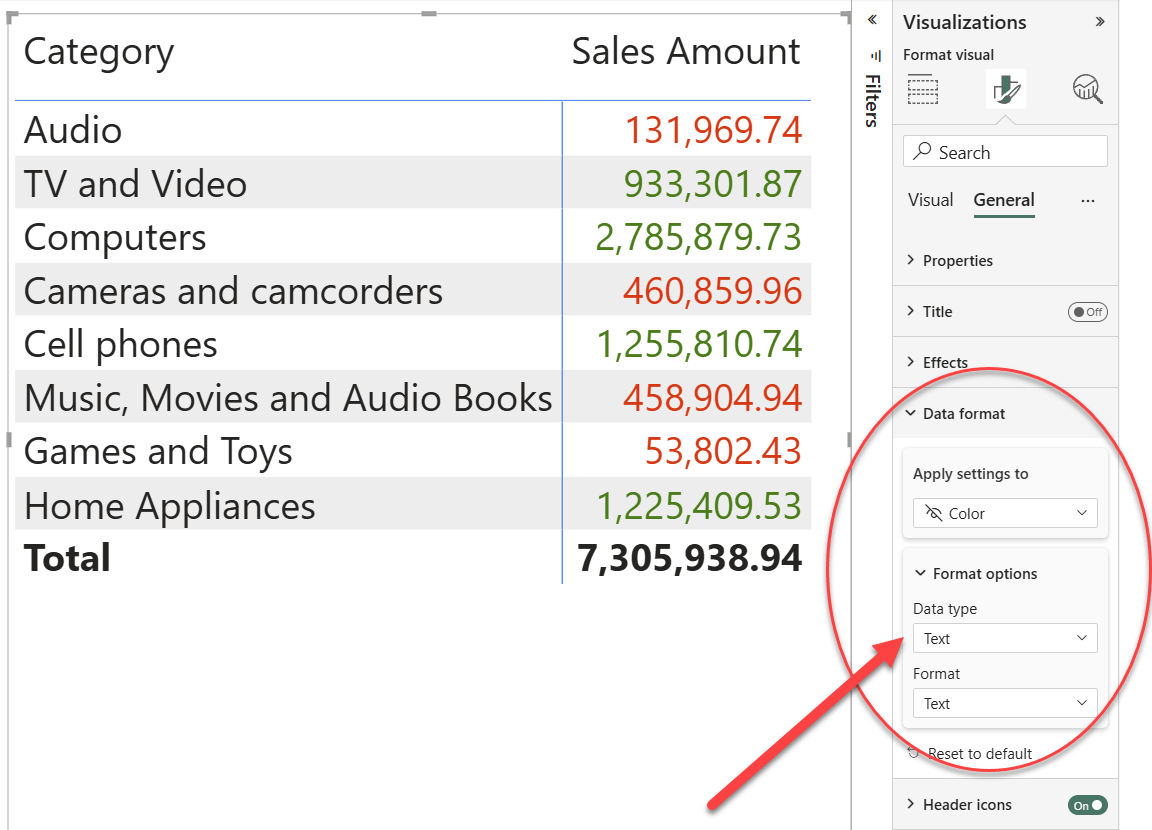
Visual calculations are useful for performing calculations specific to a visual.
Conditional formatting, as described in this article video, is a great application of #visualcalculations.
#powerbi #datavisualization #dax
sqlbi.com/articles/account-r…
5
11
73
4,456
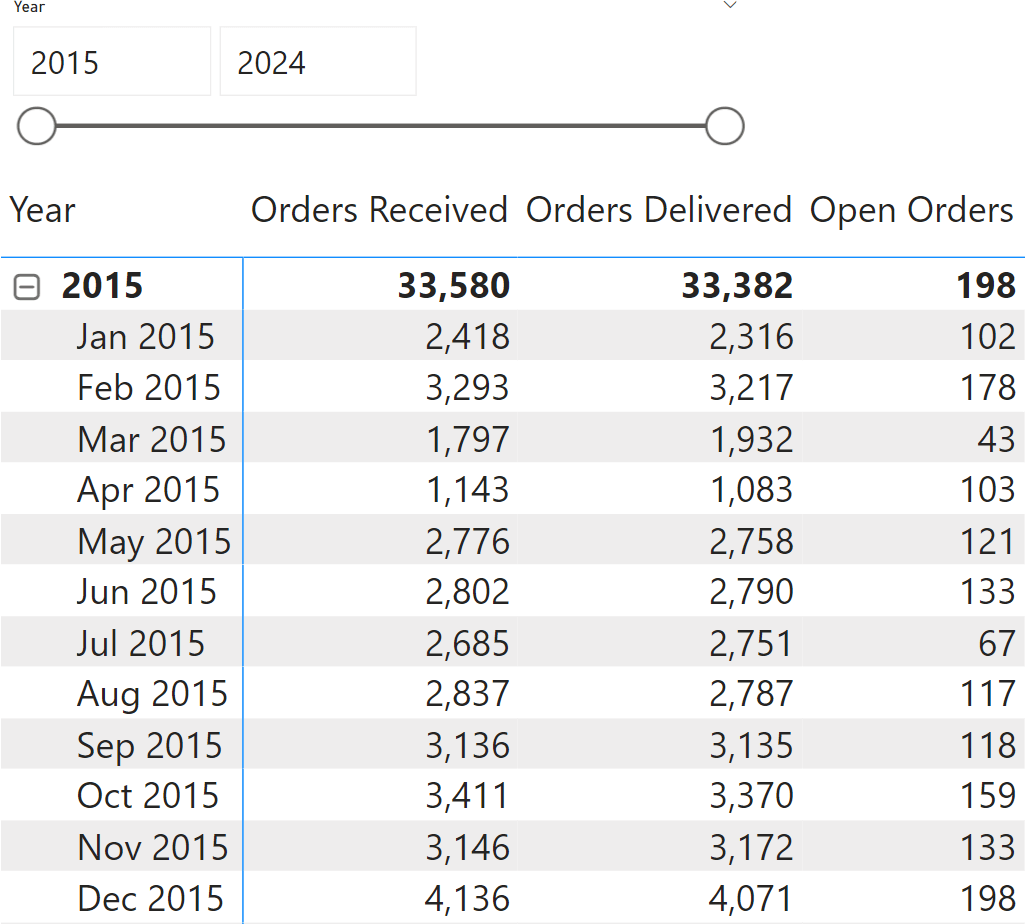
19 Nov 2024
This article describes the use of 𝘃𝗶𝘀𝘂𝗮𝗹 𝗰𝗮𝗹𝗰𝘂𝗹𝗮𝘁𝗶𝗼𝗻𝘀 for a scenario where they may be particularly relevant: computing open orders at the end of a time period.
#dax #visualcalculations #powerbi
sqlbi.com/articles/computing…
1
10
44
2,213

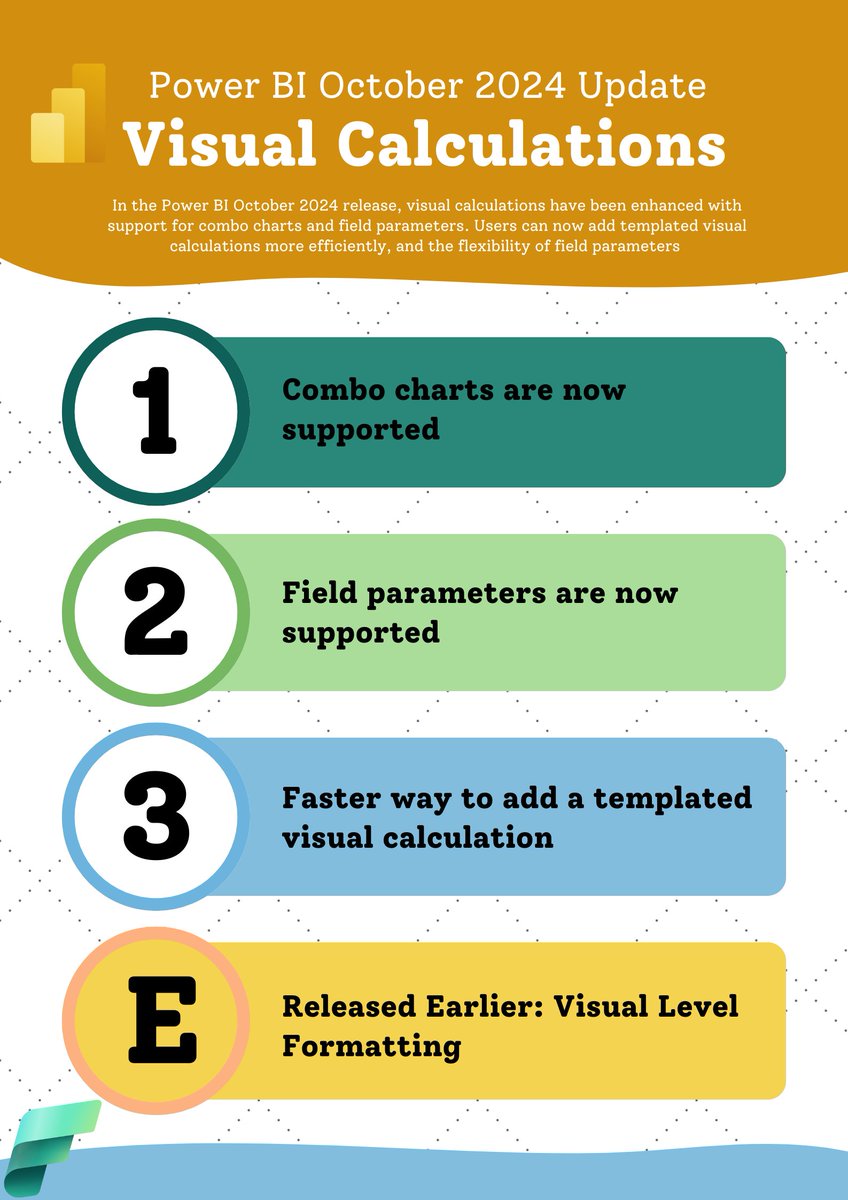
29 Oct 2024
Throwback- Visual calculations: Take next level with Field Parameters, Support of Comobo Visual and Visual level formatting
youtube.com/watch?v=mx5xyxQh…
#PowerBI #Visualcalculations #DAX #powerquery #AmitChandakDA #businessintelligence
2
152
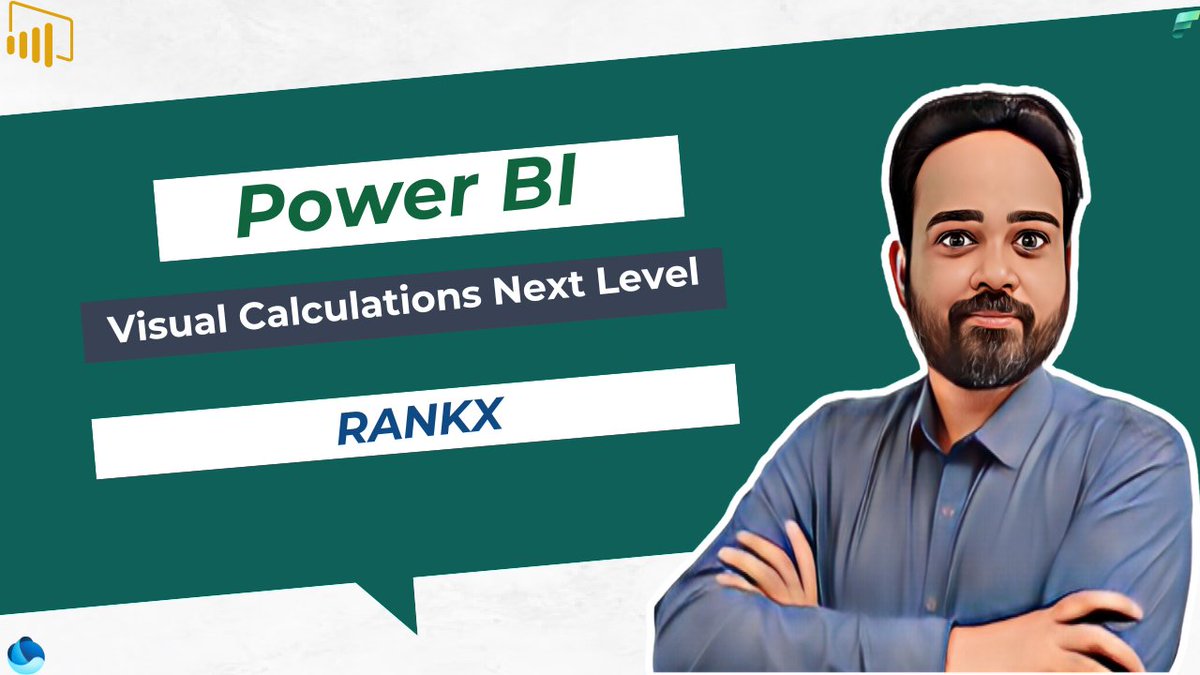
29 Jul 2024
🌟 Throwback- Visual Calculations Part 2 - Next-Level Power BI Visual Calculations with Offset, Index, Rank, RowNumber| February 2024 Update:
youtube.com/watch?v=JwMF0end…
#PowerBI #DAX #PowerQuery #DataAnalysis #VisualCalculations #BusinessIntelligence #PowerBITutorial #Analytics
1
4
124
16 Jul 2024
#PowerBI: What is Power BI Visual Calculation?
youtube.com/watch?v=bKD9T0EW…
#PowerBI #VisualCalculations
🔗 Power BI Full Course - Early Access (Pre-Recorded) 🔗 biworld.graphy.com/courses/P…
📢 Spread the word and share with friends who are eager to learn Power BI!
14
596
23 May 2024
Power BI Visual Calculations with Rankx, What is Difference between measure and Visual Calculations: youtube.com/watch?v=PGtBsuNW…
#PowerBI #DAX #VisualCalculations #DataAnalysis #VisualCalculations #BusinessIntelligence #PowerBITutorial #Analytics
4
8
257
21 May 2024
Power BI Update - May 2024- powerbi.microsoft.com/en-us/…
#PowerBI #DAX #May2024 #DataAnalysis #VisualCalculations #BusinessIntelligence #PowerBITutorial #Analytics

1
12
350
21 May 2024
Power BI Update - May 2024- youtube.com/watch?v=k5EEdq6y…
#PowerBI #DAX #May2024 #DataAnalysis #VisualCalculations #BusinessIntelligence #PowerBITutorial #Analytics

8
176
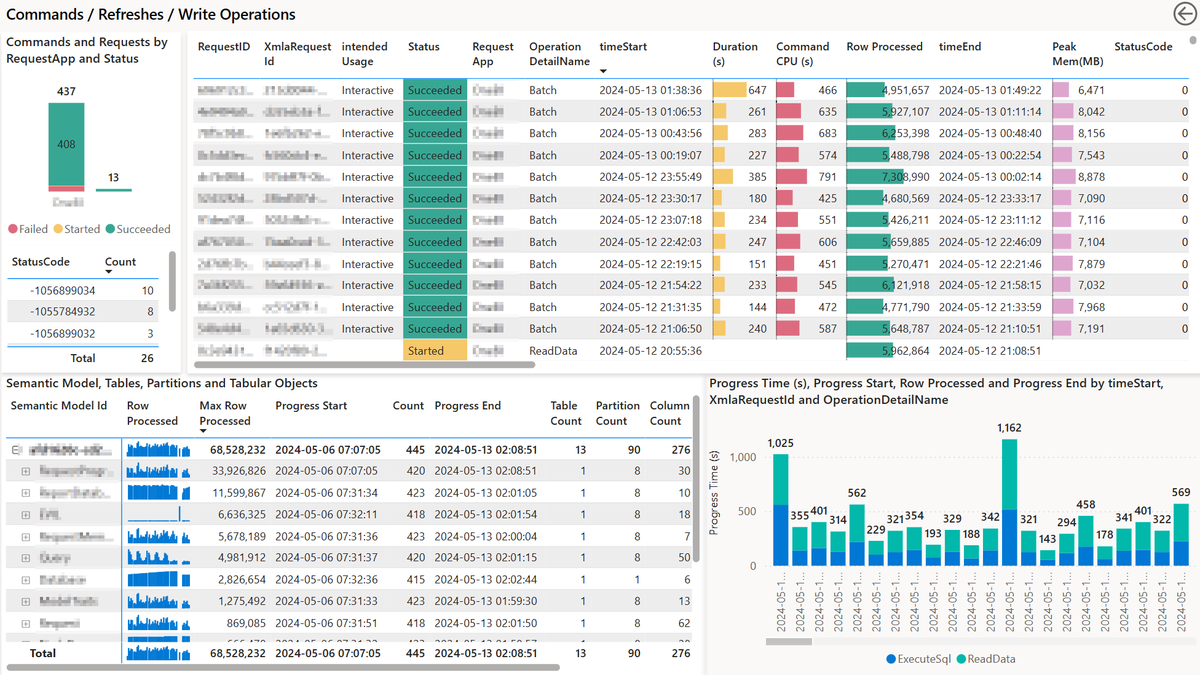
14 May 2024
Power BI Update: New ExecutionMetrics event in Azure Log Analytics for Power BI Semantic Models: powerbi.microsoft.com/en-us/…
#PowerBI #DAX #AzureLogAnalytics #DataAnalysis #VisualCalculations #BusinessIntelligence #PowerBITutorial #Analytics
2
16
573
8 May 2024
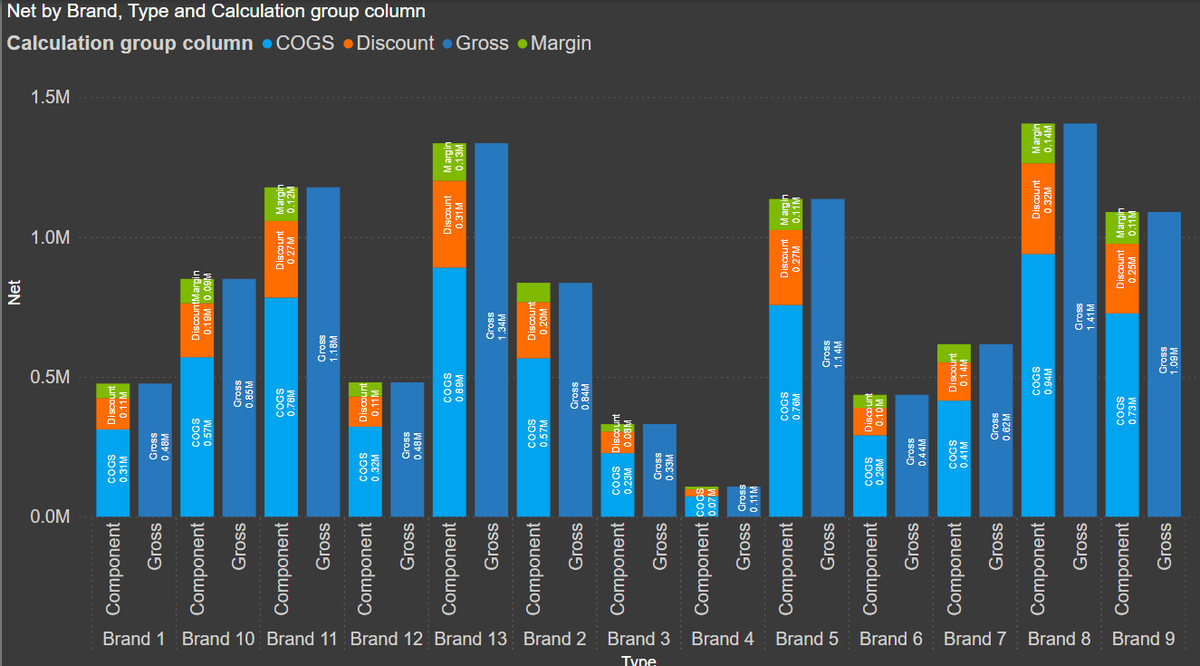
Power BI Tutorial: Creating Clustered Stacked Bar Visuals with Calculation Groups and Measures: youtube.com/watch?v=Z1Jx1hPt…
#PowerBI #DAX #ClusteredStackedBar #DataAnalysis #VisualCalculations #BusinessIntelligence #PowerBITutorial #Analytics

1
6
285

1 May 2024
Just finished watching @JayPowerBI present on Visual Calculations 😀 What a wonderful session and I'm excited on the future with #VisualCalculations, a step towards a more intuitive DAX experience in #PowerBI.

1
9
591

1 May 2024
#Mindblown after watching another presentation by @JayPowerBI on #VisualCalculations. This is my most favorite feature in #PowerBI.
Not that I don't love #DAX, but #VisualCalculations are way much easier. 😀 learn.microsoft.com/en-us/po…
2
10
816
22 Apr 2024
🌟 Throwback- Next-Level Power BI Visual Calculations with Offset, Index, Rank, RowNumber:
youtube.com/watch?v=JwMF0end…
#PowerBI #DAX #PowerQuery #DataAnalysis #VisualCalculations #BusinessIntelligence #PowerBITutorial #Analytics
2
8
311
27 Mar 2024
🚀 Power BI Update: Power BI March 2024 Feature Summary: powerbi.microsoft.com/en-us/…
#PowerBI #dax #powerquery #VisualCalculations #AmitChandakDA #businessintelligence #PL300 #powerplatform #bi #powerbidesktop #datatodiscovery #powerbitutorial
1
8
258