
[T-01] Need to compare means? The Z-test is your answer! 📊#DataScience #Statistics #MachineLearning #ZTest #HypothesisTesting #DataAnalysis #DataVisualization #Mathematics #Science #Analytics

7


Ztest $ZTE.CN finally getting a share price bump after a decent quarter 👍 Changes are making a positive impact?
11
681

May 25
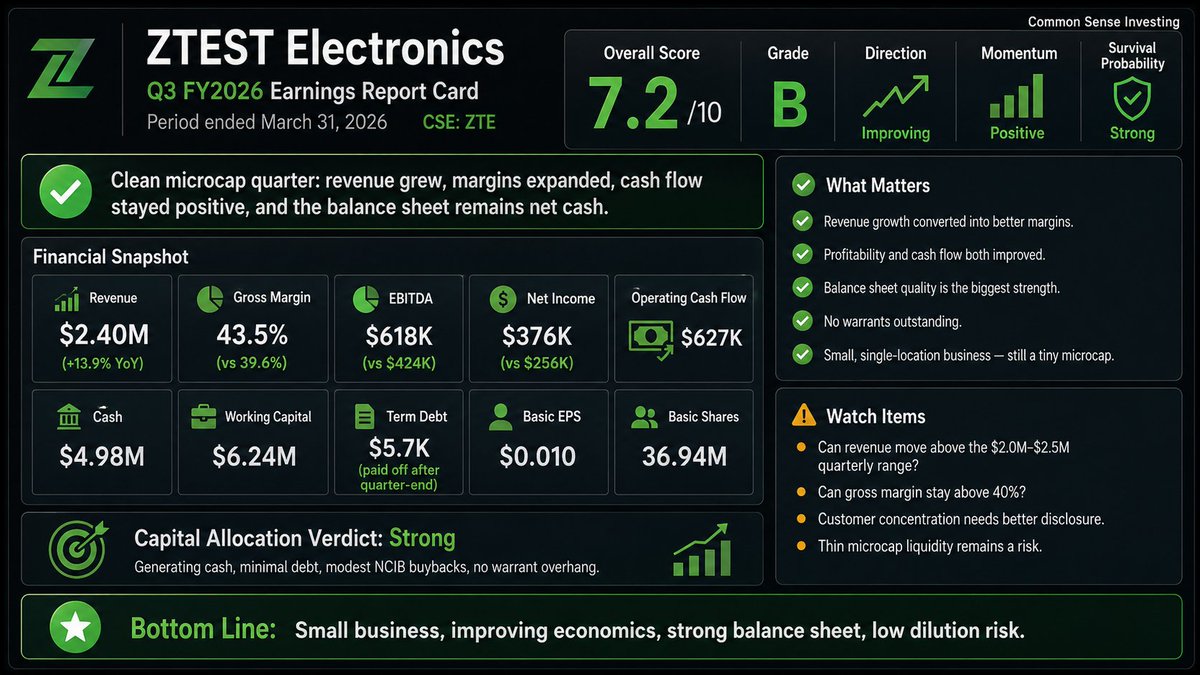
$ZTE.CN — ZTEST Electronics | Fiscal 2026 Q3 Results
contract electronics manufacturer (PCB assembly, testing) out of north york, ontario through its permatech subsidiary
📊 Q3 FY2026 Highlights (3 mo. ended Mar 31):
• Revenue: $2.40M ( 13.9% YoY)
• Gross margin: $1.04M ( 25% YoY)
• EBITDA: $618K ( 46% YoY)
• Net income: $376K ( 47% YoY)
• EPS: $0.010
💰 Balance Sheet:
• Cash: $4.98M (zero net debt)
• Working capital: $6.24M ( 24.6% YTD)
• Long-term debt: basically nil ($6K)
🔮 What stood out:
operating cash flow hit $627K for the quarter, and 9-month net income is up 32% to $1.04M. management signed a new 5-year lease at favorable rates with room to grow production.
ztest keeps quietly compounding — debt-free, cash-rich, and growing both the top and bottom line. small float and thin liquidity are the trade-off, but the operating model is doing exactly what you'd want.
Full analysis:
investorlens.io/stocks/ZTE.C…
#CSE #CanadianStocks #Manufacturing #Electronics #MicroCap
2
2
1,122

$ZTE.CN $ZTSTF
ZTEST Electronics Inc. Announces Fiscal 2026 Q3 Results with 13.9% Year Over Year Revenue Growth
accessnewswire.com/newsroom/…
1
2
357

May 19
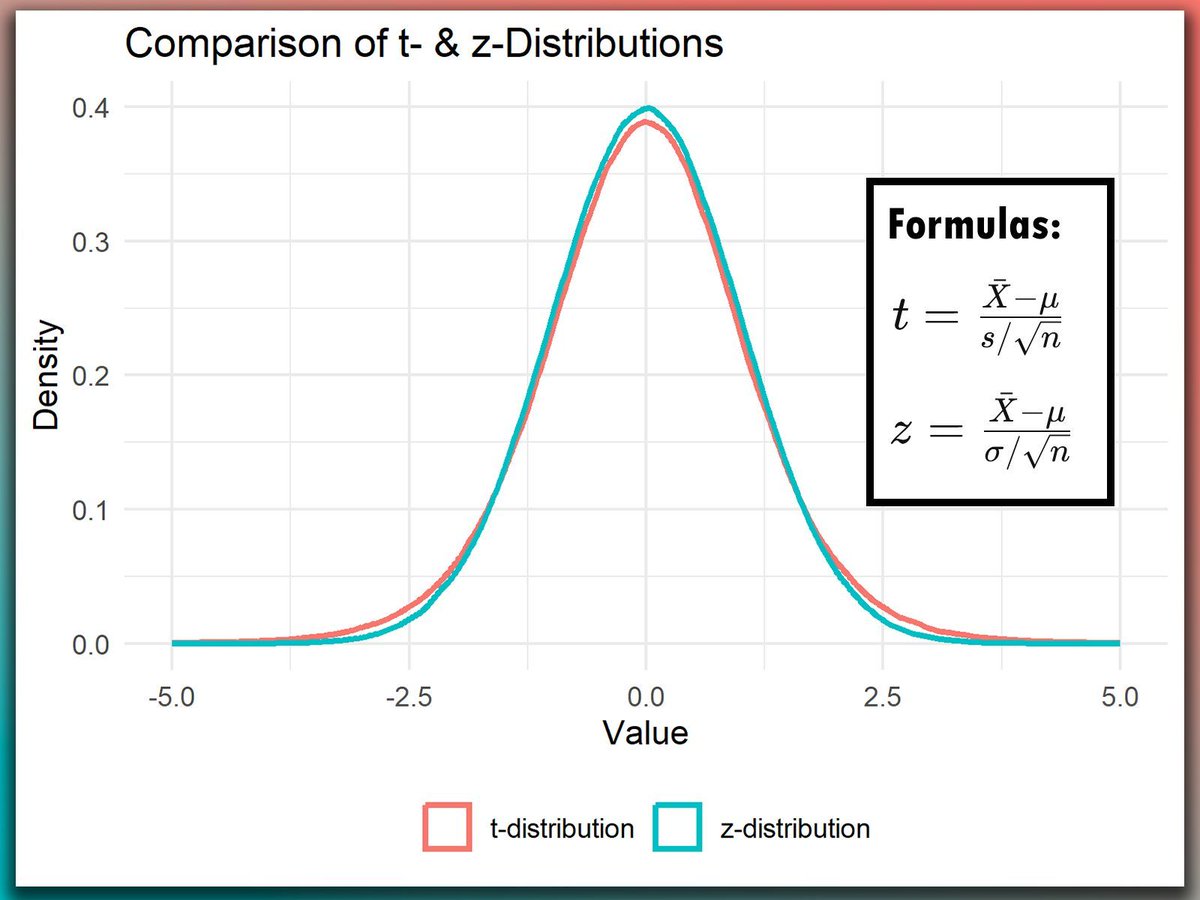
Understanding the difference between t-tests and z-tests is essential for accurate statistical analysis. Both tests help compare means, but they differ in application based on sample size and population variance.
✔️ t-tests are ideal when the sample size is small or the population variance is unknown. They account for increased variability with smaller samples, providing a more accurate analysis.
✔️ z-tests are best suited for large sample sizes where the population variance is known. They are simpler and faster, making them practical when conditions are met.
❌ Incorrect test selection can lead to misleading conclusions, especially if the sample size is small or if assumptions about population variance are incorrect.
❌ Overlooking assumptions can result in inaccurate p-values and confidence intervals, undermining the validity of your results.
🔹 In R: Use the t.test() function for t-tests and z.test() from the BSDA package for z-tests.
🔹 In Python: Utilize scipy.stats.ttest_ind() for t-tests and ztest() from the statsmodels package for z-tests.
The visualization compares t- and z-distributions, showing how the t-distribution with degrees of freedom equal to 10 is broader, reflecting the higher variability typical of smaller sample sizes.
For a deeper dive into this topic and more, check out my online course on Statistical Methods in R. Check out this link for more details: statisticsglobe.com/online-c…
#programmer #datascienceeducation #RStats
13
72
1,904

May 17
Unity 6.3に上げてから Sprite Custom LitのShaderGraphが強制でZTest LessEqual / ZWrite Onになってる気がするけど気のせいだろうか
2
282
May 16
The Z-test is a powerful statistical method used to determine if there is a significant difference between sample and population means, or between the means of two groups. Properly applying the Z-test can lead to more accurate conclusions in research and decision-making, but incorrect application can lead to misleading results.
✔️ The Z-test allows for precise hypothesis testing, enabling you to determine if your observed data aligns with expected outcomes based on a known population mean.
✔️ When used correctly, the Z-test can provide strong, statistically valid evidence to support or reject hypotheses, particularly in studies with large data sets and known variances.
✔️ The Z-test is straightforward and widely understood, making it a reliable tool for hypothesis testing when its assumptions are met, contributing to clearer and more consistent research results.
❌ Using the Z-test with small sample sizes can lead to invalid conclusions, as it assumes large samples for accurate results.
❌ Applying the Z-test to data that is not normally distributed violates its assumption of normality, risking inaccurate findings.
❌ Using the Z-test when population variances are unknown can lead to incorrect results, as it requires known variances for proper application.
❌ Over-reliance on the Z-test without understanding these key assumptions can result in flawed research outcomes and misleading interpretations.
While the Z-test remains a reliable method for large samples with known variances, more modern alternatives like Bayesian methods and bootstrapping offer greater flexibility and robustness in situations where traditional assumptions may not hold.
To apply the Z-test effectively in practice:
🔹 R: Use the z.test() function from the BSDA package to perform a Z-test on your data.
🔹 Python: Leverage the statsmodels library with the ztest() function to conduct a Z-test on your data.
When the significance level (alpha) is 0.05, the null hypothesis can be rejected if the Z value falls within the red region on the visualization. This visual is based on a Wikipedia image: en.wikipedia.org/wiki/Z-test…
You might check out my online course on Statistical Methods in R. This course will explain the Z-test and other related topics in further detail.
More info: statisticsglobe.com/online-c…
#StatisticalAnalysis #datastructure #statisticians

14
78
2,702


May 7
エフェクトは顔の中に格納されることが多いですね。切替時の負荷軽減になります。
描画負荷についてもZTestにより
描画されないため、問題ありません。
ただ、没入感を阻害してしまうため、僅かに切替時の負荷が上がりますが、見えない程度に小さくして格納するべきだとは思いますね。
May 7

え、これってメインキャラ一体描くごとに感情系のエフェクト(というかボディパーツ)全てドローキックされてるってことか? 描画プログラマよくオッケー出したな。
3
7
2,739

Zwrite
ztest
RQ(描画優先度)
NPRシェーダの中にしれっと入ってるパラメータ(ztest/zwrite)
note.com/rikurus/n/n4472d049…
1
5
9
536

Apr 14
✨1.4.2 Patch Note✨
- 2D face shadow improvement
- ZTest controls
- Unity 6.4 support
- Bug Fixes
Check out here for more details!
- potatoon.dev/changelog/v1.4.…
#PotaToon #Unity #Shader

19
988

ZTEST Electronics Inc. (CSE: $ZTE) (OTCID: $ZTSTF) is scheduled to present at the Emerging Growth Conference.
The Company is advancing its electronics manufacturing and technology services platform.
This event provides an opportunity to update investors on operational progress and market positioning.
Link: globenewswire.com/news-relea…
#Electronics #Manufacturing #CSE
11
7
15
8,779

Feb 27
$ZTE.CN — ZTEST Electronics Inc. | Q2 FY2026 Results (Oct-Dec 2025)
⚡ Electronic test & measurement company posts a monster quarter
📊 Q2 FY2026 (3 months ended Dec 31, 2025):
• Revenue: $2.48M ( 19% vs Q2 FY2025)
• Gross Profit: $1.08M (43.5% margin)
• Net Income: $425,913 ($0.01/sh)
• IBT: $577,990 — nearly 2x Q2 FY2025
• OCF: $170,577
• FCF: $167,684
📈 H1 FY2026 (6 months ended Dec 31, 2025):
• Revenue: $4.30M ( 5% YoY)
• Net Income: $662,867 ($0.02/sh, 24% YoY)
• H1 EPS doubled vs prior year ($0.02 vs $0.01)
💰 Balance Sheet (Dec 31, 2025):
• Cash: $4.41M — net cash position of $4.35M
• Total Assets: $7.88M
• Debt: Only $69K (lease LT debt current portions)
• Equity: $6.53M ( 12.5% vs Jun 30, 2025)
• Warrants expired — capital structure fully clean
🔑 Key Takeaways:
• Strongest quarterly revenue in company history
• Gross margins expanded to 43.5%
• Zero long-term debt, fortress balance sheet
• $53K in share buybacks during H1, warrants fully expired
• SBC well managed at $27K for H1
Micro-cap electronics company delivering accelerating revenue and expanding profitability with a pristine balance sheet. Cash exceeds total liabilities by 3x.
Full analysis: investorlens.io/stocks/ZTE.C…
#CSE #ZTE #Electronics #TestAndMeasurement #MicroCap #CanadianStocks #InvestorLens
1
2
4
959
Congratulations to ZTest shareholders $ZTE.C looks like they finally got their rebound quarter 👍 If they can repeat this quarter and add some growth then $ZTE.CN looks interesting again. ceo.ca/@accesswire/ztest-ele…
3
14
996


Jan 22
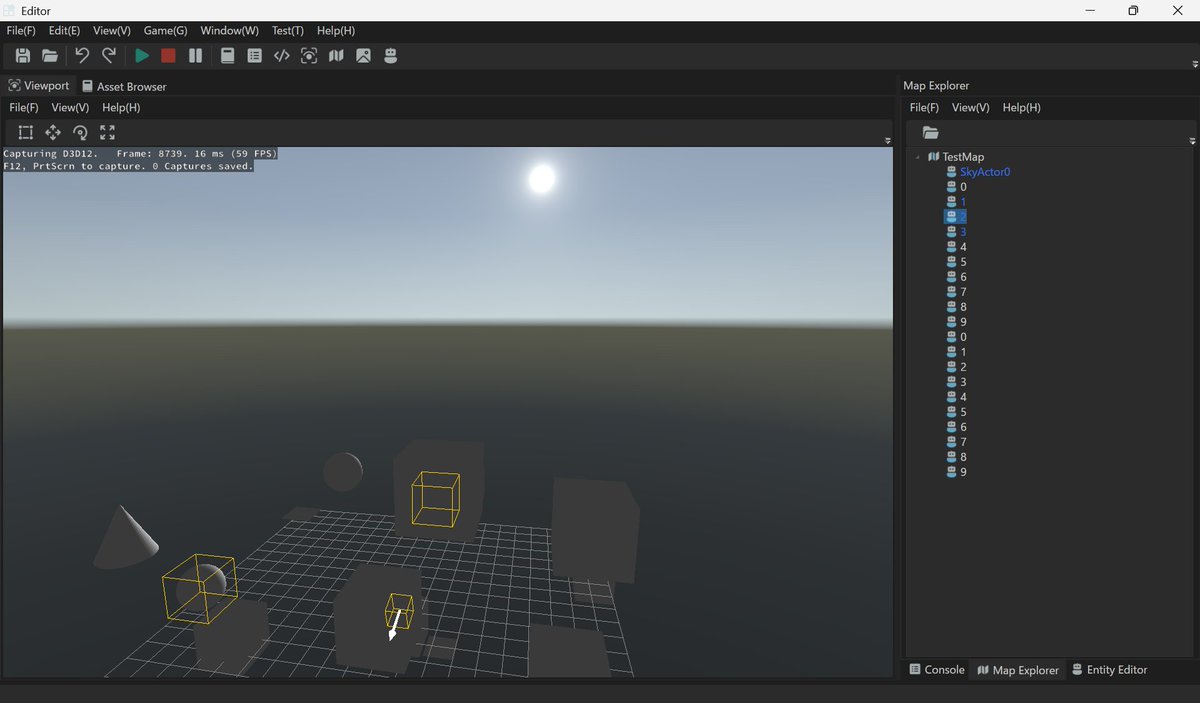
So yes. Then saying "oh I accessed this" is fake. However, you can use a bot to access those map files to make it appear youre in that map, which is probably why they covered the map name because it wouldnt say ztest if you did it that way. If youre leaking, leak it all lmao
4
131