
3h
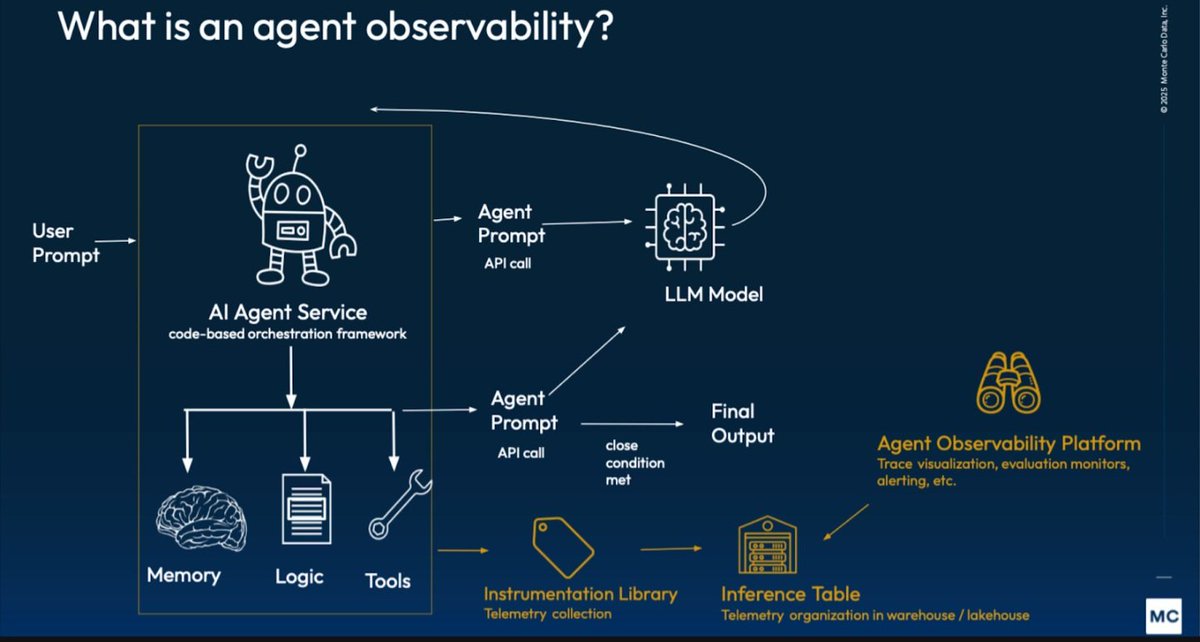
Agent Observability with Distributed Tracing
You can’t improve what you can’t observe. Distributed Tracing for Agents captures the full journey of a request across agent steps, tool calls, LLM invocations, and external services — giving you end-to-end visibility into latency, errors, and behavior.
This is foundational for debugging and optimizing production agents.
As a dev, I instrument every agent with distributed tracing from the start.
Agent Observability Cheatsheet:
• Trace every step: User query → Agent thought → Tool/LLM call → Final output
• Add custom attributes: agent version, model, cost, trace context
• Tools: OpenTelemetry Jaeger/Tempo LangSmith/Phoenix dashboards
• Combine with metrics (latency, tokens, error rate) and structured logs
• Pro tip: Use consistent trace IDs across all services for full request visibility
How are you currently observing and tracing your production agents? Reply below 👇
Follow @AiCamila_ for real-world production AI scaling tips.
#AgentObservability #DistributedTracing #AgenticAI #DevOps
1
15

May 14
Our software engineer @readtheduck explains how #RetroactiveSampling helps reduce #DistributedTracing traffic and ingestion costs, by sending minimal data for sampling decisions and retrieving full spans only when needed.
Curious how this impacts #Observability in real-world environments?
Watch now 👇
youtube.com/shorts/Ki65ZVarD…
#Monitoring #Traces #Logs
1
5
338
May 5
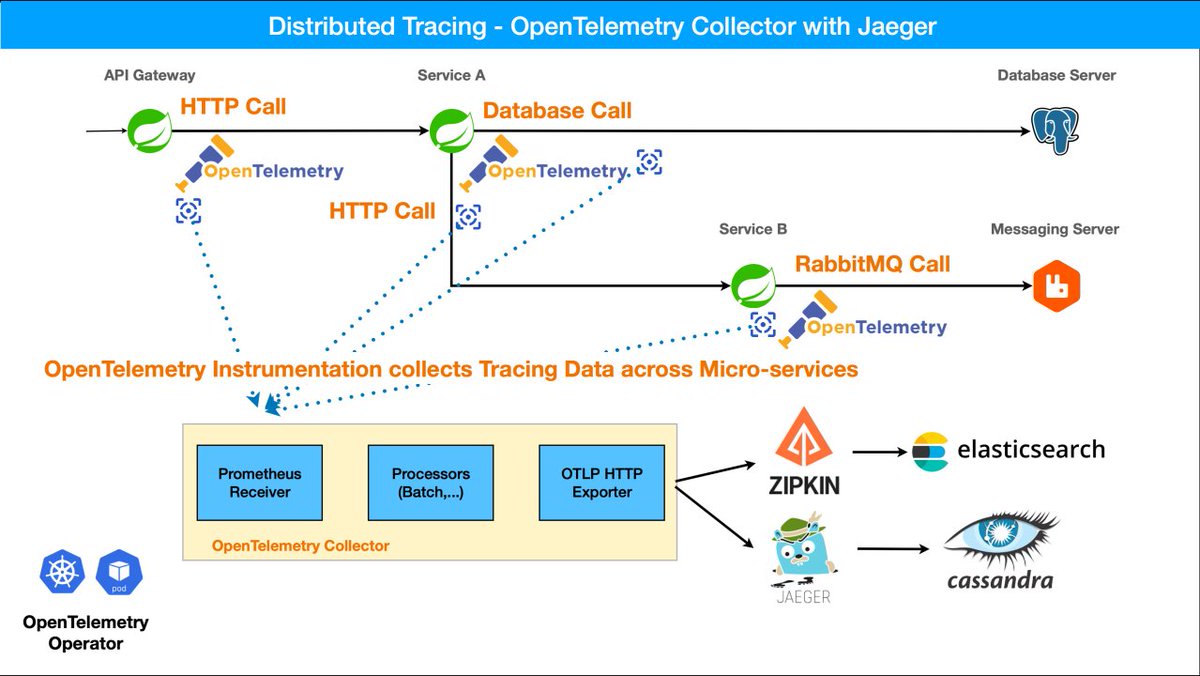
Distributed Tracing for Multi-Agent Systems
Debugging multi-agent systems without distributed tracing = nightmare in production.
Every LLM call, tool invocation, and agent-to-agent handoff leaves a trace. With OpenTelemetry Jaeger you can see the full picture across your entire swarm.
Pro tip: Add tracing early — it saves hours when your agents start failing at scale.
What’s your current observability setup for agents? (Jaeger? Zipkin? Something else?) Drop it in replies 👇
Follow @AiCamila_ for more real-world agent scaling patterns.
#DistributedTracing #AgenticAI #MultiAgent #DevOps
3
10
101
Mar 24
What is Distributed Tracing? 👇
A span represents a procedure within a process.
Multiple spans form a trace through parent-child relationships.
Distributed tracing lets you observe requests as they propagate across services.
From Service A → B → C → D, every step matters ⚡
#Observability #DistributedTracing #OpenTelemetry #KubeConEurope

1
11
289

📊 Hoja de ruta de OpenTelemetry: Mejoras en tasas de muestreo y el Collector
El estándar de observabilidad evoluciona con mejoras clave en el muestreo y el colector.
thenewstack.io/opentelemetry…
#OpenTelemetry #Observability #DistributedTracing #RoxsRoss
2
5
131

Feb 16
⚡️OpenAI Agents SDK → OpenTelemetry → Grafana Cloud Tracesで、エージェントAIのトレーシングパイプラインを構築する。
OpenAI Agents SDKにはトレーシング機能が組み込まれていますが、デフォルトではOpenAIバックエンドに送信されます。これをOpenTelemetry経由でGrafana Cloudへ送ることで:
✅エージェントのトレースをインフラのメトリクス・ログと一元管理
✅Traces Drilldownでエージェントの判断フローをスパン単位で深掘り
✅カスタムバックエンドへの切り替えも、追加プロセッサの併用もOK
構成例(pipでインストール):
opentelemetry-exporter-otlp
openinference-instrumentation-openai-agents
ブログでは「ガードレールに引っかかった質問」と
「正常回答された質問」の両方をトレースで比較する実例も紹介。
AIエージェントにも分散トレーシングの時代です。
👇 セットアップ手順と実行例
grafana.com/blog/observing-a…
#GrafanaJP #Grafana #OpenTelemetry #OpenAI #DistributedTracing
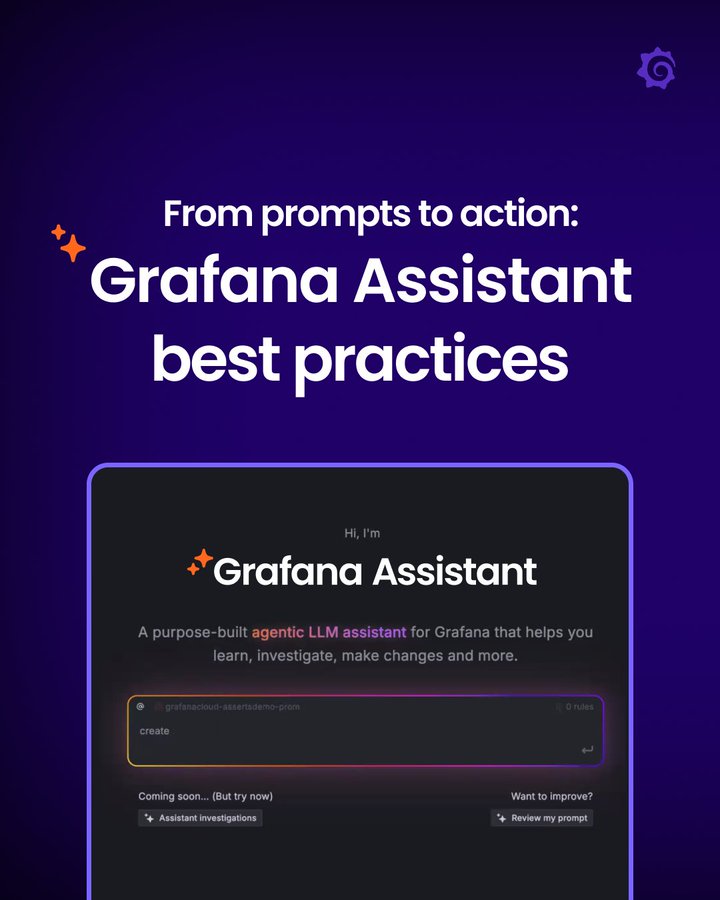

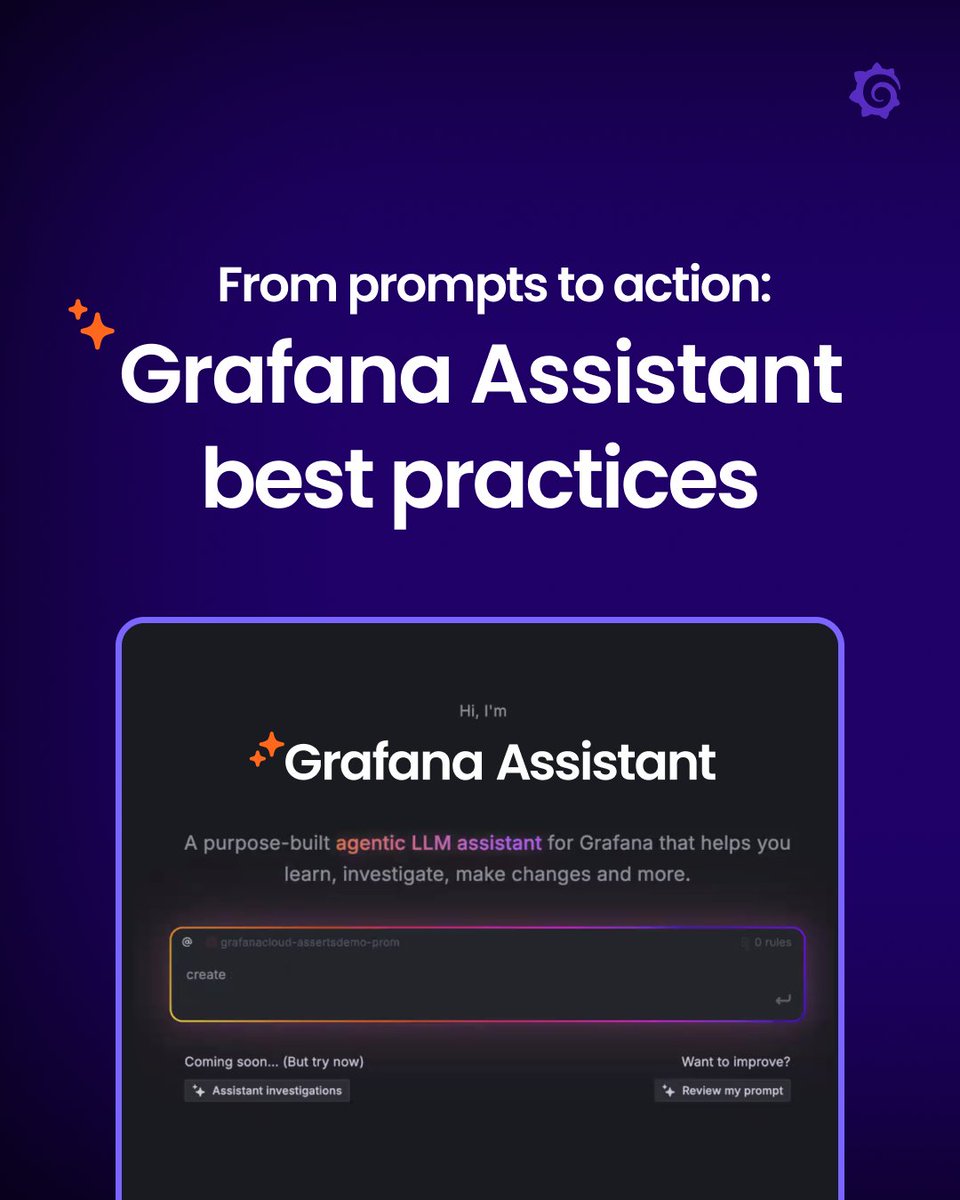
✨ Grafana Assistant gives your team an on-demand expert that they can trace, verify, and rely on to keep production stable.
Check out some of our pro-tips: grafana.com/blog/grafana-ass…
2
267

27 Oct 2025
Design secure and scalable networking for microservices using VPC and ELB.
#AWSCloud #AWSXRay #AmazonCloudWatch #AWSELB
#MicroservicesArchitecture #CloudObservability #DistributedTracing #AWSVPC
#CloudMonitoring #DevOpsTools #CloudNative
#IndovisionCloud
5
5
677
23 Oct 2025
Create serverless microservices with AWS Lambda and DynamoDB for scalability.
#AWSCloud #AWSXRay #AmazonCloudWatch #OpenTelemetry
#MicroservicesArchitecture #CloudObservability #DistributedTracing
#CloudMonitoring #DevOpsTools #CloudNative
#IndovisionAWS
5
5
321

21 Oct 2025
Novo vídeo no Canal .NET -> Monitoramento e Tracing Distribuído com Jaeger e OpenTelemetry: um exemplo com .NET, Java e Node -- Link: youtube.com/watch?v=ow0GZiAd…
C/ @tbertuzzi @ionixjunior @alemalavasi
#jaeger #opentelemetry #microservices #tracing #distributedtracing #monitoring
4
7
175

21 Oct 2025
cncf.io/blog/2025/10/20/addi…
- 作者分享了在 LFX Mentorship 專案中,為 AI Gateway 加上分散式追蹤功能的經驗。
- 專案目標是讓使用者能配置 OpenTelemetry 追蹤器,並支援多個 LLM 供應商。
- 專案分為控制平面和資料平面,控制平面提供配置介面,資料平面實作追蹤邏輯。
- 作者強調先寫單元測試的重要性,並從錯誤中學習。
- 透過此專案,作者深入參與開源社群,提升技術和協作能力。
#OpenTelemetry #AIGateway #DistributedTracing
1
4
267

12 Aug 2025
Just arrived in the US for @kc_dc. Don't miss my talk on #DistributedTracing with #OpenTelemetry on Wednesday morning in the #DevOps Day room!
We will see how a simple Hello World demo works 😆
5
448

19 Jul 2025
Install trace aggregator (e.g. Zipkin) for microservices you depend on. #DistributedTracing @IIBA @IIBAToronto @credly #MDMarketInsights #BusinessAnalysis #CapitalMarkets #FinancialServices #TradeFloor #FinanceIndustry #InvestmentAnalysis #DataAnalytics #RiskManagement #TradingStrategies #MarketResearch #FinancialData #InvestmentManagement #AssetManagement #Fintech #RegulatoryCompliance #PortfolioManagement #Derivatives #MarketAnalysis #FinancialTechnology #TradingTools #QuantitativeAnalysis #InvestmentStrategy #BusinessIntelligence #FinancialInnovation #EconomicAnalysis #TradingSystems #DataScience #HedgeFunds #PrivateEquity #RiskAnalysis

1
2
11

11 Jul 2025
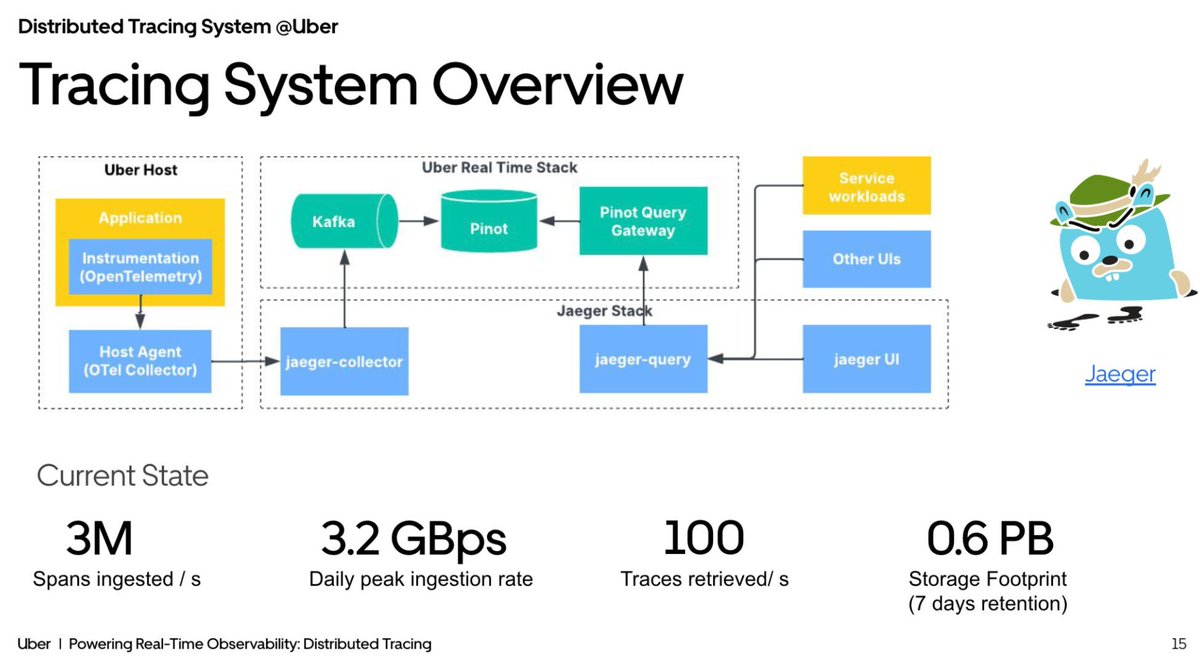
OpenTelemetry → Jaeger → Kafka → Pinot → Query Gateway. Uber pulls 100 traces/sec with P99 < 1 s via Scatter-Gather V1. Real-time all the way through.
#ApachePinot #RealTimeAnalytics #StreamingData #Observability #DistributedTracing #DataInfrastructure #ApacheKafka @uber
1
3
351
11 Jul 2025
With Pauseless Ingestion enabled for a customer, Pinot is handling 40 million events/sec That’s Kafka-to-query freshness without stop-the-world commits.
#ApachePinot #RealTimeAnalytics #StreamingData #Observability #DistributedTracing #DataInfrastructure #ApacheKafka
2
266

8 Jul 2025
🧑💻🔥 Root cause analysis used to take hours of frustration, sifting through telemetry data, or incredibly expensive vendor lock-in. Now #Coroot’s #AI-powered RCA can handle it for you in seconds.
Try the live demo: t.ly/vTJAC
Start your first 14 days free: t.ly/_Mfmr
Less headaches, better system health, more time for deployment.
#DevOps #SRE #postgresql #observability #tech #IT #eBPF #Linux #kubernetes #docker #distributedtracing
1
3
164

Tracing is evolving. But adoption? Still lagging.
Juraci Paixão Kröhling has seen it all — from JBoss and Jaeger to OpenTelemetry and now his own startup, OllyGarden.
In this episode of Code Red, he joins Mirko Novakovic to talk about why distributed tracing hasn’t broken through (yet), what spans and transactions really mean, and why logs still dominate (but maybe not for long).
They also get into his journey from engineer to entrepreneur — and what observability might look like in an AI-first world.
🎧 Full episode in the comments.
What’s really holding teams back from adopting tracing?
#OpenTelemetry #Observability #DistributedTracing
1
2
264

18 Mar 2025
🚀 Join us at Java Day Istanbul 2025 for an exciting session by @nicolas_frankel ! 🚀
🎤 Session: Practical Introduction to OpenTelemetry Tracing
📅 Date: 10 May 2025
📍 Venue: Elite World Asia Hotel
Tracking a request's flow across different components in distributed systems is essential—especially with the rise of microservices. In this session, Nicolas Frankel will dive into observability’s three pillars: logging, metrics, and tracing, and explain how OpenTelemetry brings an open standard to them.
He will also showcase a simple use case to demonstrate how OpenTelemetry can enhance visibility in distributed architectures.
🔹 The role of logging, metrics, and tracing in observability
🔹 How OpenTelemetry unifies distributed tracing across systems
🔹 Live demo: Implementing OpenTelemetry in your architecture
Don’t miss this opportunity to gain valuable insights into modern observability and improve your system’s traceability! 💡🔥
#JavaDayIstanbul #OpenTelemetry #Observability #DistributedTracing #Microservices #SoftwareEngineering #JavaDeveloper
4
7
831
24 Jan 2025
💡 Coroot v1.7: Deep Visibility into ClickHouse & Zookeeper with eBPF
🔗 coroot.com/blog/engineering/…
This release unlocks deep monitoring of @ClickHouseDB & Zookeeper using eBPF, providing:
🔧 Full visibility into ClickHouse deployments (incl. ClickHouse Keeper)
🔧 Insights into Kafka clusters relying on Zookeeper
🔧 Effortless setup & zero code changes required
Monitor your entire system with ease 💚
#observability #distributedtracing #coroot
13
12
835

24 Jan 2025
🚀 Discover Distributed Tracing with Helidon, Coherence, & Oracle Autonomous DB using OpenTelemetry in this article by Ali Mukadam!
📖 Read more: link.medium.com/kULtuvk4pQb
#DistributedTracing #OpenTelemetry #DevOps #Observability
2
6
404

29 Dec 2024
Getting Started with OpenTelemetry in ASP .NET Core
ezzylearning.net/tutorial/ge…
#ezzylearning #opentelemetry
#tracing #distributedtracing
#webapis #traces #metrics #logs
#aspnetcore #aspnet #jaeger
#aspdotnet #dotnetcore
1
2
120