
18 Oct 2025
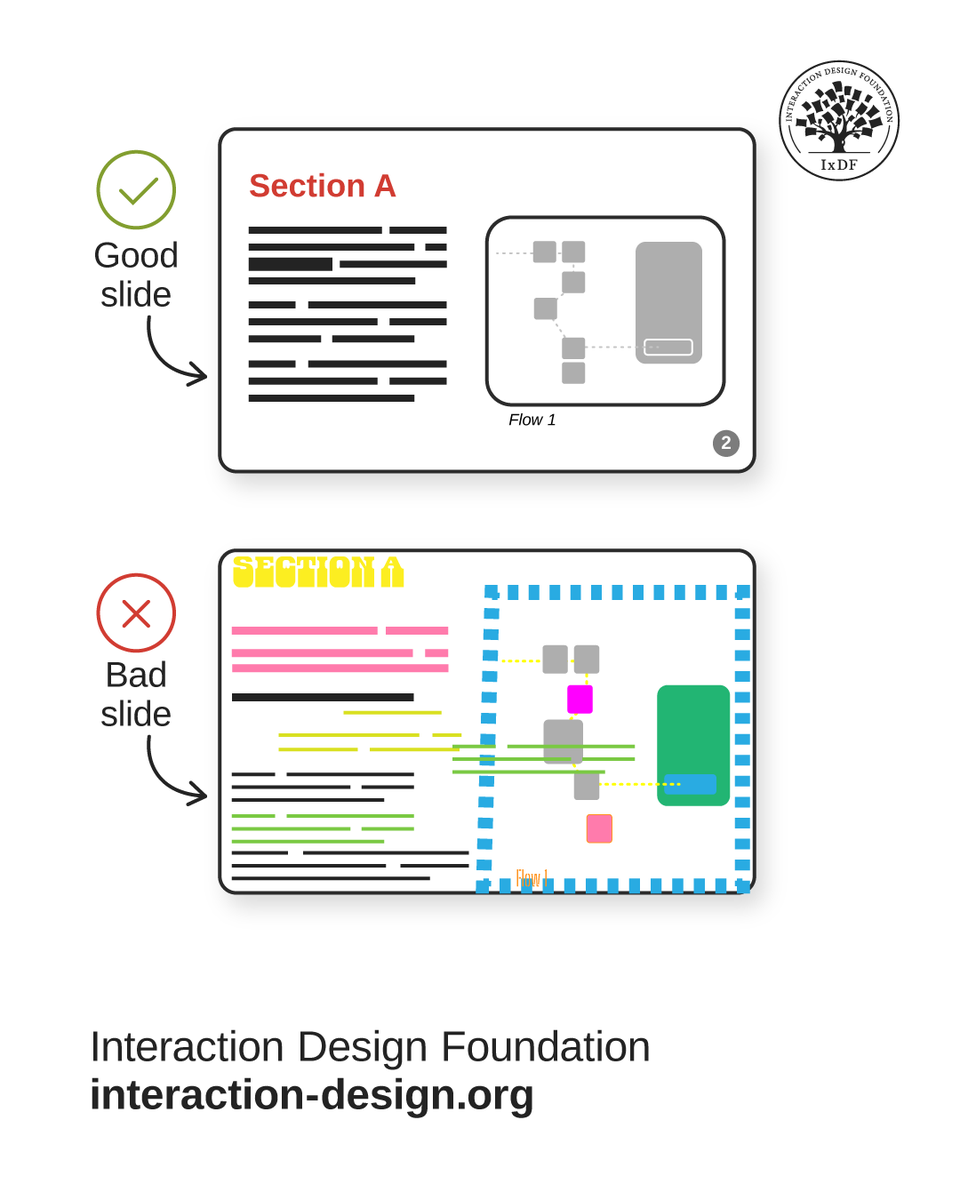
Your slides are sending a message.
The question is: Can anyone read it?
Information visualization helps you turn “What am I looking at?” into “Oh, I get it!” 📊
Whether you’re designing dashboards, giving a pitch, or just tired of cramming numbers on slides, this skill is a game-changer.
Read more about Information Visualization, and explore hundreds of free articles in our open-source library. 👉 bit.ly/42JiZFg
#UXDesign #InformationVisualization #OnlineLearning
1
6
604

At #IV2025, the keynote, Prof. Dr. Jörn Kohlhammer shares how user-centred visual analytics integrates AI for impactful decision support
📍 Don’t miss this keynote at #IV2025
#InformationVisualization #VisualAnalytics #HumanCenteredAI

2
32
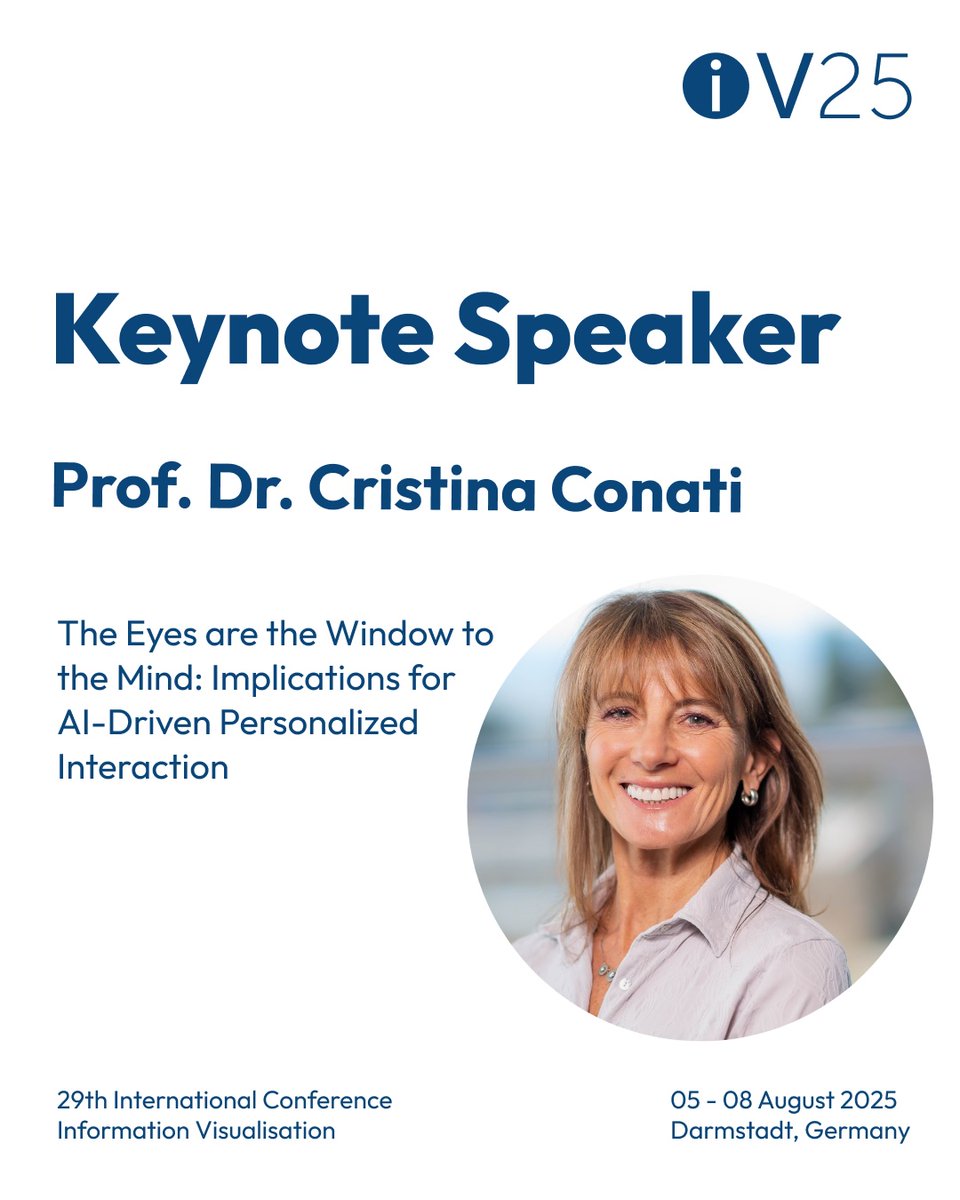
At IV2025, keynote speaker Dr. Cristina Conati (UBC) explores how eye-tracking can support human-centered AI.
Interested in attending? You can register on the conference website: iv.csites.fct.unl.pt/de/
#IV2025 #InformationVisualization #HumanCenteredAI #AI
2
31

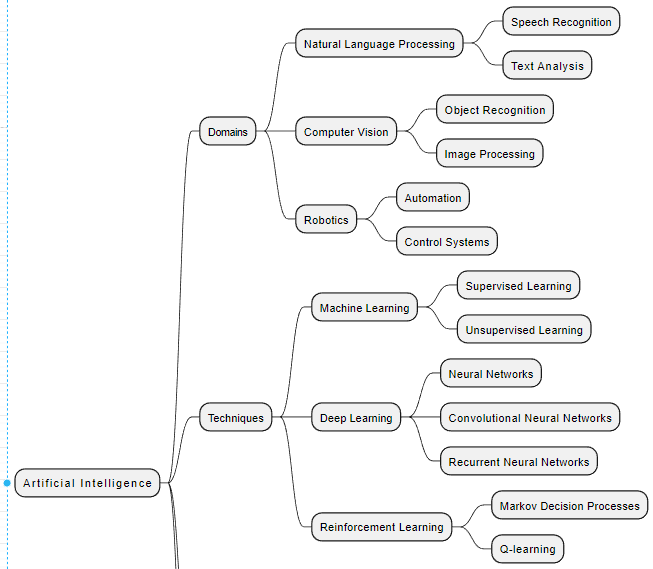
Google's NotebookLM Introduces Interactive Mind Map Generation
Google has recently enhanced its NotebookLM platform with a significant new feature: the ability to generate interactive mind maps. This advancement marks a notable step in the evolution of AI-driven tools for information synthesis and visualization.
NotebookLM, designed to assist users in understanding and working with complex documents, now incorporates a functionality that automatically creates mind maps based on the content of uploaded sources. These mind maps are not static; they are interactive, allowing users to explore relationships between concepts, expand or collapse branches, and gain a holistic overview of the information.
This new capability addresses a crucial aspect of knowledge management: the ability to visually represent and navigate interconnected ideas. By automatically generating mind maps, NotebookLM facilitates:
- Enhanced Comprehension: Users can quickly grasp the structure and key themes of extensive documents.
- Improved Information Recall: Visual representations aid in the retention and retrieval of information.
- Facilitated Knowledge Discovery: The interactive nature of the mind maps encourages exploration and the identification of new connections.
- Streamlined Analysis: Complex data sets can be more easily analyzed and understood through visual mapping.
The integration of interactive mind map generation into NotebookLM demonstrates Google's ongoing commitment to developing AI tools that enhance cognitive processes and support effective information management. This feature is expected to be particularly valuable for researchers, students, and professionals who frequently work with large volumes of data.
#GoogleAI #NotebookLM #MindMaps #ArtificialIntelligence #KnowledgeManagement #InformationVisualization
2
4
3,038

8 Jan 2025
📢Meet the Teaching Assistants for E483/583: Supriya Bidanta, Sanskruti Prashant Rajankar, Venkata Naga Sreya Kolachalama, Divya Prasanth Paraman.Please join us in giving them a warm welcome! #Team #InformationVisualization #DataScience #TeachingExcellence @IULuddy @katycns

3
62

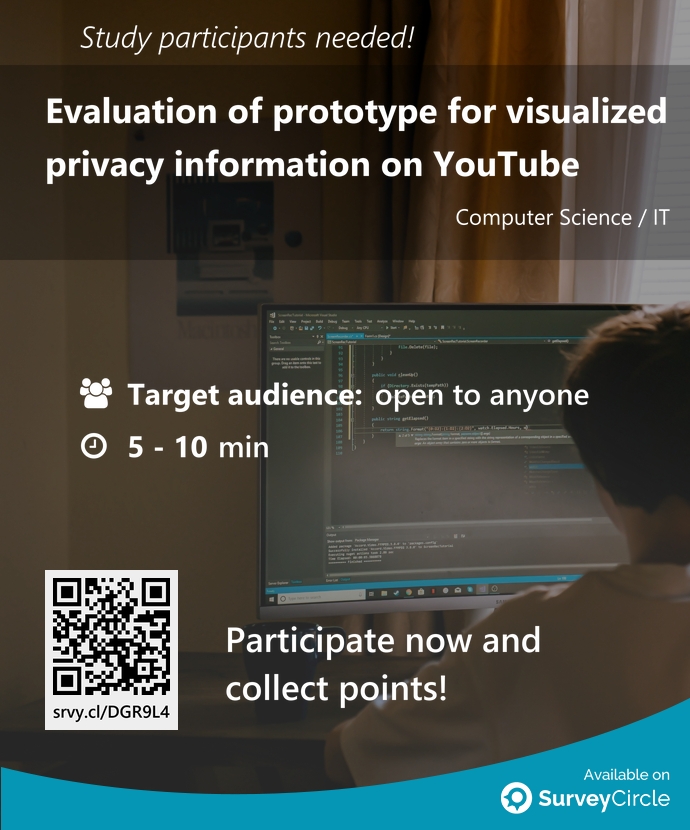
Participants needed for top-ranked study on SurveyCircle:
"Evaluation of prototype for visualized privacy information on YouTube" surveycircle.com/DGR9L4/ via @SurveyCircle #georgiatech
#ProductEvaluation #OnlinePrivacy #youtube #InformationVisualization #hci
1
75

27 Mar 2023
I wrote a quick article over the weekend on @Medium about how to easily create mindmaps with @OpenAI ChatGPT and diagrams.net, you can find the article here:
medium.com/@annias/create-be…
#mindmapping #creativity #productivity #visualization #ChatGPT #Medium #mindmapcreation #brainstorming #ideas #innovation #visualizationtools #efficiency #informationorganization #knowledge #visualization #mindmappro #digitalmindmap #mindmaptools #mapping #conceptmapping #informationmapping #informationmanagement #informationorganization #informationvisualization #visualthinking
2
2
121

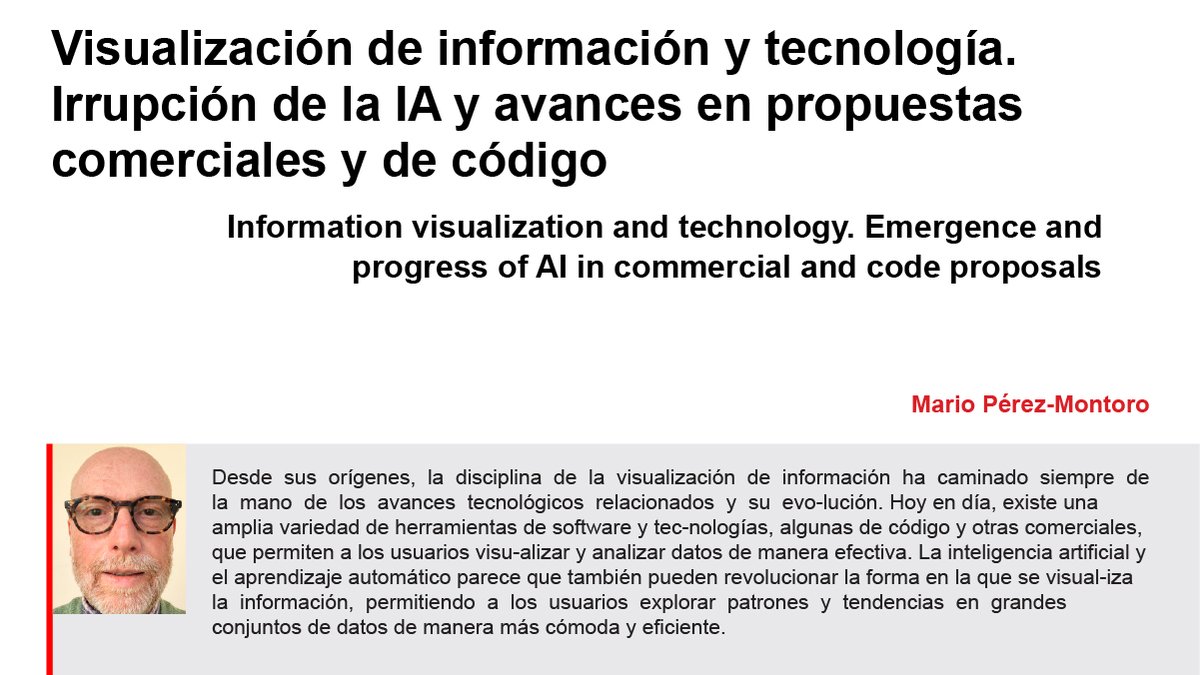
Visualización de información y tecnología. Irrupción de la IA y avances en propuestas comerciales y de código. Un #ThinkEPI de @mperezmontoro
▶️ doi.org/10.3145/thinkepi.202…
#Informationvisualization #Visualcommunication #Datavisualization #Technology #Trends
4
8
351

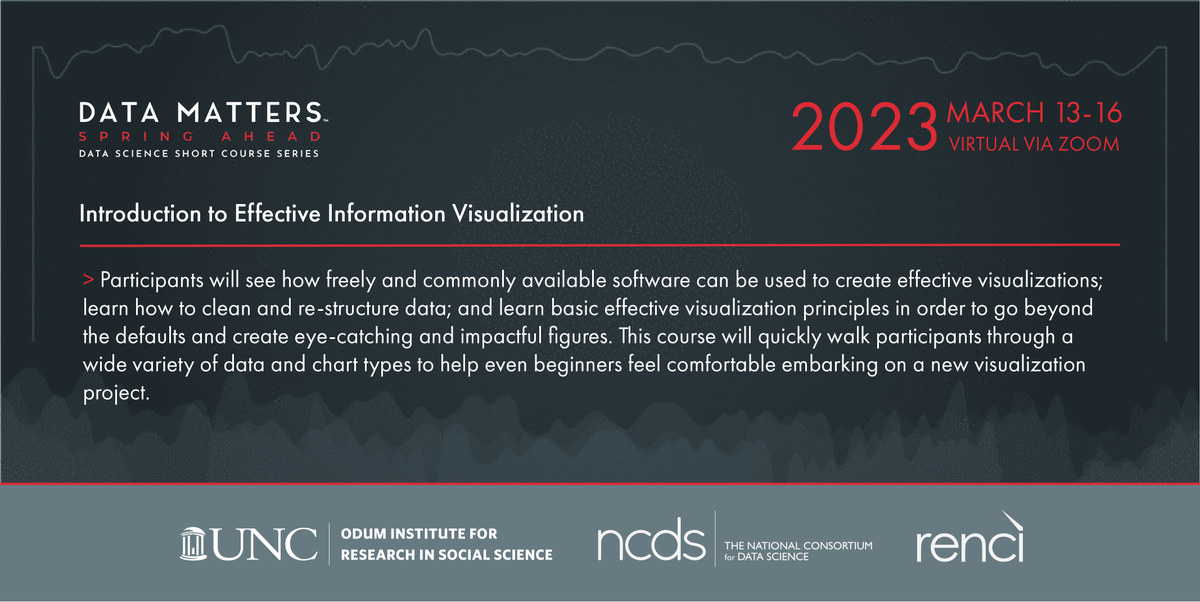
28 Feb 2023
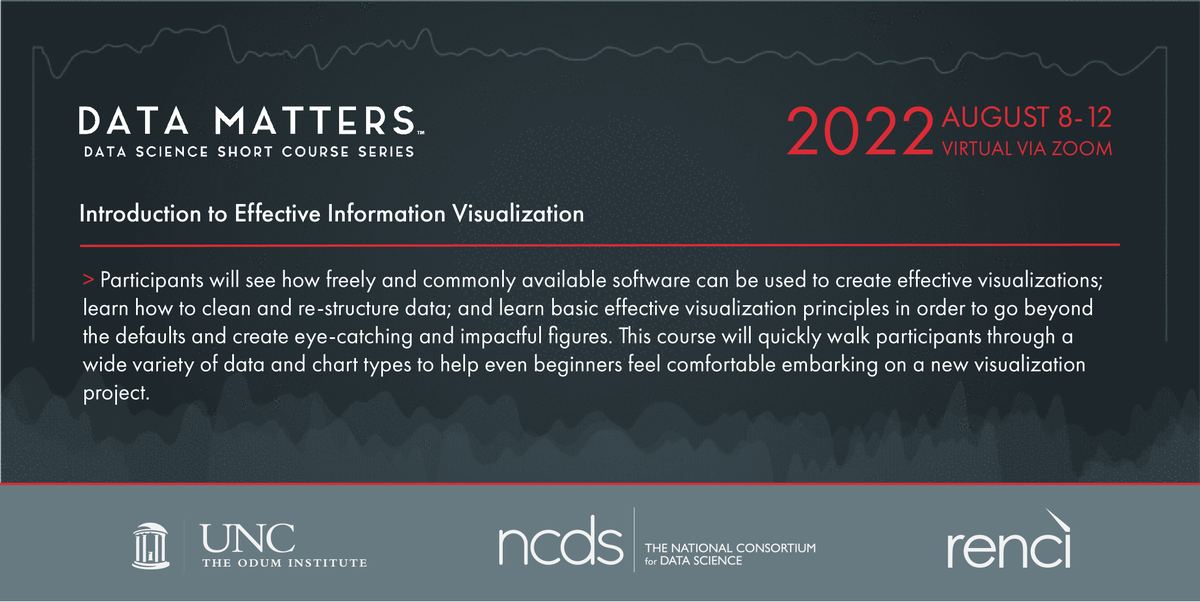
Taught by @ericemonson at @duke_data, #DataMatters course "Intro to Effective #InformationVisualization," will give students the chance to learn basic #visualization principles that allow them to create impactful figures. #infoviz #dataviz #rstats
datamatters.org/

1
2
439
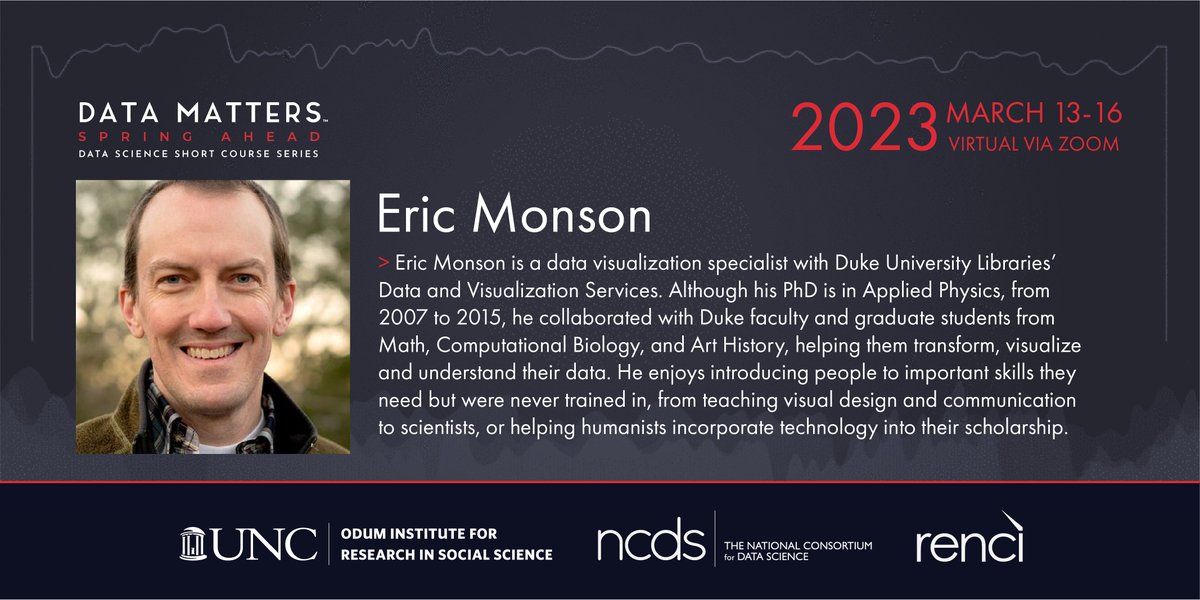
15 Feb 2023
#DataMatters instructor @EricEMonson is a #dataviz specialist with @DukeLibraries' #Data #Visualization Services. During our spring short-course series, he will teach the course “Introduction to Effective #InformationVisualization." @duke_data #infoviz
datamatters.org/
1
5
343

How can I make information visualization accessible? Watch the video to learn from @LinkedScience from @AaltoOLE. #informationvisualization #visualization
1
6
Where can I find reliable data? Watch the video to learn from @LinkedScience from @AaltoOLE. #informationvisualization #visualization
2
5
Why do we need information visualization? Watch the video to learn from @LinkedScience from @AaltoOLE. #informationvisualization #visualization
1
5
What is information visualization? Watch the video to learn from @LinkedScience from @AaltoOLE. #informationvisualization #visualization
1
5
How does #information differ from #data and #knowledge? Watch the video to learn from @LinkedScience from @AaltoOLE. #informationvisualization #visualization
2
7

We're excited to host @LacePadilla of @ucmerced this week for our final #HCIISeminarSeries of the Fall semester. Join us!
🎙️"Making Uncertainty Cognitively Accessible"
📅Fri., Dec. 2
🕜1:30pm EST
📍NSH 1305 & livestream
🔗Details: hcii.cmu.edu/news/on/event/2…
#InformationVisualization

ALT Lace Padilla
1
2

13 Sep 2022
I've been doing some research on the representation of sensor values on a circle, very common in speedometers and other gauges. Here are some of the ones I liked the most from my studies:
#datavisualization #informationvisualization #designer #design
#1 Vespa

1
4
26 Jul 2022
Taught by @ericemonson at @duke_data, #DataMatters course "Intro to Effective #InformationVisualization," will give students the chance to learn effective #infoviz principles that go beyond the defaults allow them to create impactful figures. #dataviz
datamatters.org/


3

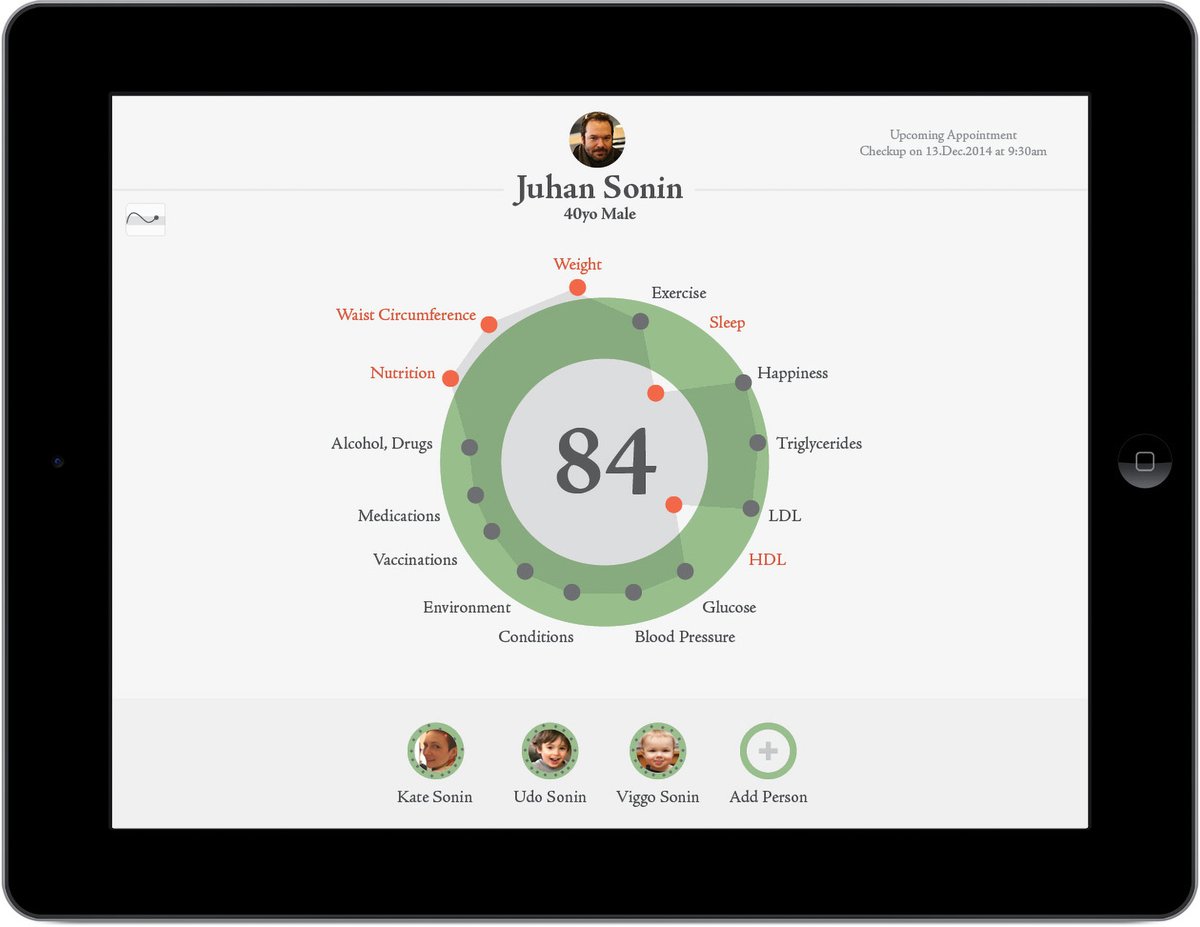
hGraph: your health in one picture
goinvo.com/work/hgraph
#healthanalytics #digitalhealth #informationvisualization #healthcare #ux
3
2

2 Apr 2022
Come & join us on 5 April at the online symposium UNFORESEEN PATHS#1 Transcending boundaries and sharing critical approaches to #ArchitecturalHeritage Info®ister bit.ly/3iTP3z0 #InformationVisualization #MachineLearning #photogrammetry #SentimentAnalysis #SpaceSyntax

2
5