今週は ルートがあるのに ping 飛ばない問題 です。
みなさん、解決出来ましたか?
OSPFネイバーの問題ではなさそうですよね。
RCL の X-Ray で内部状態を透視することで
本当の原因が見えてくるかもしれません。
ぜひお試しください!
routecrushlab.com/lab/tl/q7?…
#可視化 #NetworkVisualization
3
105

May 26
今週の OSPF シリーズ、月曜の問題はこちら↓
x.com/routecrushlab/status/2…
みなさん、解けましたか?
RCL の X-Ray は、内部状態を透視するツールです。
自力で解けた人も、これからの人も
ターミナルの裏で何が起きているのか、X-rayで覗いてみませんか?
#ネットワーク可視化 #NetworkVisualization

1
2
13
2,158

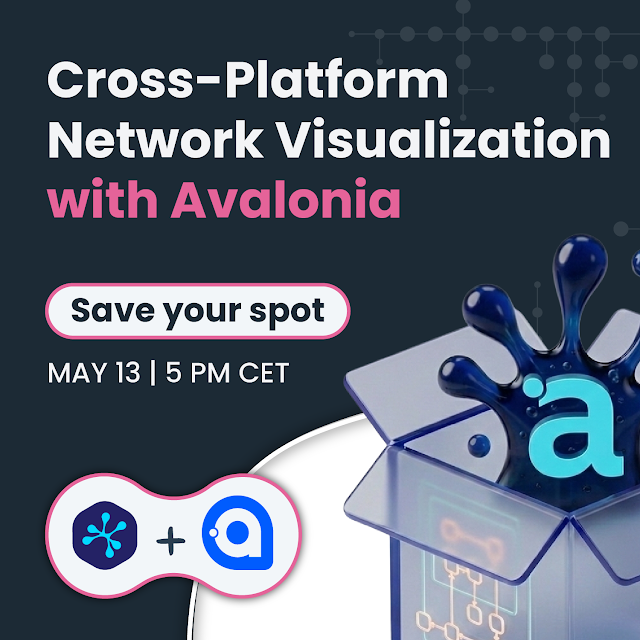
If you're tackling #NetworkVisualization within @AvaloniaUI, you won't want to miss this. We’re exploring how you can handle even the most complex data structures across every platform using yFiles. 🚀
Secure your spot: yworks.zoom.us/webinar/regis…
3
5
692
🥳 Big news: The first EAP of yFiles for @AvaloniaUI is here! 🚀
Bring high-performance network visualization to Windows, Linux, macOS & mobile with the power of yFiles for #dotnet.
Try it now & share your feedback! yfiles.com/avalonia/eap
#Avalonia #NetworkVisualization
1
2
131

6 Sep 2025
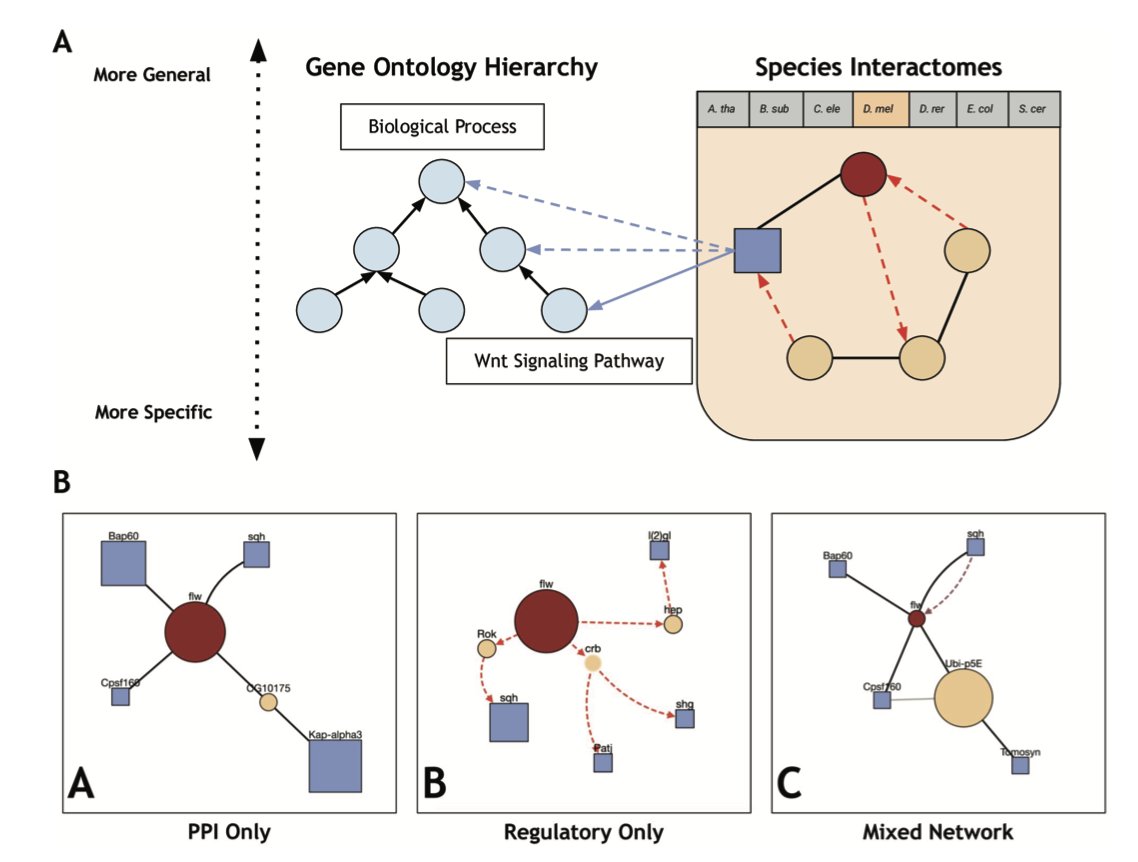
ProteinWeaver: A webtool to visualize ontology-annotated protein networks
1. ProteinWeaver is a groundbreaking web-based tool that integrates protein interaction networks with Gene Ontology (GO) annotations, allowing researchers to visualize and analyze the connections between proteins and specific biological processes or pathways in seven model organisms.
2. A key innovation of ProteinWeaver is its ability to generate subnetworks that link a user-specified protein to proteins annotated with a specific GO term, providing context for the protein's role in a biological process. This feature is particularly useful for generating testable hypotheses.
3. The tool stands out by offering customizable network visualizations and interactive exploration. It supports both physical and regulatory interactions, making it the first interactive webtool to combine these interaction types within a single network.
4. ProteinWeaver also identifies and reports on five different network motifs (including mixed motifs of physical and regulatory interactions) and provides enrichment scores, offering deeper insights into the functional context of the proteins.
5. The random walk approach used by ProteinWeaver to predict missing GO term annotations shows high accuracy across multiple species, providing researchers with a powerful method to infer protein functions.
6. The user-friendly interface of ProteinWeaver allows researchers without computational expertise to easily explore molecular interactions and their roles in biological contexts, fostering hypothesis generation and biological interaction exploration.
📜Paper: journals.plos.org/plosone/ar…
💻Code: github.com/Reed-CompBio/prot…
#ProteinWeaver #Bioinformatics #ProteinNetworks #GeneOntology #NetworkVisualization #ComputationalBiology
1
5
36
2,204

31 Mar 2025
Need to document your clients’ networks?
Read this: graphicalnetworks.com/blog-n…
#MSP #NetworkConsultant #NetworkDiscovery #NetworkMapping #NetworkDiagram #ITTools #SNMP #ITConsulting #DataCenter #DCIM #NetworkVisualization #CyberSecurity #Compliance
3
58

5 Mar 2025
3
3
253

20 Nov 2024
With the advent of #5G open networking, networks have inevitably become much more intricate and complex as they’ve evolved and advanced. Although #NetworkData is a rich source of information and insight, extracting that value manually is impracticable. That’s where #NetworkVisualization comes in.
Read more in Jenny Qin's latest blog: networkblog.global.fujitsu.c…
2
109

18 Sep 2024
Interwoven Data Streams Matte Canvas
any-in-shop.printify.me/prod…
#digitalart #abstractdata #networkvisualization #techart #informationflow #vibrantabstract #connectedsystems #geometricpatterns #moderndigitalart #datanodes

1
1
24

3 Sep 2024
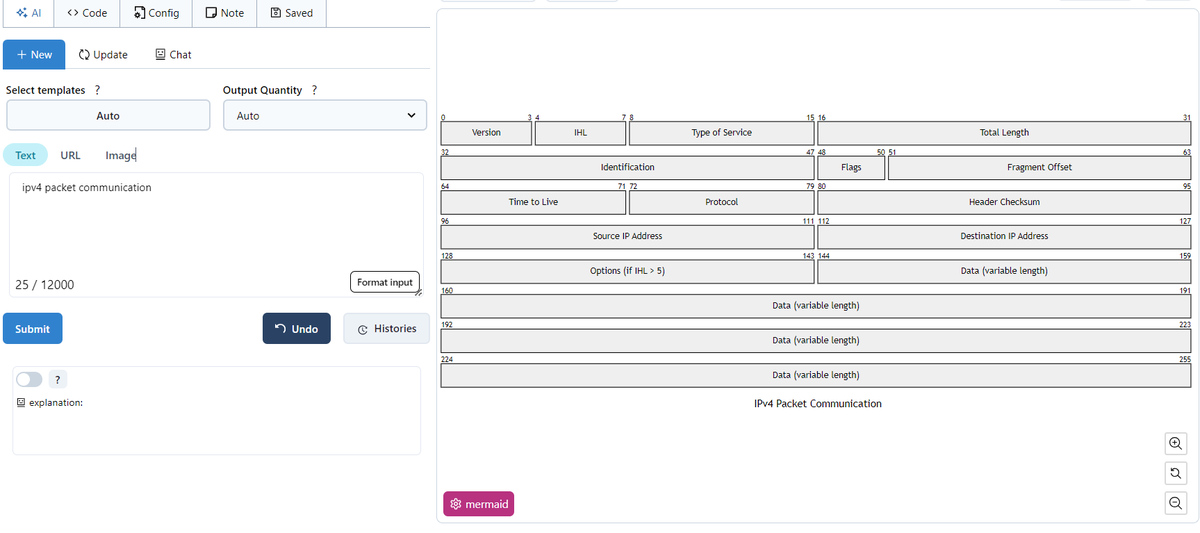
New packet diagram template added! Easily visualize network communication and packet transmission. Perfect for simplifying complex data structures and improving understanding of network flows. #NetworkVisualization #DiagrammingAI
1
3
313

24 Jul 2024
How did #Gephi, the open source software for #networkvisualization and analysis, get its start? And in what ways did it give rise to Linkurious? 🤔
We did a Q&A with our CEO, @mentatseb to get the whole story. Check it out: eu1.hubs.ly/H0bny8l0
#Technology #GraphTechnology
2
3
154
6 Jun 2024
The main reason to visualize @VMware data is to have that (in)famous “single pane of glass” view.
Read it: graphicalnetworks.com/blog-v…
#Virtualization #DataCenterManagement #VMware #ITInfrastructure #NetworkVisualization #TechSolutions
4
55

Redefine your network insight!
Dregn's real-time 3D network visualization offers visual clarity.
What are you waiting for?
Unleash analytical power and take your network management to the next level.
Join the networking revolution today!
Get more info about us at dregn.org
#DREGN #NetworkVisualization #3DVisualization

1
1
133
3 May 2023
New blog post! 📢 Explore resources for choosing the right IT documentation/visualization software, curated by sales expert Adriana Lora. Find videos, webinars, case studies, a 14-day trial & more!
🔗 graphicalnetworks.com/blog-r…
#ITdocumentation #networkvisualization #netTerrain

1
15
Gain a crucial understanding of complex company structures and relationships with yFiles, allowing for insight into various connections such as company ownership and dependencies. yworks.com/solutions/company…
#companystructures #relationshipmapping #networkvisualization #datainsights
3
77

I always wanted to use edge bundling on my #networkVisualization but couldn't find a reusable implementation, so I adapted one yesterday.
Here is how you can use in @observablehq my reusable adaptation of d3.forceBundle #dataviz
observablehq.com/@john-guerr…
2
2
26
2,130

14 Mar 2023
STRING FAQ: Does distance mean anything? Have you ever looked at a STRING network and wonder if it means anything that two proteins are close to each other in the layout? #bioinformatics #networkbiology #networkvisualization youtube.com/shorts/F3Nrqjxlw…

2
8
782

10 Mar 2023
´The beauty of visualisation helps to convey a message in research.´
Using real life examples from his research on international trade #networks, Luca de Benedictis from @UniMC showed us #networkanalysis & #networkvisualization using #RStudio for RECSM´s Winter #Methods School!

1
2
324

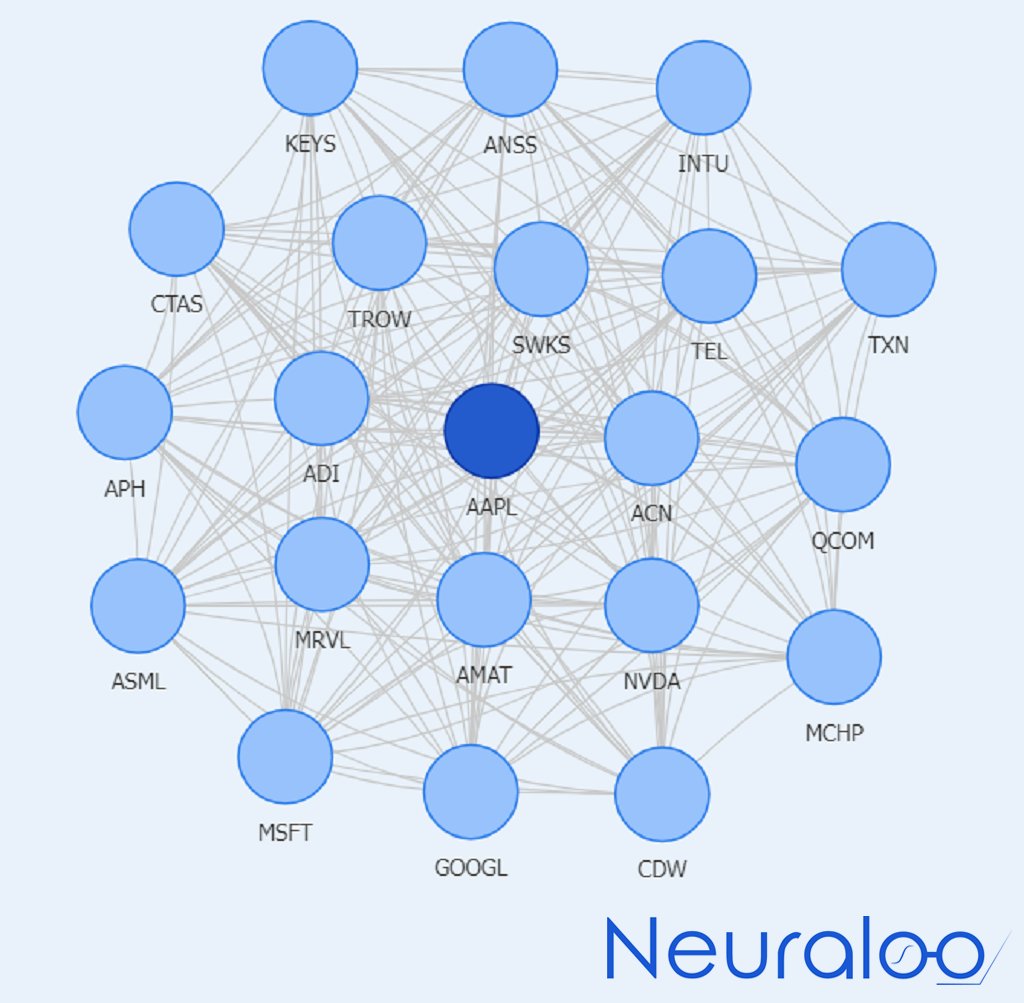
Just relying on traditional portfolio optimization tools can be limiting. With network visualization, investors can get a more transparent view of market trends, risks, and identify direct competitors or outliers. #networkvisualization #diversification #finance #NVDA #AAPL
2
5
60

4 Oct 2022
#筑波大学ポッドキャスト 「研究室サイドストーリー」第19回を配信しました
「動けば見えてくる!複雑な #ネットワーク図 から価値を読み取る新手法」と題しシステム情報系 #三末和男 教授にお話しを伺います
anchor.fm/university-of-tsuk…
#ポッドキャスト #podcast #GraphDrawing #NetworkVisualization
2
12