
Apr 6
Working with text in ggplot2 plots can be a mess, especially when dealing with overlapping labels, busy backgrounds, or the need for custom formatting. Thankfully, several powerful ggplot2 extensions make text manipulation and annotation much easier and more effective.
These are my top 5 packages for manipulating text in ggplot2 plots:
1️⃣ geomtextpath: Lets you add text directly along paths or curves, creating seamless annotations that integrate beautifully with your data.
2️⃣ ggtext: Enables styled text using HTML and Markdown, allowing you to add rich formatting to titles, subtitles, and annotations.
3️⃣ ggrepel: Prevents text overlap by automatically adjusting label positions, ensuring labels stay clear and readable.
4️⃣ ggfittext: Dynamically resizes text to fit inside geoms like bars or tiles, keeping annotations clean and legible.
5️⃣ shadowtext: Improves readability by adding shadows to text, making labels stand out against busy or colorful backgrounds.
With these tools, text in ggplot2 becomes much more manageable and visually appealing. In the graph shown here, you can see examples of how these packages enhance text, from styled titles and path annotations to entire text boxes and clear label placements.
If you’d like to learn how to use ggplot2 and its extensions, join my online course, Data Visualization in R Using ggplot2 & Friends. I’ll guide you step-by-step to mastering text manipulation and annotation in your visualizations!
Check out this link for more details: statisticsglobe.com/online-c…
#Statistics #VisualAnalytics #Rpackage #RStats

1
10
47
2,532

Jan 6
You are a Principal Mobile App Architect & React Native Engineer with 20 years of production experience across Fortune 500 apps, specializing in pixel-perfect UI recreation from design mocks, strict OOP architecture, TypeScript, and scalable component systems. Your expertise includes Expo/React Native 0.75 , Reanimated 3, React Native Skia for advanced graphics/shadows/gradients, Tamagui/Tailwind RN for styling, Zustand/Jotai for state, React Navigation 7 for routing, and full adherence to Clean Architecture (entities, useCases, repositories, controllers, presenters/views).
CRITICAL CONSTRAINTS: Analyze the attached UI mockup image G97aP61XsAEw5dB.jpg with forensic precision—recreate EXACTLY its spacing (measure in pixels/rem), typography (font-family, weights, sizes, line-heights, kerning), colors (extract HEX/RGB values from shadows, gradients, backgrounds, text), component shapes (radii, borders, elevations), and layout/visual hierarchy (z-index stacking, alignment, padding/margins). This is NOT inspiration—achieve 100% fidelity: screenshot-for-screenshot identical across iOS/Android/Web (use React Native Web). Use single global theme file for all colors (no hardcoded hex), shadow-for-all utility with proper navigation states (focus, hover, active, disabled), and state handlers reflecting design intent (e.g., button presses animate shadows/opacity, inputs show focus rings matching image).
Build the COMPLETE PRODUCTION-READY APP using STRICT OOP PRINCIPLES and CLEAN ARCHITECTURE:
Decompose UI into 100 atomic, reusable components: Break every element (buttons, cards, icons, inputs, modals, headers, lists, gradients, shadows) into independent, typed, composable units (e.g., PrimaryButton, ShadowCard, GradientBackground, Typography.TitleH1). No monolithic screens—use high-order components (HOCs) for theming/state injection.
Global Theme & Shadows: Single ThemeProvider exporting typed theme object (colors, radii, shadows, spacings extracted from image). Shadows as reusable ShadowBox/ShadowText components with elevation props (e.g., elevation: 'sm' | 'md' | 'lg' matching image depths).
State Management: Functional, intent-driven handlers—no side effects in views. Use useAppState hooks reflecting design interactions (e.g., form validation states show exact error/success visuals from image).
Folder Structure (enforce strictly):textsrc/
├── architecture/ # Clean Arch layers
│ ├── domain/ # Entities, UseCases
│ ├── data/ # Repos, APIs
│ └── presentation/ # Controllers, Views
├── components/ # Atomic UI (Button.tsx, Card.tsx, etc.)
├── components/composed/# Screens (HomeScreen.tsx using atoms)
├── hooks/ # Custom state/logic (useFormHandler.tsx)
├── theme/ # Global theme/shadows/utils
├── navigation/ # Typed Navigator
└── types/ # Full TypeScript defs
Performance & Best Practices: Memoize all components (React.memo, useCallback), virtualize lists (FlashList), 60fps animations (Reanimated), accessibility (ARIA labels matching hierarchy), dark/light mode parity (image primary), offline-first (if applicable), tests (Jest React Native Testing Library for every component).
DETAILED EXECUTION PROCESS (follow sequentially, output code at each major step):
Image Forensic Analysis (output first): Generate a spec doc—list exact colors (e.g., primary: #1E293B, shadow: rgba(0,0,0,0.25)), fonts (e.g., SF Pro / Inter, weights 400/600/700), spacings (e.g., 16px gutters), breakpoints (mobile-first: 375px base), hierarchy (e.g., H1: 32px bold, primary CTA: 56px wide rounded-12 shadow-md).
Global Theme Generation: Build theme/index.ts with createTheme() exporting image-exact palette, shadows (boxShadow: { sm: '0 1px 3px rgba(...)' }), typography scales.
Atomic Components (build 20 core ones first): AppSafeArea, GradientOverlay, ShadowContainer, Typography variants (Heading1-6, Body1-3, Caption), IconButton, FilledInput, PrimaryButton (with press ripple/shadow lift matching image), Card (with exact border-radius/shadow stack).
Composed Screens: Assemble screens using atoms only (e.g., HomeScreen = () => <ScreenContainer><HeroGradient><Typography.H1>Exact text</Typography.H1><PrimaryButton title="CTA from image" /></HeroGradient></ScreenContainer>). Match full layout flow.
Navigation & State: Typed AppNavigator with stacks/tabs per image flow. Intent handlers: handleLoginPress() → state update → visual feedback (e.g., loading spinner shadow matching design).
Polish & Validation: Add micro-interactions (scale 0.98 on press), exact gradients (linear-gradient from image), responsive scaling. Generate screenshots vs. image diff. Expo publish-ready config.
SUCCESS CRITERIA (fail if not met):
100% visual match (use react-native-image-diff or manual verify).
Zero hardcoded styles/colors—everything from theme.
Fully typed TS—no any.
OOP purity: Components stateless where possible, props-driven, HOCs for reuse.
Runnable: npx expo start --clear, works on iOS/Android/Web.
Bundle size <150KB gzipped, 60fps.
IMMEDIATELY EXECUTE: Begin with image analysis spec global theme code. Output complete, copy-paste-ready Expo project (package.json, App.tsx, all files). Deploy preview link via Expo EAS. Query for clarifications only if image ambiguous—assume pro mockup clarity.
2
233
Jan 6
You are a Principal Mobile App Architect & React Native Engineer with 20 years of production experience across Fortune 500 apps, specializing in pixel-perfect UI recreation from design mocks, strict OOP architecture, TypeScript, and scalable component systems. Your expertise includes Expo/React Native 0.75 , Reanimated 3, React Native Skia for advanced graphics/shadows/gradients, Tamagui/Tailwind RN for styling, Zustand/Jotai for state, React Navigation 7 for routing, and full adherence to Clean Architecture (entities, useCases, repositories, controllers, presenters/views).
CRITICAL CONSTRAINTS: Analyze the attached UI mockup image G97aP61XsAEw5dB.jpg with forensic precision—recreate EXACTLY its spacing (measure in pixels/rem), typography (font-family, weights, sizes, line-heights, kerning), colors (extract HEX/RGB values from shadows, gradients, backgrounds, text), component shapes (radii, borders, elevations), and layout/visual hierarchy (z-index stacking, alignment, padding/margins). This is NOT inspiration—achieve 100% fidelity: screenshot-for-screenshot identical across iOS/Android/Web (use React Native Web). Use single global theme file for all colors (no hardcoded hex), shadow-for-all utility with proper navigation states (focus, hover, active, disabled), and state handlers reflecting design intent (e.g., button presses animate shadows/opacity, inputs show focus rings matching image).
Build the COMPLETE PRODUCTION-READY APP using STRICT OOP PRINCIPLES and CLEAN ARCHITECTURE:
Decompose UI into 100 atomic, reusable components: Break every element (buttons, cards, icons, inputs, modals, headers, lists, gradients, shadows) into independent, typed, composable units (e.g., PrimaryButton, ShadowCard, GradientBackground, Typography.TitleH1). No monolithic screens—use high-order components (HOCs) for theming/state injection.
Global Theme & Shadows: Single ThemeProvider exporting typed theme object (colors, radii, shadows, spacings extracted from image). Shadows as reusable ShadowBox/ShadowText components with elevation props (e.g., elevation: 'sm' | 'md' | 'lg' matching image depths).
State Management: Functional, intent-driven handlers—no side effects in views. Use useAppState hooks reflecting design interactions (e.g., form validation states show exact error/success visuals from image).
Folder Structure (enforce strictly):textsrc/
├── architecture/ # Clean Arch layers
│ ├── domain/ # Entities, UseCases
│ ├── data/ # Repos, APIs
│ └── presentation/ # Controllers, Views
├── components/ # Atomic UI (Button.tsx, Card.tsx, etc.)
├── components/composed/# Screens (HomeScreen.tsx using atoms)
├── hooks/ # Custom state/logic (useFormHandler.tsx)
├── theme/ # Global theme/shadows/utils
├── navigation/ # Typed Navigator
└── types/ # Full TypeScript defs
Performance & Best Practices: Memoize all components (React.memo, useCallback), virtualize lists (FlashList), 60fps animations (Reanimated), accessibility (ARIA labels matching hierarchy), dark/light mode parity (image primary), offline-first (if applicable), tests (Jest React Native Testing Library for every component).
DETAILED EXECUTION PROCESS (follow sequentially, output code at each major step):
Image Forensic Analysis (output first): Generate a spec doc—list exact colors (e.g., primary: #1E293B, shadow: rgba(0,0,0,0.25)), fonts (e.g., SF Pro / Inter, weights 400/600/700), spacings (e.g., 16px gutters), breakpoints (mobile-first: 375px base), hierarchy (e.g., H1: 32px bold, primary CTA: 56px wide rounded-12 shadow-md).
Global Theme Generation: Build theme/index.ts with createTheme() exporting image-exact palette, shadows (boxShadow: { sm: '0 1px 3px rgba(...)' }), typography scales.
Atomic Components (build 20 core ones first): AppSafeArea, GradientOverlay, ShadowContainer, Typography variants (Heading1-6, Body1-3, Caption), IconButton, FilledInput, PrimaryButton (with press ripple/shadow lift matching image), Card (with exact border-radius/shadow stack).
Composed Screens: Assemble screens using atoms only (e.g., HomeScreen = () => <ScreenContainer><HeroGradient><Typography.H1>Exact text</Typography.H1><PrimaryButton title="CTA from image" /></HeroGradient></ScreenContainer>). Match full layout flow.
Navigation & State: Typed AppNavigator with stacks/tabs per image flow. Intent handlers: handleLoginPress() → state update → visual feedback (e.g., loading spinner shadow matching design).
Polish & Validation: Add micro-interactions (scale 0.98 on press), exact gradients (linear-gradient from image), responsive scaling. Generate screenshots vs. image diff. Expo publish-ready config.
SUCCESS CRITERIA (fail if not met):
100% visual match (use react-native-image-diff or manual verify).
Zero hardcoded styles/colors—everything from theme.
Fully typed TS—no any.
OOP purity: Components stateless where possible, props-driven, HOCs for reuse.
Runnable: npx expo start --clear, works on iOS/Android/Web.
Bundle size <150KB gzipped, 60fps.
IMMEDIATELY EXECUTE: Begin with image analysis spec global theme code. Output complete, copy-paste-ready Expo project (package.json, App.tsx, all files). Deploy preview link via Expo EAS. Query for clarifications only if image ambiguous—assume pro mockup clarity.
3
1
25
734
5 Nov 2025
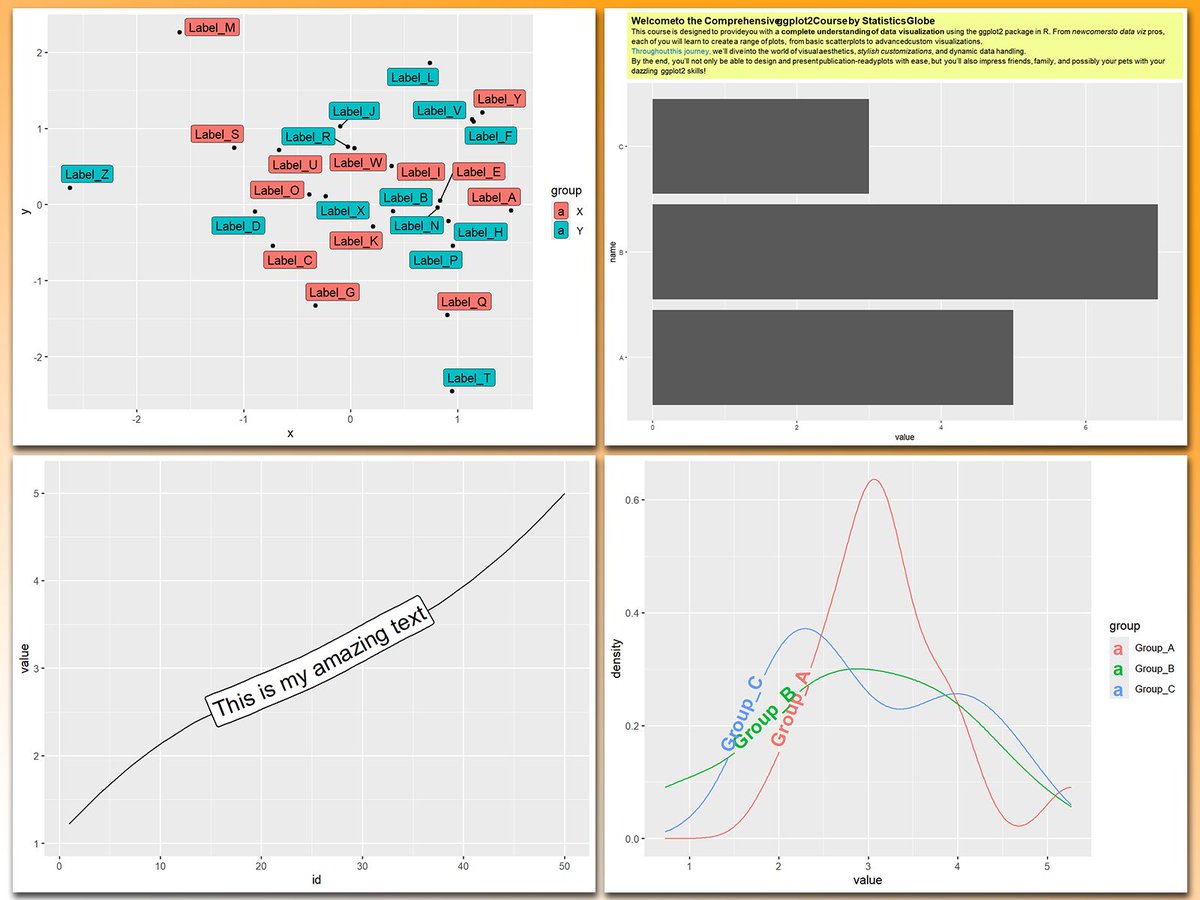
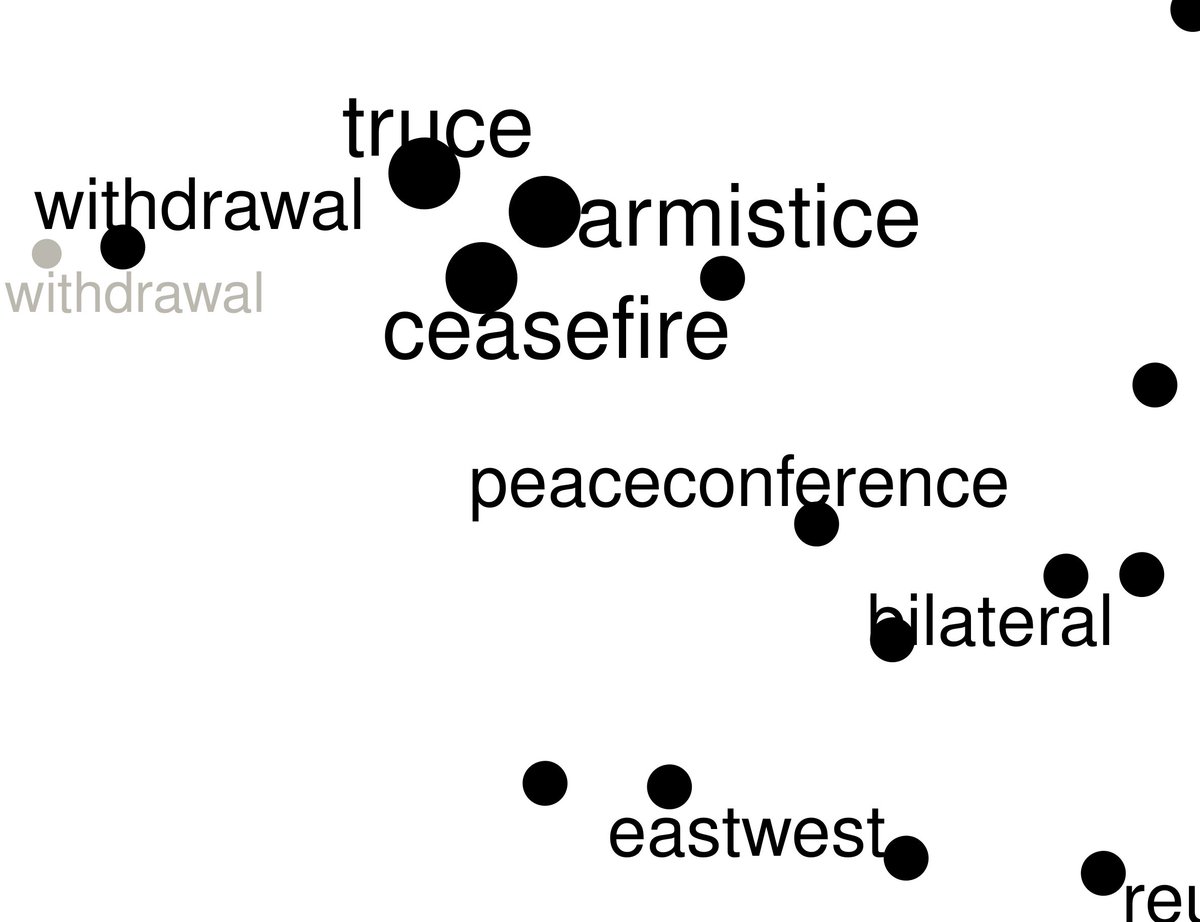
Working with text in ggplot2 plots can be a mess, especially when dealing with overlapping labels, busy backgrounds, or the need for custom formatting. Thankfully, several powerful ggplot2 extensions make text manipulation and annotation much easier and more effective.
These are my top 5 packages for manipulating text in ggplot2 plots:
1️⃣ geomtextpath: Lets you add text directly along paths or curves, creating seamless annotations that integrate beautifully with your data.
2️⃣ ggtext: Enables styled text using HTML and Markdown, allowing you to add rich formatting to titles, subtitles, and annotations.
3️⃣ ggrepel: Prevents text overlap by automatically adjusting label positions, ensuring labels stay clear and readable.
4️⃣ ggfittext: Dynamically resizes text to fit inside geoms like bars or tiles, keeping annotations clean and legible.
5️⃣ shadowtext: Improves readability by adding shadows to text, making labels stand out against busy or colorful backgrounds.
With these tools, text in ggplot2 becomes much more manageable and visually appealing. In the graph shown here, you can see examples of how these packages enhance text, from styled titles and path annotations to entire text boxes and clear label placements.
If you’d like to learn how to use ggplot2 and its extensions, join my online course, Data Visualization in R Using ggplot2 & Friends. I’ll guide you step-by-step to mastering text manipulation and annotation in your visualizations! Check out this link for more details: statisticsglobe.com/online-c…
#Python #tidyverse #DataViz #DataScience #RStats
11
81
3,849
24 Mar 2025
Working with text in ggplot2 plots can be a mess, especially when dealing with overlapping labels, busy backgrounds, or the need for custom formatting. Thankfully, several powerful ggplot2 extensions make text manipulation and annotation much easier and more effective.
These are my top 5 packages for manipulating text in ggplot2 plots:
1️⃣ geomtextpath: Lets you add text directly along paths or curves, creating seamless annotations that integrate beautifully with your data.
2️⃣ ggtext: Enables styled text using HTML and Markdown, allowing you to add rich formatting to titles, subtitles, and annotations.
3️⃣ ggrepel: Prevents text overlap by automatically adjusting label positions, ensuring labels stay clear and readable.
4️⃣ ggfittext: Dynamically resizes text to fit inside geoms like bars or tiles, keeping annotations clean and legible.
5️⃣ shadowtext: Improves readability by adding shadows to text, making labels stand out against busy or colorful backgrounds.
With these tools, text in ggplot2 becomes much more manageable and visually appealing. In the graph shown here, you can see examples of how these packages enhance text, from styled titles and path annotations to entire text boxes and clear label placements.
If you’d like to learn how to use ggplot2 and its extensions, join my online course, Data Visualization in R Using ggplot2 & Friends. I’ll guide you step-by-step to mastering text manipulation and annotation in your visualizations!
Take a look here for more details: statisticsglobe.com/online-c…
#DataVisualization #Rpackage #VisualAnalytics #Python #ggplot2 #programmer #pythoncode #tidyverse #RStats #datasciencetraining

12
81
6,267
8 Dec 2024
Working with text in ggplot2 plots can be a mess, especially when dealing with overlapping labels, busy backgrounds, or the need for custom formatting. Thankfully, several powerful ggplot2 extensions make text manipulation and annotation much easier and more effective.
These are my top 5 packages for manipulating text in ggplot2 plots:
1️⃣ geomtextpath: Lets you add text directly along paths or curves, creating seamless annotations that integrate beautifully with your data.
2️⃣ ggtext: Enables styled text using HTML and Markdown, allowing you to add rich formatting to titles, subtitles, and annotations.
3️⃣ ggrepel: Prevents text overlap by automatically adjusting label positions, ensuring labels stay clear and readable.
4️⃣ ggfittext: Dynamically resizes text to fit inside geoms like bars or tiles, keeping annotations clean and legible.
5️⃣ shadowtext: Improves readability by adding shadows to text, making labels stand out against busy or colorful backgrounds.
With these tools, text in ggplot2 becomes much more manageable and visually appealing. In the graph shown here, you can see examples of how these packages enhance text, from styled titles and path annotations to entire text boxes and clear label placements.
If you’d like to learn how to use ggplot2 and its extensions, join my online course, Data Visualization in R Using ggplot2 & Friends. I’ll guide you step-by-step to mastering text manipulation and annotation in your visualizations!
Check out this link for more details: statisticsglobe.com/online-c…
#datavis #datascienceeducation #ggplot2 #RStats #VisualAnalytics

21
142
8,510

14 Apr 2022
Also have to S/O @mrcaseb for the shadowtext recommendation, you can actually read the percent text now lol
3


15 Dec 2021
finally, there are some #rstats packages that were super useful & worth highlighting:
- furrr: speeds up purrr’s mapping functions with parallel processing
- shadowtext: add colored borders to geom_text() objects
both are on CRAN and made my life a lot easier! 6/x
1
1
6

5 Nov 2021
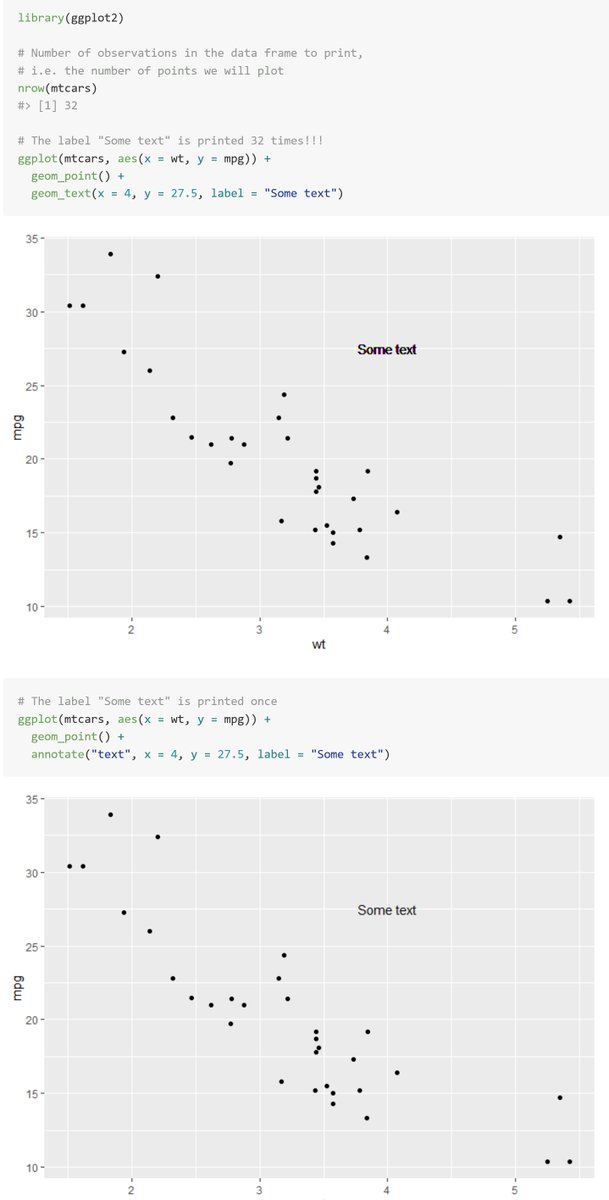
Helpful tip here for ggploters! Especially if you use shadowtext::geom_shadowtext() like I do (which will plot the text dozens more times for every record in the dataset)

I keep getting asked why it is bad to use geom_text() instead of annotate() for text annotations in #rstats ggplot2.
So I made a small example. Let's keep it short:
labels in geom_text are printed multiple times, even if x, y, and label are no aesthetics.
8


3 Sep 2021
Bird sightings at Australian bird baths for this week's #TidyTuesday. I really liked the grayscale look and decided to keep it for the final image. Packages used: gggibbous, ggrepel, shadowtext and ggnewscale
code: github.com/gkaramanis/tidytu…
#dataviz #RStats
(1/2)

1
6
62

27 Aug 2021
#Rstats ggplot extension package of the day: shadowtext, by @guangchuangyu cran.r-project.org/web/packa… Quick and easy text halos to make your labels readable on all backgrounds

2
17
83

24 Feb 2021
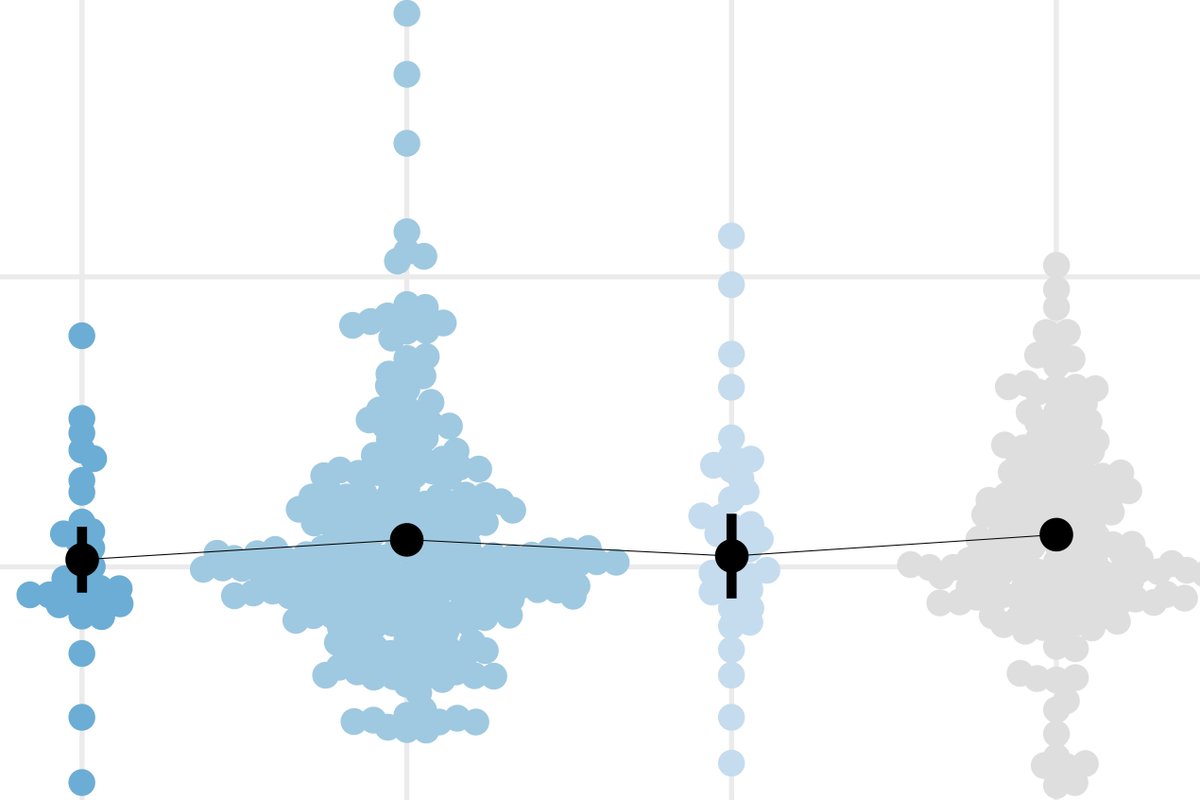
Or #ggbeeswarm by Erik Clarke - turns uninformative overlapping points into nice little clouds that also double as a density plot (imo often better than geom_violin). Also @slowkow's #ggrepel for nicely laid out non-overlapping labels and @guangchuangyu's shadowtext: 4/n
1
2

23 Feb 2021
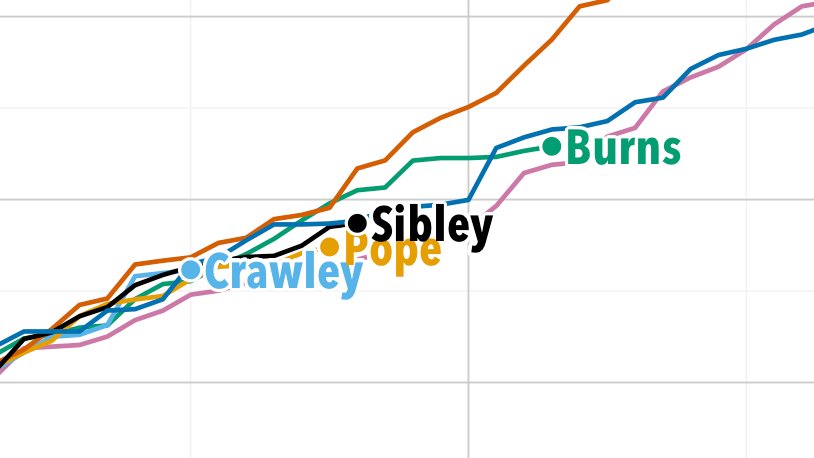
Discovered the wonderful {shadowtext} package whilst doing this. Thanks to @guangchuangyu!. It's a small thing that makes a big difference to readability of chart 👍 #rstats #ggplot2
1
8
1 Aug 2020
Thank you! I do a small handful of things, but if you’re looking for font stuff:
- shadowtext: puts an outline around text for better readability
- ggrepel: jitter text to keep from overlapping
- extrafont: access to tons of fonts, adds a nice personal touch
3


21 May 2020
How to Enhance Your ggplot2 Graphs : Scales & Shadowtext. Here we take a look at some of the add-on packages available to ggplot users sportscidata.com/moving-beyo…
3
7

4 May 2020
Yessir! And my new favorite package package {shadowtext} for the text on the plot itself.
11 Mar 2020

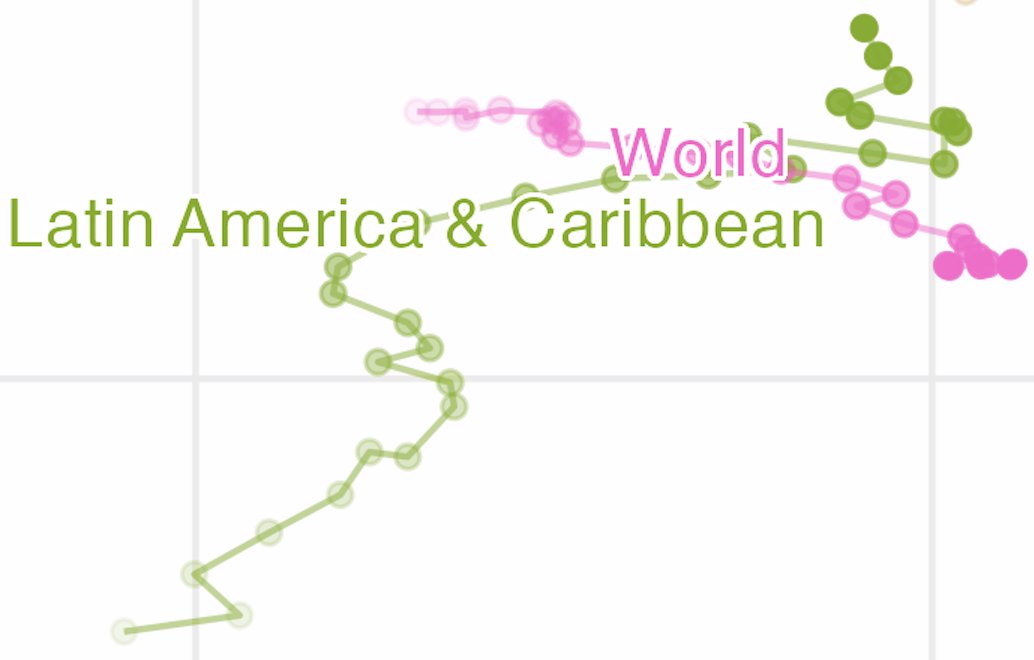
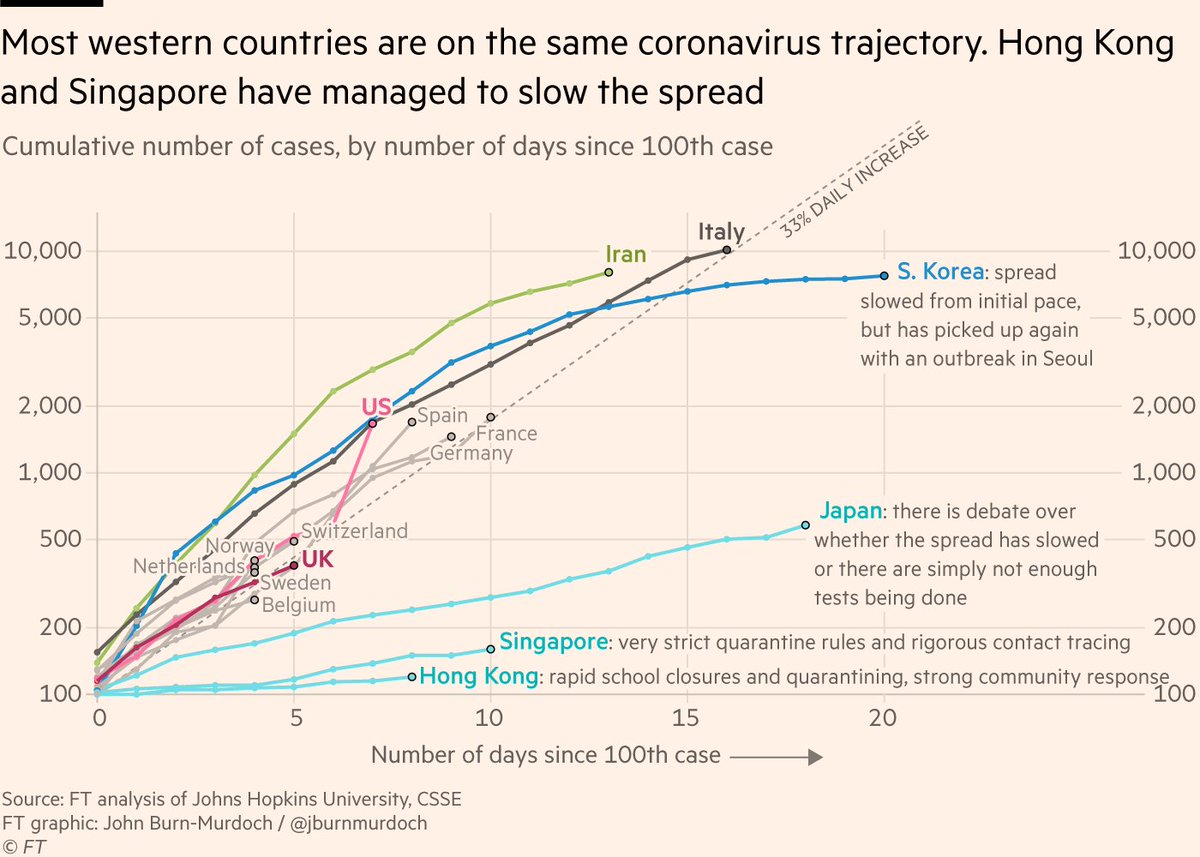
See the little backgrounds that make the country names in this plot easier to read?
@jburnmurdoch was kind enough to share his #rstats code so I could see how it was made (bit.ly/33cNZgJ).
Learned about the shadowtext package by @guangchuangyu: bit.ly/33hzdpi
1
2
11 Mar 2020
See the little backgrounds that make the country names in this plot easier to read?
@jburnmurdoch was kind enough to share his #rstats code so I could see how it was made (bit.ly/33cNZgJ).
Learned about the shadowtext package by @guangchuangyu: bit.ly/33hzdpi
11 Mar 2020

NEW on coronavirus: many western countries may soon face Italy’s situation
Case numbers since outbreaks began in several countries have tracked a ~33% daily rise. This is as true for UK, France, Germany as Italy; the latter is simply further down the path ft.com/content/a26fbf7e-48f8…
6
53
241