
Some good comments here. Another factor is (sometimes) planning around modern delivery codecs and color subsampling. 4:2:0 Reds are fuzzy and other colors are blocky. I usually push skin tones a little too orange for that reason even though I prefer a redder Kodak look.
1
6
289

Good luck finding a 4k tv that doesn't do chroma subsampling lol
1
138

KDE on Wayland is a much better experience than Gnome on Wayland. Then again, KDE mogs Gnome no matter the context. The ONLY complaint I have is there's no way to change the chroma subsampling and my card defaults to like 4:2:0 or some shit even though I can run 4:4:4.
1
9
151

Jun 13
About the video you recommended at the end called "The Biggest Mistake in the History of Hollywood", another rollercoaster 😂
0:13 - What you saw is macroblocking, an artifact of video compression, commonly more visible in gradients of the same color shade, it is streaming my dude, that is why BluRay is a little bit better, more bitrate, less compression.
0:22 - Yup, there is more things other than just pixel resolution, 4K is just one of many other specs to consider to get the best image quality, and in the case of consumer video, BluRay is the best out there, doesn't have the constrains of streaming which requires a huge bandwidth and never gets to the same bitrate of a BluRay disk. You can also download an uncompressed repackaged BluRay, around 75GB of data BTW 😂
0:51 - Nop, 4K isn't a lie, they deliver 4K-UHD video, but not without compression.
1:20 - Yes, movies were recorded in film, but there were and still are tons of film formats and sizes, and the sensibility of the film was linked to the silver grain size, so truly perfect images required a big film frame with finer grain and tons of light, but even there we had temporal resolution, the motion blur inherited of using the 180 degree rule in the shutter. A Super 8 film for low light would have worst resolution than TV 😂, check this calculator and learn more about lp/mm in film and film scanners:
tools.rodrigopolo.com/FilmRe…
3:41 - Yes, there were NO pixel resolution in film, but there were lp/mm and mft charts for lenses and film, and it matter.
6:11 - It is called "chemical process", which could give a washed out look, a darker or lighter, you could even play with RGB during transfers, but not the level of control of color grading.
5:51 - No, there is no problem, "O Brother, Where Art Thou?" was shoot using full open gate 4-perforation pull-down format on Super 35mm film (24.89mm x 18.66mm), Roger Deakins used three specific Kodak film stocks, Eastman EXR 100T 5248 as the primary stock for most daylight exterior scenes, Kodak Vision 500T 5279 for shooting night interiors and all night exterior scenes, and Eastman EXR 200T 5293 for daylight sequences in deeply shaded forest environments and for recording bluescreen elements, wider field of view was archieved using spherical Cooke S4 lenses before the image was cropped to its final 2.39:1 widescreen aspect ratio, they didn't used anamorphic lenses.
The emulsion Type and sensitivity and the average resolving power (lp/mm) of those stocks are:
* Eastman EXR 100T 5248, Medium-Speed Tungsten (100 EI), 100 lp/mm
* Eastman EXR 200T 5293, Medium-Speed Tungsten (200 EI), 90 lp/mm
* Kodak Vision 500T 5279, High-Speed Tungsten (500 EI) | 80 lp/mm
So the theorical (lp/mm) calculated with perfect lightning and contrast, and perfect optics would be:
* 4978x3718 open gate, 4978x2074 cropped.
* 4480x3346 open gate, 4480x1866 cropped.
* 3982x2974 open gate, 3982x1659 cropped.
But resolving power drops slightly in lower contrast scenes, where these stocks average closer to 50 lp/mm (for the 5248) and 40 lp/mm (for the 5279), so the real world numbers are:
* 2489x1859 open gate, 2489x1037 cropped.
* 2489x1859 open gate, 2489x1037 cropped.
* 1991x1487 open gate, 1991x829 cropped.
As you can see, 2K was more than enough, and for 4K there was an issue, there was no computing power to deal with that amount of resolution at the time, no scanners and printers for that. Have you seen the original 1080p version of The Matrix (1999)? (image attached) Look at the 1:36:00 timestamp, the white loading scene, you can see the film gran, the digital scan has higher resolution than the film.
7:53 - It is NOT tricking you, it is NOT fake 4K, if you bought a BluRay disk for that movie is clearly in 1080p, there is no conspiracy at all 😂
8:31 - There are several films remastered in 2K that had been transformed in 4K-UHD trough the use of IA, with some caveats.
9:07 - No, the color banding is produced by video compression.
13:45 - I'm glad you realized the viewing distance, because only pixel peepers with 20:20 vision could see the difference between 4K-UHD and FHD, that is why I created these in 2012 (recently updated) during the Apple Retina debacle:
tools.rodrigopolo.com/Displa…
15:19 - Partially true, see, the deal with Full-HD and 4K is that you need a big screen in order to appreciate the extra detail, I'm old enough to remember huge standard definition TVs that didn't show any extra detail, then with FHD we can have a big screen that showed the extra detail, and when 4K-UHD arrived, I finally got a 85" screen that showed the amount of detail of The Dark Knight, or any other Nolan movie, off course most movies aren't true 4K, but have you seen old TV shows that were recorded in 4-perf Super 35 now in 4K? Two And A Half Men or Friends, they look stunning, and you can see the film grain, exposing that FHD was more than enough 😂 It is NOT an excuse to charge you more for a 4K title, it require more computational power, better technology, more bandwidth, etc. It is expensive as hell, you more than anyone know this, it isn't the same producing in 1080p than producing in 2160p, 4 times the storage size, 2x the render time, etc. And again, even while scaling-up 2K footage to 4K, you get more detail, even on streaming.
18:54 - NO, the cause of your color banding isn't the conversion to BT/Rec.709, it is the quantization and macroblocking produced by video codecs like AV1, HEVC / H.265, AVC / H.264, VP9, etc. Not to mention the conversion from a chroma of 4:4:4 to 4:2:0, check what chroma subsampling does to movies, that is why Michael Bay made Optimus Prime color more purple in his movies:
youtu.be/32PPzwPjDZ8
19:41 - Indeed, it is not Netflix greed, it is Adaptive Bitrate Streaming (ABR), check your network connection in fast.com, or try the CLI tool yt-dlp to check all the available streams on a youtube video, you'll see why most users don't get to see true 4K with not so compressed quality.
20:06 - Nop, streaming don't sacrifice color for resolution, the main issue is video compression, highly compressed video will lose both, detail and color information, it is a combination of both.
20:27 - You said "the extra storage in that disc is being used for that detail and for that color, not for pixels", that is completely wrong, BluRay discs employ codecs that use similar algorithms of those in streaming services and sometimes the same codecs, the difference is the compression ratio, the "recipe", HEVC/H.265 used in BluRay is almost the same as VP9 used in streaming, in fact, there was a huge controversy some time ago when Steve Jobs pointed out how Google's "open source" codecs were copying X264 and Jobs directly cited an article by the lead developer of X264 at the time, Fiona Glaser (formally Jason Garrett-Glaser with the alias Dark Shikari), you can Google it. Compression algorithms compress both, color and detail (pixels), not to mention entire frames in IPB.
20:56 - You'll never watch a movie in your home theater that look exactly on how the director view it, and never in a movie theater, because each projector digital or analog is different, each film stock where the film is copied is different, each chemical process is different, each screen is different, etc. This video masterfully explain the issue:
youtu.be/uQwQRFLFDd8
22:00 - Most purists are used to the film look of analog film because because they grew up with that, that is why the recent installment of Dune even tough it was film digitally, after it was done in editing and grading, it was then printed in film and re-scanned, to get that film grain, halation, softness, etc. IN DIGITAL FORM 😂
22:32 - Darn, you adressed the same thing I said in the previous point, never mind.
23:05 - In all the analysis you didn't consider the temporal resolution, the 180 degree rule always will introduce motion blur, thus, degrading the resolution. Now, watch The Hobbit Trilogy (48 fps) or Gemini Man (120 fps), you'll see more resolution because of the temporal resolution, and it looks like a video demo, not like cinema, movies are soft, that is why even in analog they used difussion filters, even dirtying the lens with Vaseline 😂 look it up.
¯\_(ツ)_/¯
23:18 - Nop, sadly, the slogan that HDR has more color isn't completely true, it contains more brightness, as an analogy for you that use Resolve, is like adding more stops in the highlights so you can adjust the Gain wheel, that's all. In a Resolve project using Re.709 as the timeline color, import one of your favorite shoots for any movie or tv show and check the waveform, then use Rec.2020 and import and HDR content, you'll see that is just brightness and not so much extra color.
28:33 - Yes, Nolan's films have a digital intermediates, all movies have, , and yes, he uses CGI in some shoots, check the behind the scenes.
So, after watching your video, I want to share with you something: I watched Project Hail Mary (2026) in the movie theater, then I got the streaming version, not once I though about the resolution because the image looks just good enough, but when I watched The Matrix from 1999 on my 85" screen I immediately saw the film grain in the white room scene, it was distracting because it breaks the illusion of an infinite white room. It is not about pixels or film grain, it is about telling a story with it trying to guide the user attention to that story. 😉


1
2
565

Jun 13
It can accurately sample analog video at up to 1080p resolution, and not have to fallback to 4:2:2 chroma subsampling to reach that bandwidth level.
1
94

Uncertainty Estimation for Molecular Diffusion Models
1. The paper addresses a practical gap in 3D molecular diffusion generation: pretrained diffusion models can output chemically invalid/unstable molecules, but they provide no principled per-sample signal of “this generation is likely low quality,” which is crucial when downstream evaluation (docking, wet lab) is expensive.
2. The authors propose a post-hoc uncertainty estimator that works with an existing pretrained molecular diffusion model (no retraining): fit a Laplace approximation around the denoiser’s MAP parameters and use it to quantify how variable the denoiser’s noise predictions are during sampling.
3. Core idea: for selected denoising timesteps, sample multiple parameter vectors from the approximate posterior q(θ), compute multiple noise predictions ε_t^m = f_{θ_m}(x_t, t), and take the elementwise sample variance across these predictions; then aggregate over timesteps, atoms, and feature dimensions into a single scalar uncertainty score per generated molecule.
4. The uncertainty is computed along the generation trajectory, motivated by the intuition that “internally uncertain” samples should induce more unstable/variable denoising behavior; empirically, only a small subset of timesteps is needed, reducing overhead.
5. On QM9, the resulting uncertainty score is informative of sample quality: it shows statistically significant negative Spearman correlations with molecular stability, atom stability, and validity, and it is consistently more predictive than diffusion negative log-likelihood (NLL) as a per-sample quality indicator.
6. Concrete QM9 correlations (Spearman ρ): for EDM, uncertainty vs. molecular stability is −0.284 (vs. NLL −0.150); for GeoLDM, −0.333 (vs. NLL −0.171). Similar gaps hold for atom stability and validity, suggesting likelihood is a weaker “verifier” than the proposed uncertainty for these quality metrics.
7. The paper then uses uncertainty for test-time scaling: oversample N molecules (10K→20K) and keep the 10K lowest-uncertainty samples. This improves stability/validity on QM9 for both EDM and GeoLDM, outperforming NLL-based filtering, with a modest tradeoff of ~1% drop in uniqueness.
8. The gains can be material relative to changing the base generator: for EDM on QM9, oversampling to 20K and filtering back to 10K yields ~10% molecular stability improvement, ~1% atom stability improvement, and ~5% validity improvement—comparable in magnitude to switching from EDM to GeoLDM at the same 10K budget.
9. Limitations and ablations: the filtering benefits do not transfer to GEOM-Drugs (larger, more complex molecules), where neither uncertainty- nor NLL-based filtering beats random subsampling. Ablations also show the Fisher-based Laplace covariance is not essential (isotropic perturbations around MAP perform similarly), implying the score may behave more like a sensitivity-to-perturbation measure than strict Bayesian epistemic uncertainty; signal concentrates near the clean end of the trajectory (late denoising steps).
📜Paper: arxiv.org/abs/2606.13451
#DiffusionModels #MolecularGeneration #ComputationalChemistry #UncertaintyEstimation #TestTimeScaling #BayesianDeepLearning #GenerativeModels #3DGeometry #QM9 #GEOMDrugs

1
24
1,711

#STATI
InSRWFB subsampling method best preserves TCR network properties and effect sizes, providing important reference for large-scale immunological network analysis.
@SmartDataModels @DeepDataModel @maxalpha99 #Statistics #DataScience
Details: maxapress.com/article/doi/10…

21

Jun 12
1. Trajectories vs. State Snapshots (The State-Space Advantage) The reviewer is perfectly correct that a static "state snapshot" cannot adequately predict the future recovery cost. In continuous-time physical systems, subsampling discrete snapshots inevitably induces a moving average (MA) confound and misses distributed lag effects. Because your data extraction uses state-space (VARMA) modeling, it natively evaluates the entire historical trajectory. The state-space matrix formulation mathematically captures how the system's variance over time evolves, making the trajectory itself an observable metric.
2. The GC Spike IS the "Rise in Future Information" When the reviewer asks for a "rise in the amount of future information encoded in the trajectory," they are asking for a measure of directed predictive information. Because your framework relies on Langevin dynamics, the continuous-time Granger Causality (GC) rate (R) we just extracted is mathematically equivalent to Transfer Entropy.
Transfer Entropy specifically measures the amount of uncertainty reduced in the future of a target variable by knowing the past trajectory of a source variable. Therefore, that exponential spike in the GC rate (R=trace[Σ11−1A13P33A13⊤]) that occurs in your Sudden Spike trajectory right before the system hits the 0.008 floor is exactly what the reviewer is hypothesizing: it is the trajectory's variance becoming fiercely predictive of its impending collapse.
3. Aligning with Information Bottleneck (IB) Trajectory Theory This concept is highly active in current AI and representation learning right now. For example, in Information Bottleneck-driven trajectory searches (like the recently published IBTree algorithm), models evaluate the "covariance" of an IB score to measure actual information gain along a trajectory, rather than just generalized uncertainty. Your system is doing the exact same thing but in a physical fluid substrate. The trajectory's changing parameters (captured in the Riccati matrix P33) act as a highly tuned "metal detector" that senses the impending narrowing of the 14D manifold's operational accessibility.
State snapshots fail because they are "blind" to the MA confound induced by temporal demand.
We extracted the trajectory's continuous-time GC rate using state-space VARMA modeling.
The resulting GC spike is the PFIB observable—proving mathematically that the accumulated constraint is encoded as a rise in future predictive information inside the trajectory, microseconds before the Autocide Operator (α∧) is forced to physically prune the flow at the 0.008 limit.
1
1
60
Jun 12
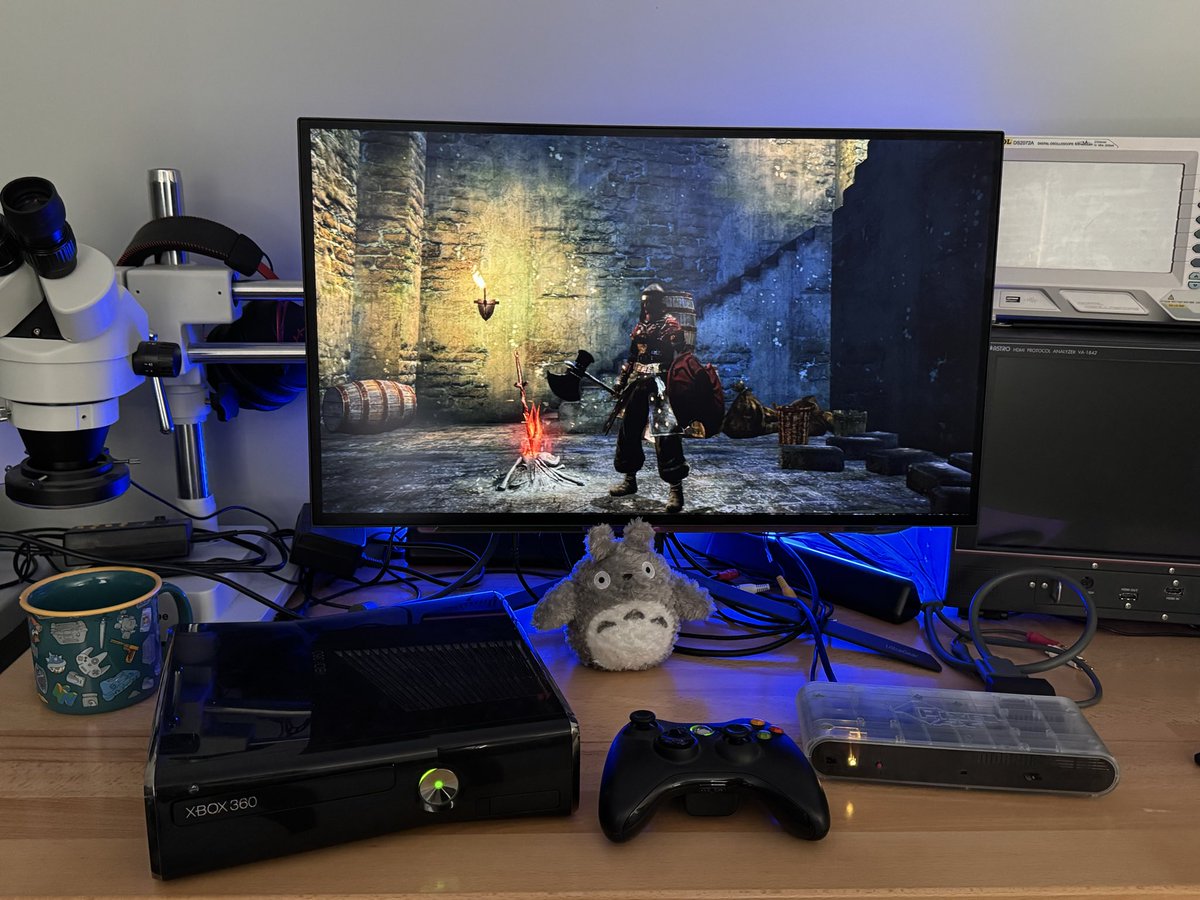
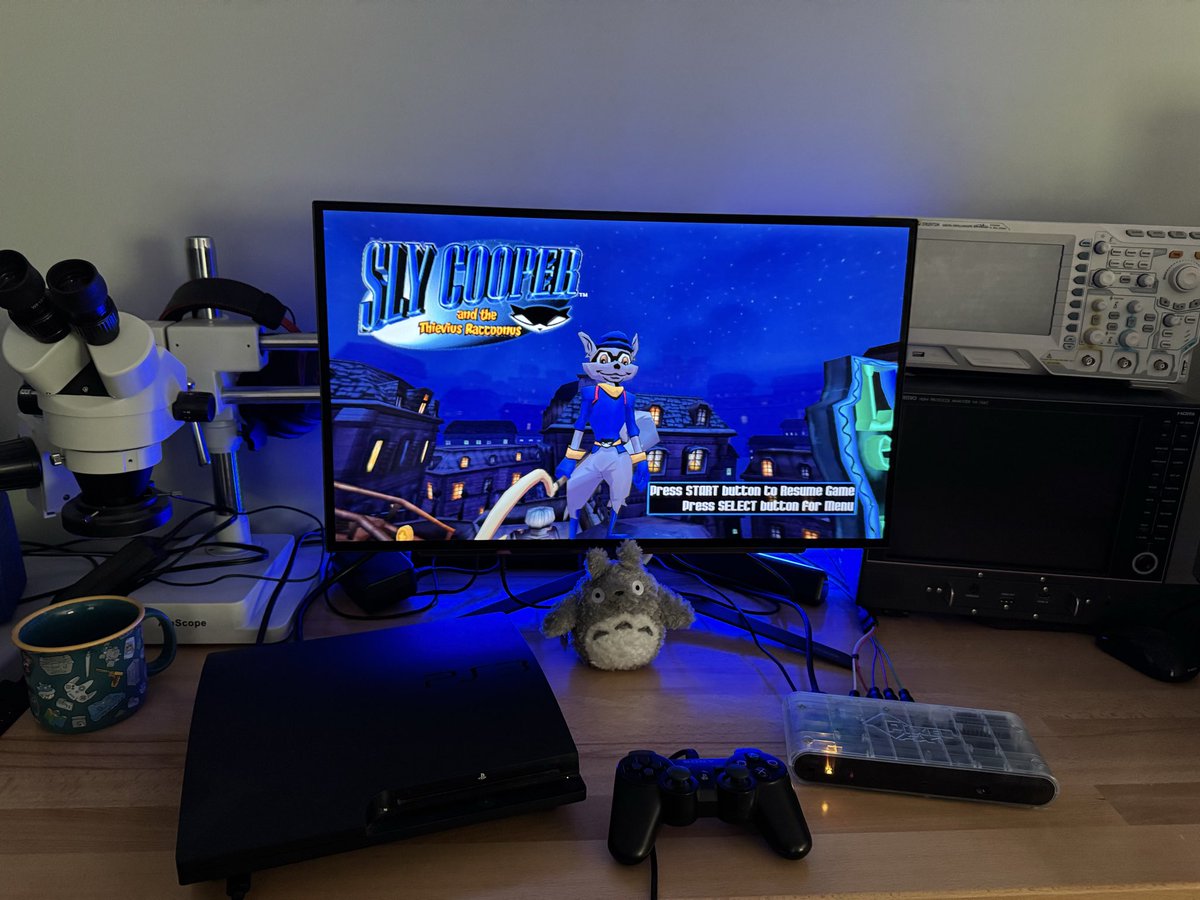
One of my favorite features of the Morph 2K is its high performance analog input stage.
It supports 720p and 1080p from consoles like the Xbox 360 (VGA) and PS3 (Component) with no chroma subsampling, preserving full color detail.
Combined with digital audio support and 1440p output, it’s one of the best ways to enjoy these consoles without stepping up to a Morph 4K.
5
12
136
9,057

Jun 12
why does macOS choose awful chroma subsampling settings over rgb on literally every display I own
& Why do I need external software to fix it 😭
7

Jun 12
Data-driven subsampling rates for diffusion parameter estimation of SDEs
Felix Lindner, Andre Schmeißer, Felipe Trolldenier, Raimund Wegener
arxiv.org/abs/2606.13615 [𝚖𝚊𝚝𝚑.𝙿𝚁 𝚜𝚝𝚊𝚝.𝙼𝙴]
16

Symmetric Cooperative Motion in Higher Dimensions
arXiv:2606.13459
Branching-selection particle systems and inverse first passage problems
arXiv:2606.13487
Data-driven subsampling rates for diffusion parameter estimation of ...
arXiv:2606.13615
1
1
128

Jun 11
They did thoughtful subsampling and benchmarked current methods starting from simpler to complex models.
thorough design.

1
38

Jun 11
XGBoost stands for eXtreme Gradient Boosting. It is an efficient, flexible machine learning algorithm used for supervised learning tasks such as classification and regression.
Why Boosting Works
Boosting works by combining multiple weak learners, typically simple decision trees, to create a single strong learner. The core idea is iterative improvement. Instead of training models independently, boosting trains them sequentially. Each new model focuses on correcting the errors introduced by combining all previous models. By focusing on hard-to-predict data points that previous trees misclassified or mispredicted, the model gradually reduces total error, resulting in high predictive accuracy.
XGBoost Differs from Random Forest
While both are ensemble methods based on decision trees, they operate differently.
Random Forest uses Bagging. It builds multiple decision trees in parallel, each on a random subset of the training data. The final output is an average or a majority vote of all trees. This approach aims to reduce variance, making the model robust against noise.
XGBoost uses Boosting. It builds shallow trees sequentially. Each tree tries to optimize the objective function using the residuals from previous trees. Because it learns from mistakes, it is generally more accurate than Random Forest but can be more prone to overfitting if not properly tuned. XGBoost also includes built-in regularization and handles missing data natively, whereas Random Forest typically requires pre-processing to handle them.
Bias-Variance Tradeoff
The bias-variance tradeoff is a central concept in model performance.
Bias refers to the error introduced by approximating a complex real-world problem with a simplified model. High bias leads to underfitting, where the model is too simple to capture the underlying patterns in the data.
Variance refers to the error introduced by the model's sensitivity to small fluctuations in the training set. High variance leads to overfitting, where the model captures noise rather than the signal, performing well on the training data but poorly on unseen data.
Boosting aims to reduce bias by incrementally improving the fit to the data. However, as the model becomes more complex with many trees, it risks increasing variance.
Overfitting and Regularization
XGBoost mitigates overfitting by regularization, which penalizes overly complex models.
L1 Regularization (Lasso) and L2 Regularization (Ridge) are integrated directly into the objective function. These penalties discourage large weights in the model, effectively simplifying the decision boundaries created by the trees. Additionally, XGBoost employs techniques such as tree pruning, which removes branches that do not contribute significantly to the predictive power, and subsampling (row and column sampling) during the construction of each tree. These methods ensure the model generalizes well to new data rather than just memorizing the training set.
--- B. Noted


35

Jun 11
Poor bitrate is the biggest one for sure, but heavy chroma subsampling and poor upscaling can contribute greatly. I agree though, quality of pixels matters far more than pixel count
125

Tests for Independence of High-Dimensional Nonstationary Time Series
arXiv:2606.08498
Biweighted Poisson Subsampling for Convoluted Rank Regression with M...
arXiv:2606.08668
Statistical Optimality of Prediction-Powered Inference
arXiv:2606.08730
158

Jun 8
parakeet.cpp update, two things just landed:
1. It runs on integrated GPUs now. Ryzen APUs and similar were being skipped and silently falling back to CPU. They're auto-detected now, and PARAKEET_DEVICE can point at any device by name.
2. Long audio just works on CPU and GPU. For long clips it switches to limited-context attention automatically (the same method @NvidiaAI's NeMo uses) and tiles the subsampling, so a 2 hour file goes through in one pass with no flags to set.
NVIDIA GB10, 120 minutes, same attention on both sides: parakeet.cpp 28s, NeMo 44s. 1.6x faster, transcripts agree to 0.3%. Same story on CPU, about 1.6x faster there too.
NeMo needs you to switch it to local attention by hand, or its default runs a 2 hour clip out of memory on GPU. On CPU even that isn't enough, its single pass hits a conv limit at 2 hours. parakeet.cpp picks the right mode for you and does the full 2 hours on both.
2
6
75
5,972

Chroma subsampling is the standard way to do this, not reducing the color range with a filter. A flatter range could theoretically be compressed further, but I think this specific case is an artifact of how editing software re-encodes an existing image.
2
6
136

"Look this up with AI" is not the win you think it is. Even "I" as a massive fan and user of AI technology, I find even the best frontier AI chat models to be horrible for this kind of use case.
Most LLM models have been through tons of rounds of Reinforcement Learning from Human Feedback (RLHF) along with various supervised fine-tuning. Any output a LLM makes is something the human rater wants to read, not whether the information is well-reasoned.
What does this mean?
It means that most AI models are very sycophantic, and they will assess your tone, questioning, and chat history to tell you what you most want to hear instead of a well-crafted multivariate reasoning using counterfactual deduction.
This is why, at most, I use AI models as a glorified search engine, like a Google replacer, and a "hard fact" fact check. Anything along the lines of epistemology, multistep soft reasoning etc., and the AI model typically flounders as it tends to produce predictive outputs depending on the prompt.
For example, it will tell you that among CSA offenders, there is a higher rate of lolicons vs non CSA offenders. This is true. But it will often miss the context that this is a subsample that cannot be generalized to the wider population.
The same phenomenon is seen with violent video games, where among violent offenders, there is a higher rate of them playing games like GTA vs non-violent offenders.
It's the "subsampling error" that people often make when trying to generalize a behavior from a small population of people who are vastly different from the wider pop.
It is a textbook failure of selection bias with base-rate neglect masquerading as straightforward correlation-causation error.
Among all the AIs I've used, Grok is the best at this, but it often makes mistakes in the reasoning chain. ChatGPT, Gemini, and even Claude have been quite terrible on this front.

🚨 Asmongold doubles down on his take that most viewers of Loli become PDF's. Asmon would speak on people on X going against his take, but AI would agree with him.
"There's a lot of people who were super mad at me because I think there's a high probablity, PDF's and weirdos look up Loli. You can look this up on AI."
"People on the internet will not accept this, even you have research, reports and PDF's saying it themselves."
"If you like Loli characters, that's okay. But if you are attracted to them, I think that's a problem. It's really weird."
43
79
958
13,992
There is a difference between the "offender population" with lolicon content vs the normal population with lolicon content.
You are forming a conclusion using a subsampling error, looking at a smaller pop instead of the whole population in general.
6
1
115
3,170