


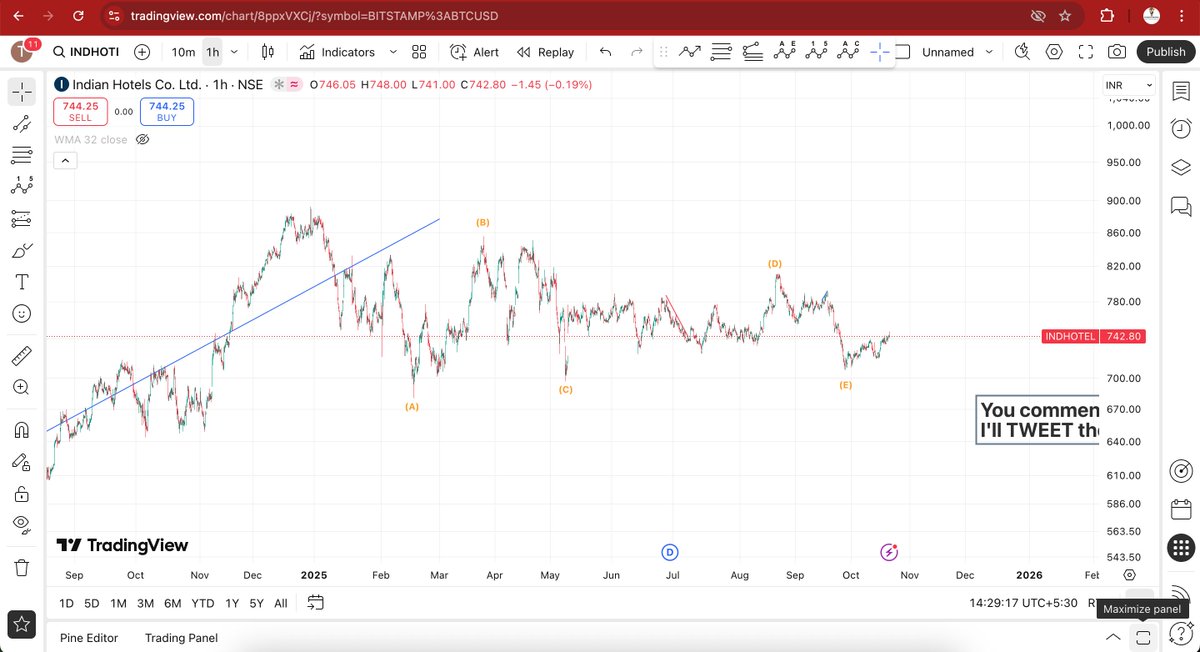
ALT Remember, #Saturn gazing till January. Saturn is a significator of delay. Well, a good structure came out in #indhotel #TrianglePattern #TechnicalAnalysis #StockMarketIndia #ElliottWaveAnalysis


ALT Looks like the #Saturn is gazing upon #INDHOTEL. Well, near the end of Jan, Saturn will be looking somewhere else. #WDGANN #ElliottWaveAnalysis #ElliottWaveAnalysis #StockMarketIndia #TechnicalAnalysis


ALT #DOMS forming a classic #ElliottWavePattern triangle — coiling tight before the breakout. #Trianglepattern #StockMarketIndia #ElliottWaveAnalysis #ElliottWaveCount #TechnicalAnalysis

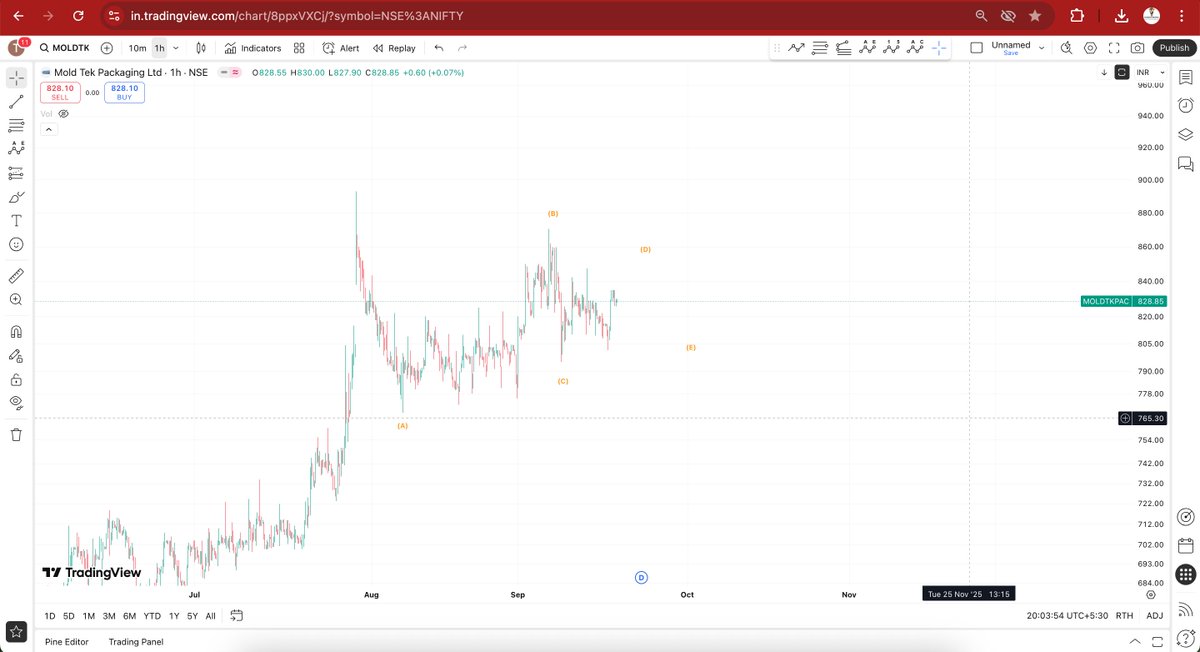
ALT #MOLDTKPAC can give a good rally. #ElliottWaveTheory #ElliottWaveCount #StockMarketIndia #TrianglePattern
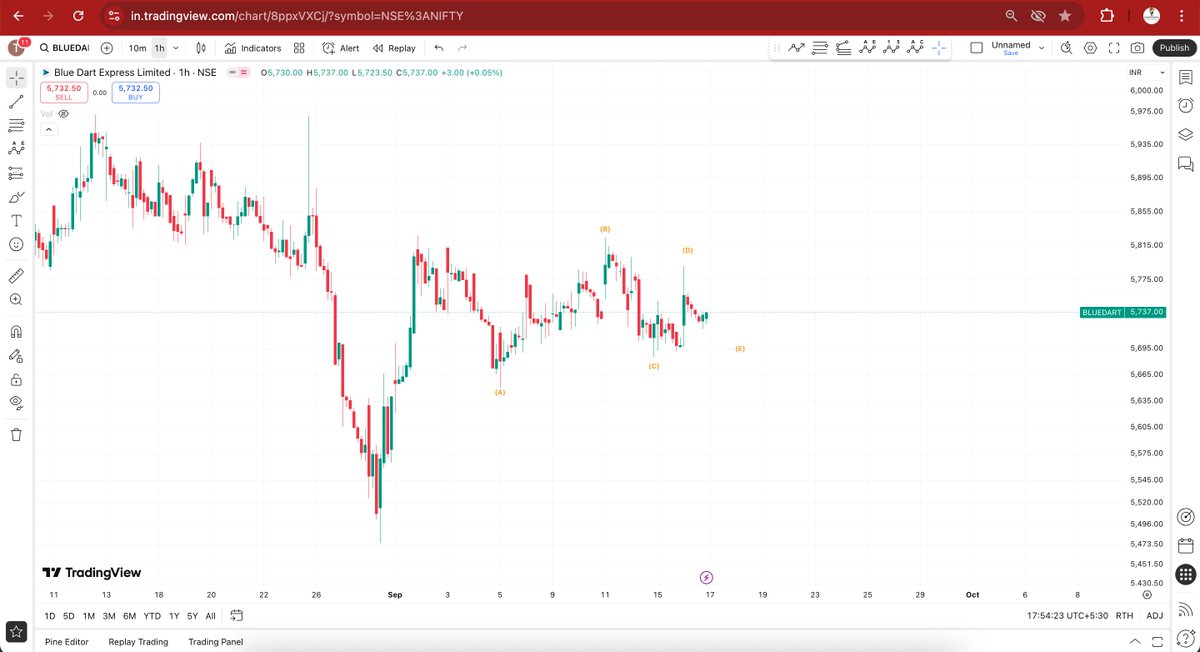
ALT #Bluedart can give a good move with #Trianglepattern #StockMarketIndia #TechnialAnalysis #ElliottWaveAnalysis #ElliottWaveCount
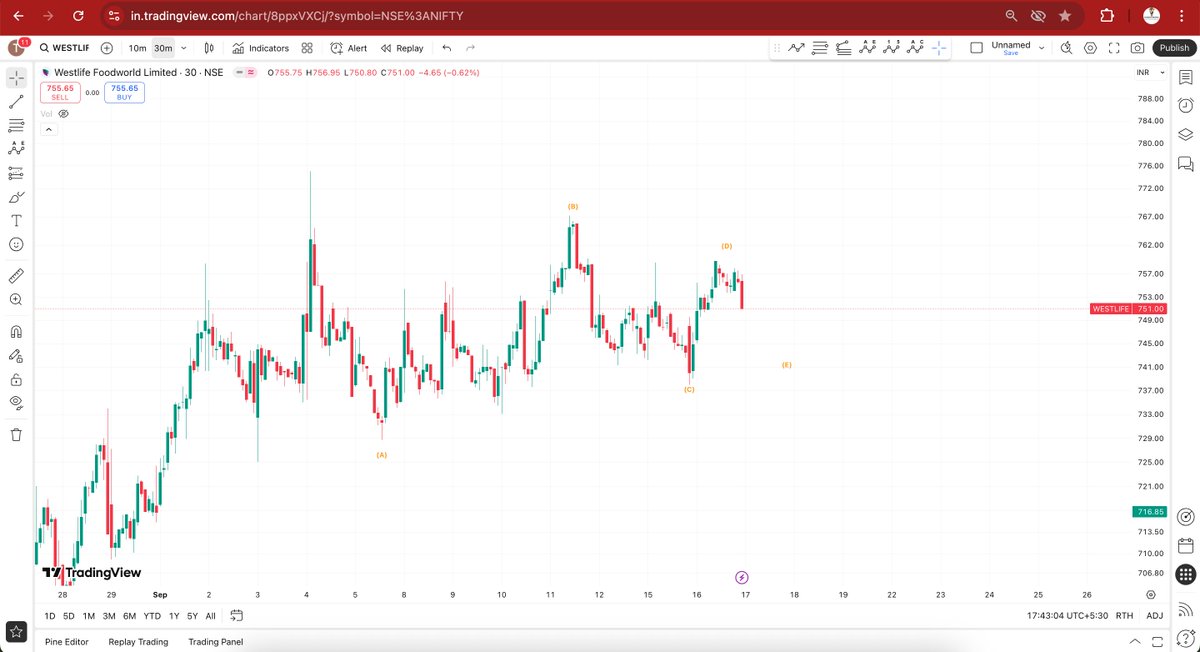
ALT #Westlife is making a good #trianglePattern. Better Risk Reward can be managed. #StockMarketIndia #ElliottWaveAnalysis #ElliottWaveCounts #ElliottWaveTheory #TechnicalAnalysis