⚽🏆 INFOGRAFIA | Ranking de Países con más títulos de la Copa del Mundo de Fútbol FIFA
..
vía Visualcapitalist
#futbol #soccer #deporte #business #gestiondeportiva #sportmanagement

36

Ronaldo: $300M. $235M of that is on-field earnings from Saudi Arabia.
Source: @visualcapitalist
voronoiapp.com/sports/Ranked…

21

3

Jun 12
Crypto sections are being updated with the latest #APIs on VitalyTennant.com. #CoinGecko #CoinMarketCap #Coinpaprika #BinanceAPI
Being a content platform vitalytennant.com/content/, #crypto onboarding is ongoing. Global #stockmarkets equate to about $180 trillion, while $280 trillion (bundling public equities together with all other major investable asset classes) represents the entire #GMP. #MSCI #VisualCapitalist #StateStreet #SiblisResearch #CAGR
Global #CryptoMarket is around $2.5 trillion.
4
48

Mapped: 🗺️ 🔍
Household Income Data:📋🔢📶
💁♂️ 🏡 🏦
Median Household Income Across Major U.S. Metros: 💵
(Source: VisualCapitalist)
📸

144

Jun 12
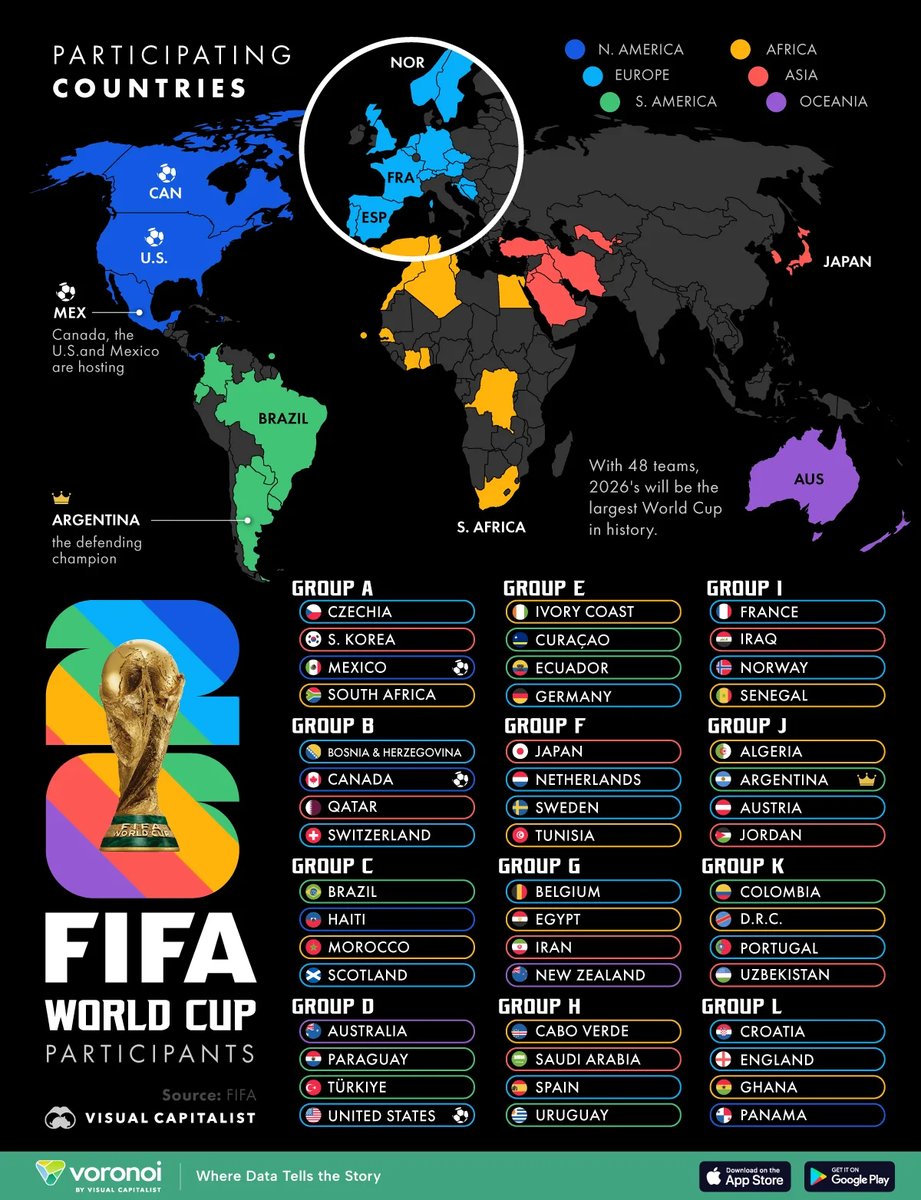
⚽ INFOGRAFIA | Mapa de las 48 naciones que participan en la Copa Mundial FIFA 2026
👉 Récord de 48 equipos, frente a los 32 anteriores
👉 Cabo Verde, Curazao, Jordania y Uzbekistán se estrenan en esta competición
..
Vía visualcapitalist
#fifaworldcup #futbol #gestiondeportiva
1
51

Jun 12
Foreign Owners of U.S. Debt: Top 20 Countries Revealed
🇯🇵 Japan— $1,202.6
🇬🇧 United Kingdom— $888.5
🇨🇳 China— $682.6
🇧🇪 Belgium— $481.0
🇨🇦 Canada— $472.2
🇰🇾 Cayman Islands— $427.4
🇱🇺 Luxembourg— $425.6
🇫🇷 France— $376.1
🇮🇪 Ireland— $340.3
🇹🇼 Taiwan— $312.5
🇨🇭 Switzerland— $300.3
🇸🇬 Singapore — $272.2
🇭🇰 Hong Kong— $256.0
🇳🇴 Norway— $218.9
🇮🇳 India— $186.5
🇧🇷 Brazil — $168.1
🇸🇦 Saudi Arabia — $148.8
🇰🇷 South Korea— $145.1
🇩🇪 Germany — $109.8
🇮🇱 Israel — $107.7
(Source - Visualcapitalist)
1
184

Jun 10
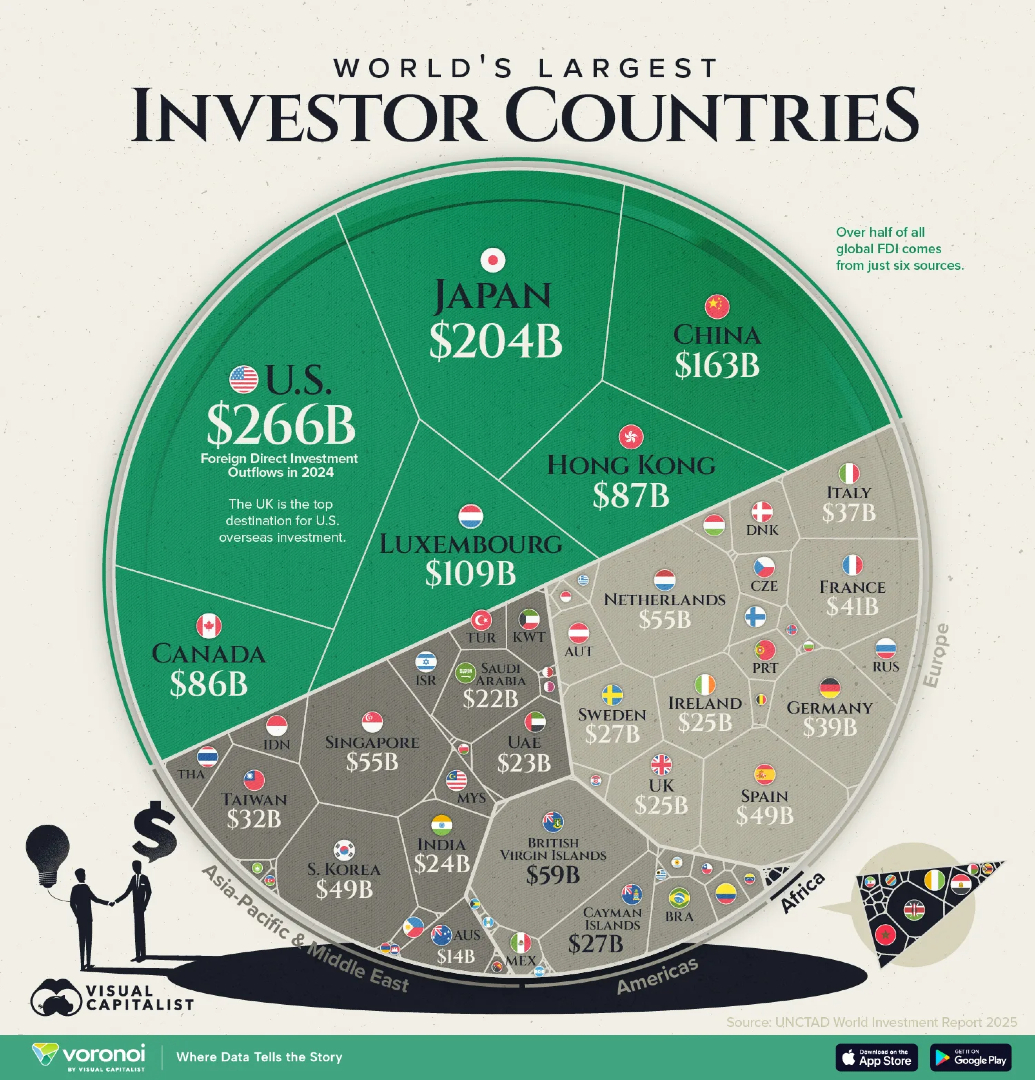
世界最大の海外投資国ランキングを見ると、日本は約2040億ドルで上位に。
これは「日本に投資が集まっている」というより、
日本企業・日本資本が海外へ投資している金額。
日本はまだまだ「世界に投資する側」の国。
#海外投資 #FDI #日本経済 #世界経済 #投資ニュース #VisualCapitalist #UNCTAD

10
homestead1862 retweeted

2026년 세계 인플레이션 극단 순위
by Visualcapitalist

1
8
42
618

This Map Shows Credit Card Debt Is Quietly Destroying Younger Generations — Act Now Before It’s Too Late
The lifetime cost of credit-card use isn’t just a number on a chart — it’s a financial trap that stacks up into the hundreds of thousands by middle age, and the next generation is walking straight into it. The Visual Capitalist map (sourced to JG Wentworth) shows the average American will rack up roughly $388k–$398k in credit-card debt over a lifetime, with some states topping nearly $485k — that’s mortgage-sized damage from revolving balances and interest alone.
Why this matters right now
Revolving balances compound: carrying months of unpaid balances at high rates turns small purchases into massive lifelong costs.
Geographic gaps show policy and education work: states with financial-literacy requirements tend to have the lowest lifetime card totals — prevention scales.
Young people face higher real costs: wage stagnation, rising living expenses, and easy credit mean millennials and Gen Z will shoulder more of this burden unless behavior and systems change.
Three urgent actions every business owner and creator should share
Teach one clear rule: pay the full statement each month or the math destroys your future wealth.
Push financial literacy in your networks and hiring: small policy changes (courses, workshops) lower lifetime debt averages.
Build content that normalizes living below means and using credit responsibly — social proof beats advertising.
Quick example to share with your followers
If someone averages $400k in lifetime credit-card debt, that’s roughly $600–$700 a month in principal (before interest) stretched over decades — with interest, the true cost is far higher and compounds much earlier.
If you care about the next generation’s financial future, this map should be a wake-up call — not a shrug. Share this post, start the conversation in your company or community, and demand better financial education for students and employees today.
#CreditCardDebt #FinancialCrisis #PersonalFinance #MillennialMoney #GenZ #FinancialLiteracy #DebtTrap #VisualCapitalist #JGwentworth #MoneyMatters #DebtFree #WealthBuilding #FrugalLiving #BusinessOwner #Entrepreneurship #EdmontonBusiness #ContentCreator #Finance #Investing #Savings #Budgeting #PayYourBalance #StopRevolving #TeachFinancialLiteracy

2
2
122

NVIDIA is worth more than Europe’s entire top 10 combined. dlvr.it/TSy0lN #NVIDIA #BigCompanies #Economy #VisualCapitalist #BusinessGrowth
4
Ranked:💁♂️📝🔢🔦
Jobs With the Highest and Lowest Divorce Rates:
💍💎🔥💀🔥💀🔥💀🔥💎💍
(Source: VisualCapitalist)
📸 🏦🏡💰🏴☠️💍

9
469

Jun 6
The Most Prayerful
Countries in the world:
🇮🇩 Indonesia — 95%
🇰🇪 Kenya — 84%
🇳🇬 Nigeria — 84%
🇲🇾 Malaysia — 80%
🇵🇭 Philippines — 79%
🇧🇷 Brazil — 76%
🇧🇩 Bangladesh — 75%
🇬🇭 Ghana — 73%
🇱🇰 Sri Lanka — 72%
🇨🇴 Colombia — 71%
🇮🇳 India — 71%
🇿🇦 South Africa — 63%
🇹🇷 Türkiye — 63%
🇵🇪 Peru — 58%
🇲🇽 Mexico — 57%
🇨🇱 Chile — 57%
🇦🇷 Argentina — 56%
🇺🇸 United States — 44%
🇵🇱 Poland — 42%
🇸🇬 Singapore — 45%
🇮🇹 Italy — 41%
🇵🇹 Portugal — 40%
🇬🇷 Greece — 39%
🇨🇦 Canada — 25%
🇦🇺 Australia — 24%
🇫🇷 France — 18%
🇬🇧 United Kingdom — 17%
🇩🇪 Germany — 16%
🇭🇺 Hungary — 11%
🇸🇪 Sweden — 8%
(Source - visualcapitalist)
1
3
8
816
Jun 5
The Most Prayerful
Countries in the world:
🇮🇩 Indonesia — 95%
🇰🇪 Kenya — 84%
🇳🇬 Nigeria — 84%
🇲🇾 Malaysia — 80%
🇵🇭 Philippines — 79%
🇧🇷 Brazil — 76%
🇧🇩 Bangladesh — 75%
🇬🇭 Ghana — 73%
🇱🇰 Sri Lanka — 72%
🇨🇴 Colombia — 71%
🇮🇳 India — 71%
🇿🇦 South Africa — 63%
🇹🇷 Türkiye — 63%
🇵🇪 Peru — 58%
🇲🇽 Mexico — 57%
🇨🇱 Chile — 57%
🇦🇷 Argentina — 56%
🇺🇸 United States — 44%
🇵🇱 Poland — 42%
🇸🇬 Singapore — 45%
🇮🇹 Italy — 41%
🇵🇹 Portugal — 40%
🇬🇷 Greece — 39%
🇨🇦 Canada — 25%
🇦🇺 Australia — 24%
🇫🇷 France — 18%
🇬🇧 United Kingdom — 17%
🇩🇪 Germany — 16%
🇭🇺 Hungary — 11%
🇸🇪 Sweden — 8%
(Source - visualcapitalist)
1
10
1,605

Wow, electricity prices are falling here in Florida @visualcapitalist

6
5
21
2,982

May 25
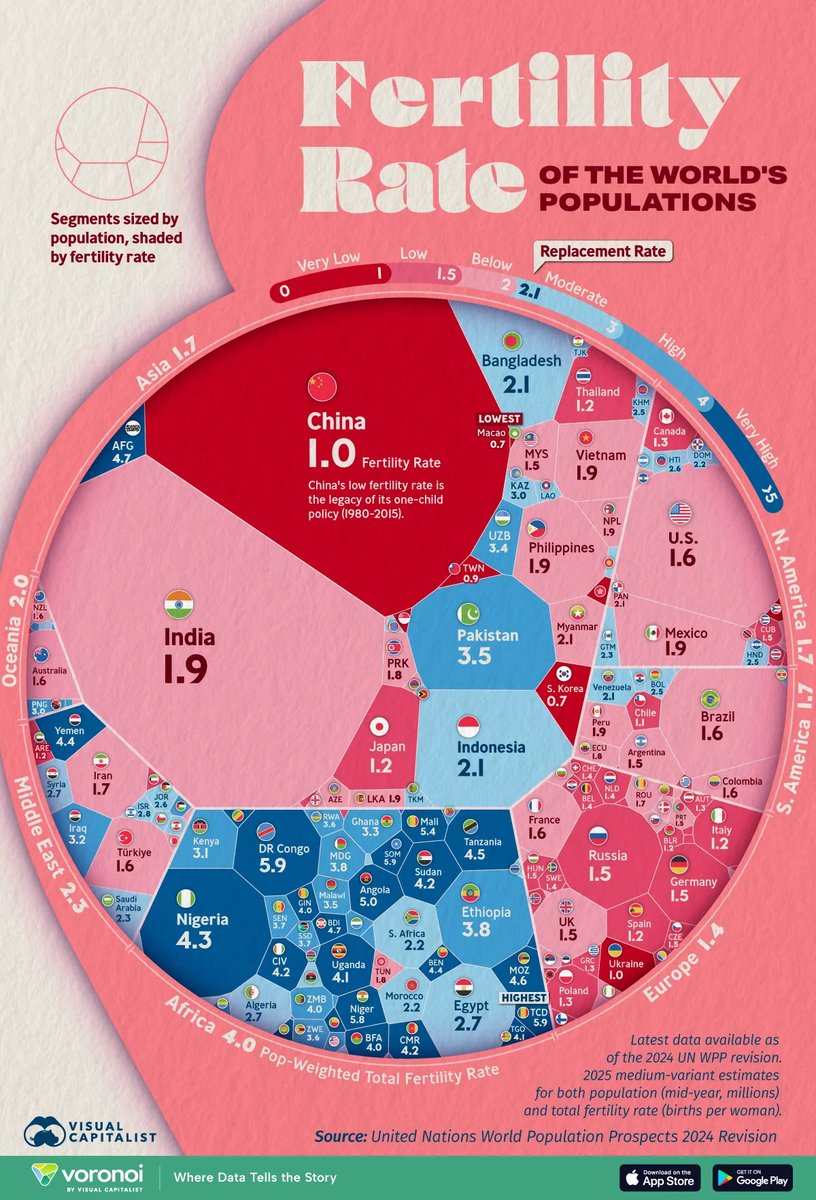
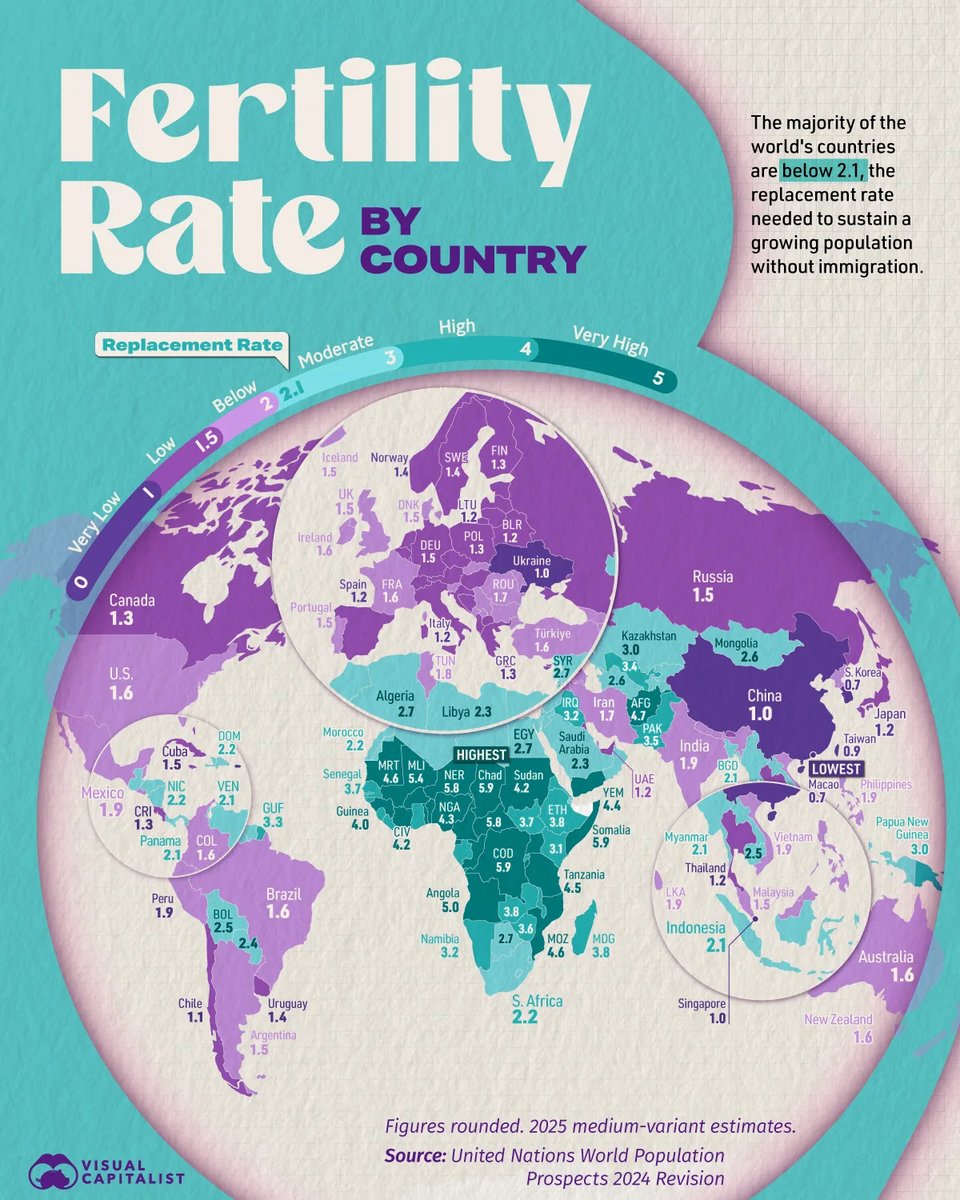
China is hurtling toward a demographic dead end that strikes directly at the foundation of its economic power: the collapse of its human workforce.
The stark global visualization from Visual Capitalist reveals the devastating footprint of Beijing's demographic policies, showing China's fertility rate has cratered to a disastrous 1.0. This is less than half of the 2.1 replacement rate required just to keep a population stable. While neighboring India stands at 1.9 and Nigeria soars at 4.3, China's core working-age demographic is completely evaporating.
Despite heavy state messaging surrounding factory automation, the reality is that the Chinese manufacturing machine still relies heavily on human labor. Mass-export pillars like textiles, apparel, and intricate manual assembly remain deeply dependent on a workforce of over 100 million human migrant workers because many flexible, dexterous tasks cannot be efficiently handled by machines.
#UnveiledChina #DemographicCrisis #ChinaEconomy #LaborShortage #Manufacturing #PopulationDecline #VisualCapitalist
4
19
68
9,167

May 18
Какой алкоголь предпочитают белорусы
Проект Visualcapitalist поделился глобальной инфографикой о мировых алкогольных предпочтениях. Она основана на данных Всемирной организации здравоохранения:
qnl9lx-c97-org.cdn.ampprojec…

1
2
317
May 11
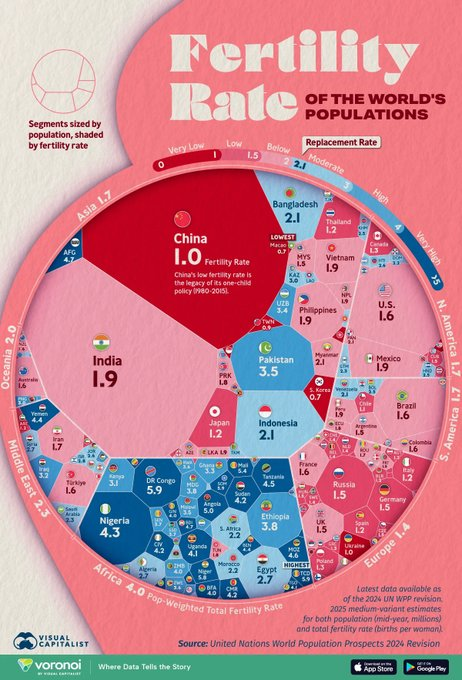
📊 INFOGRAFIA | Tasa de fertilidad de cada país en el mundo.
👉 71% de la población vive en países con una tasa de fecundidad inferior a la de reemplazo (2,1 nacimientos por mujer).
..
vía VisualCapitalist
#economia #fertilidad #gestiondeportiva
3
75