
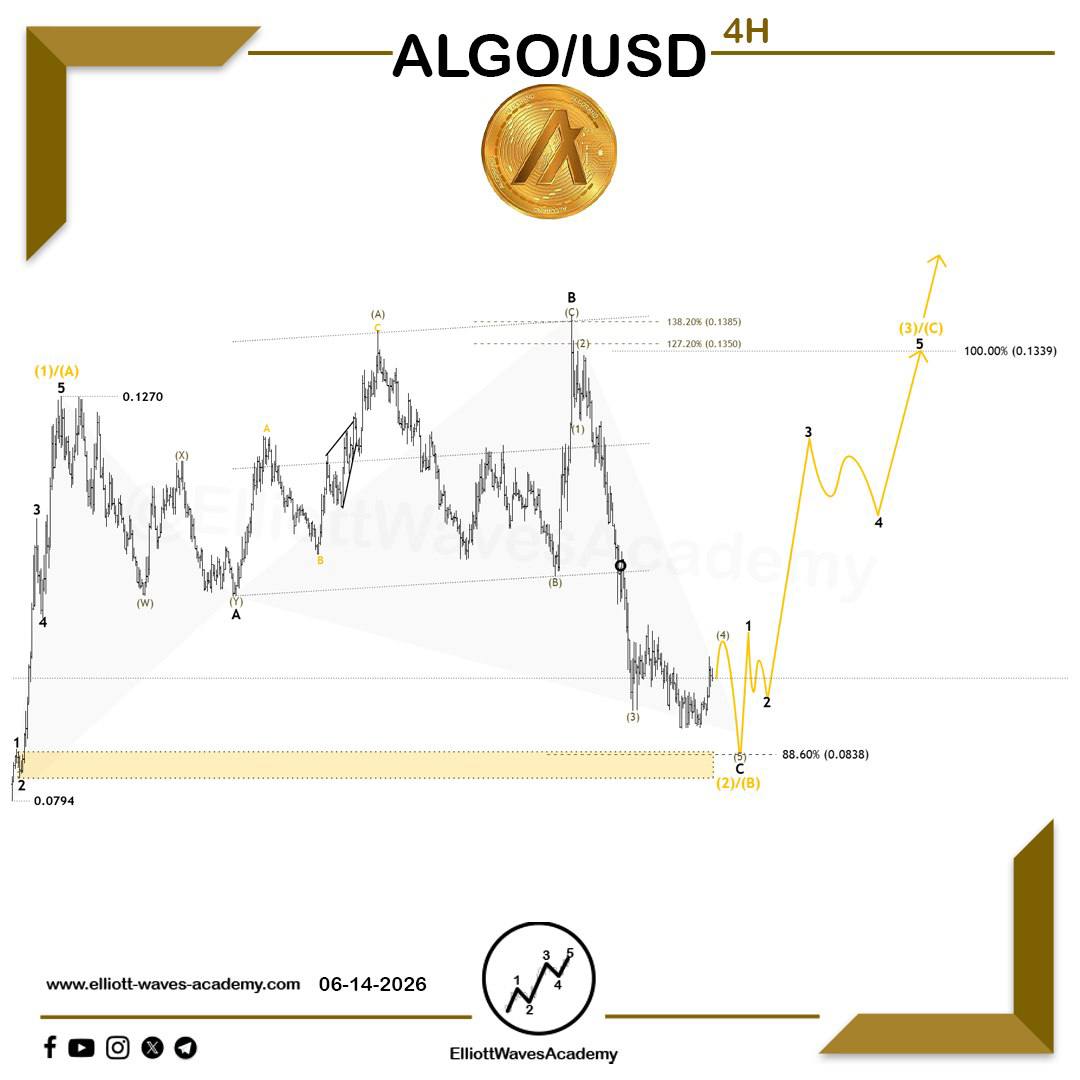
Follow-Up on the Expected Path for the Cryptocurrency #ALGOUSD 🇺🇸 on the 4-Hour Timeframe
Potential Reversal
A closer examination 🧐 of the pair’s wave movements shows that it remains under strong selling pressure from the bears 🐻, as a key level has been decisively broken 🔨, further reinforcing the bearish outlook.
Based on this structure, we can expect one final decline through Wave (5) within Wave C of Wave (2)/(B). This move could potentially drive the price toward the highlighted demand zone, which may represent a reversal area and the first spark of a potential bullish move ahead. 📉
In addition, this decline aligns with the projected targets of a harmonic Shark pattern, which further strengthens the outlook for a bullish wave afterward.
Our Daily Premium Analysis 👉 : elliottwavesacademy.gumroad.……
For Our Educational Program Analysis 👉 :
elliott-waves-academy.com/pr……
#elliottwave #tradingview #technicalanalysis #swingtrading #waveanalysis #BTCUSD #cryptocurrencies #btctrading #forexdubai #forexeurope #forexuk #ETHUSD #tradingstrategies #priceactiontrader #ethereumtrading #ethereuminvestment #ethereumprice #bitcoinsignals #priceactiontrading #forexmalaysia #forexespanol #forexfrance #tradingacademy #forexaustralia #bitcointrading #Dogecoin #LINKUSDT

1
96
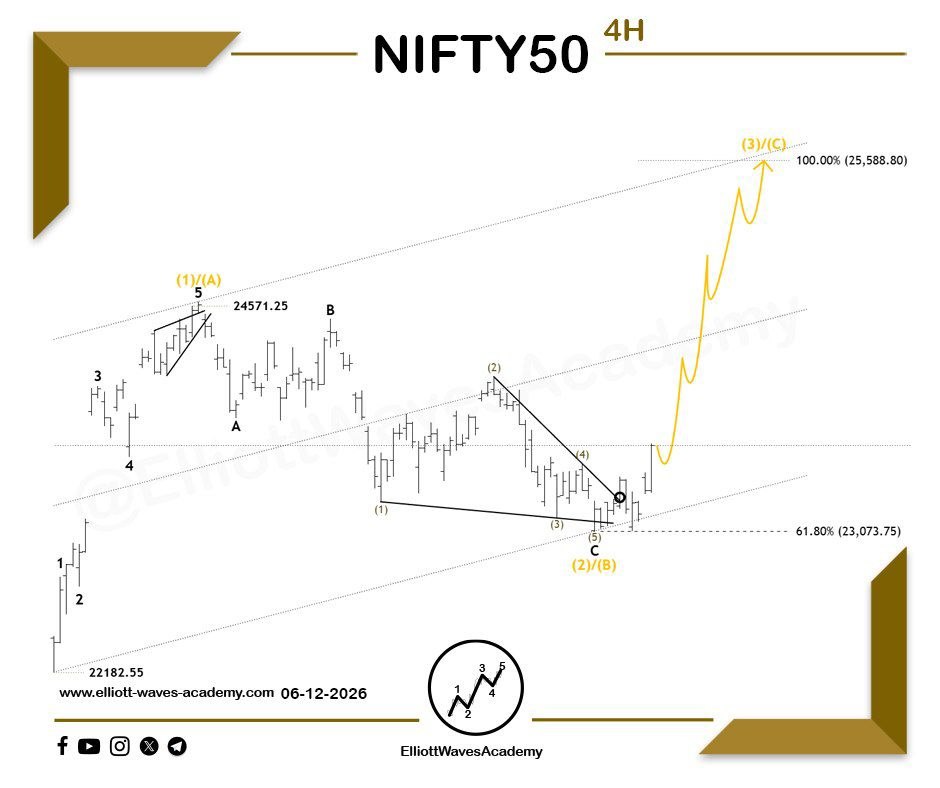
Wave Outlook for the Indian Index #NIFTY50 🇮🇳 on the 4-Hour Timeframe
Continued Bullish Momentum 🚀
🐂 The bulls appear to have successfully broken above a key level related to the corrective sub-wave 💪, signaling buyers’ intention to push the price higher 📈 through the sub-waves of Wave (3)/(C) 🌊
The price is expected to continue moving upward ⬆️ after forming a new high 🔝, with the ideal target located around 25588.80 🌟. The bullish move could extend even further in the event of a breakout above the upper boundary of the price channel 📊.
Our Daily Premium Analysis 👉 : elliottwavesacademy.gumroad.……
For Our Educational Program 👉 :
elliott-waves-academy.com/pr……
#dowjones #eurusd #us30trading #elliottwave #waveanalysis #tradingview #technicalanalysis #swingtrading #dax30 #Dowjones #NASDAQ #nasdaqtrading #US30 #dowjonestrading #dowjonessignals #nikkei225 #ibex35 #UK100 #priceactiontrading #priceactiontrader #priceactiontrading #priceaction #priceactionstrategy #tradingschool #tradingacademy #tradingstrategies #us30
8
6
56
6,920
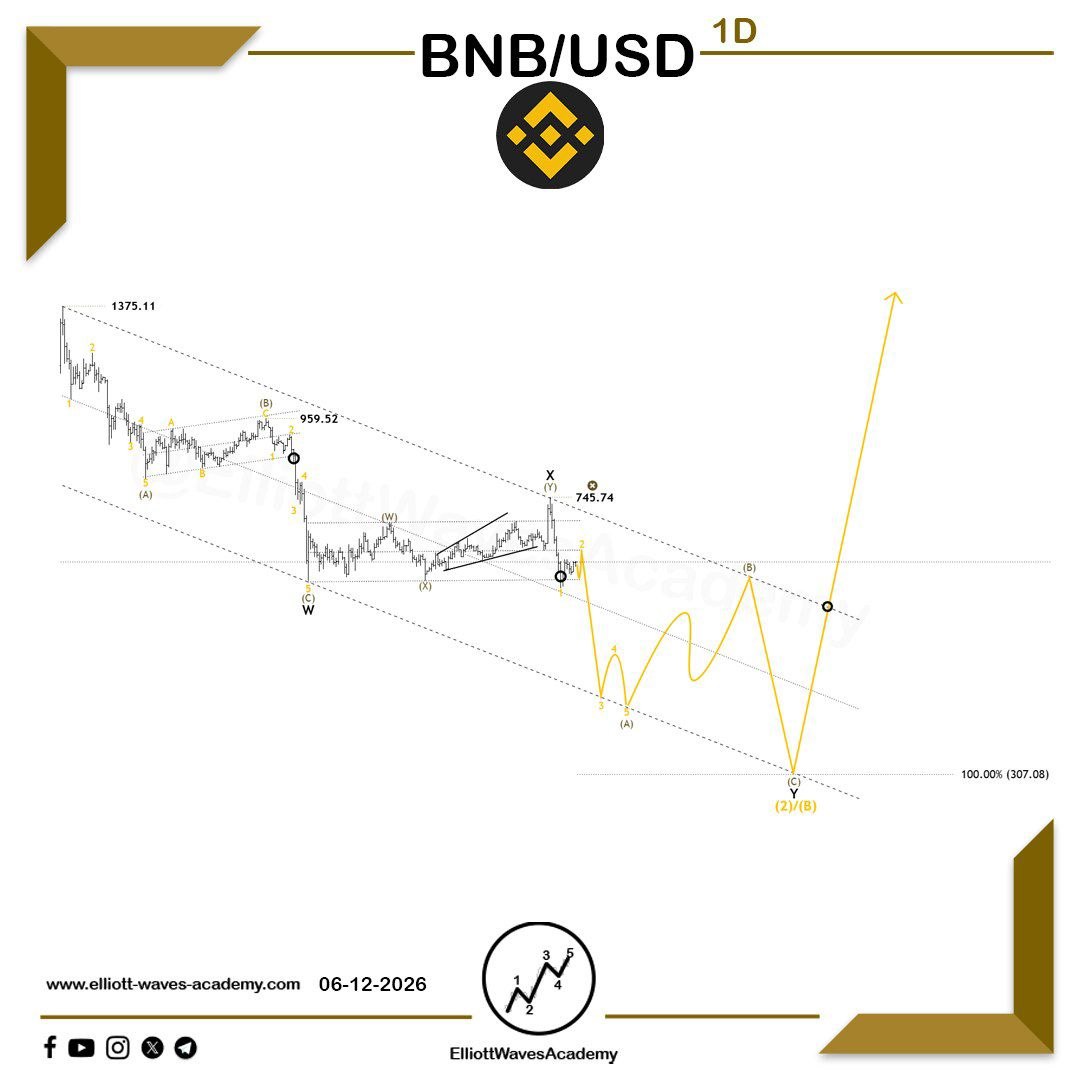
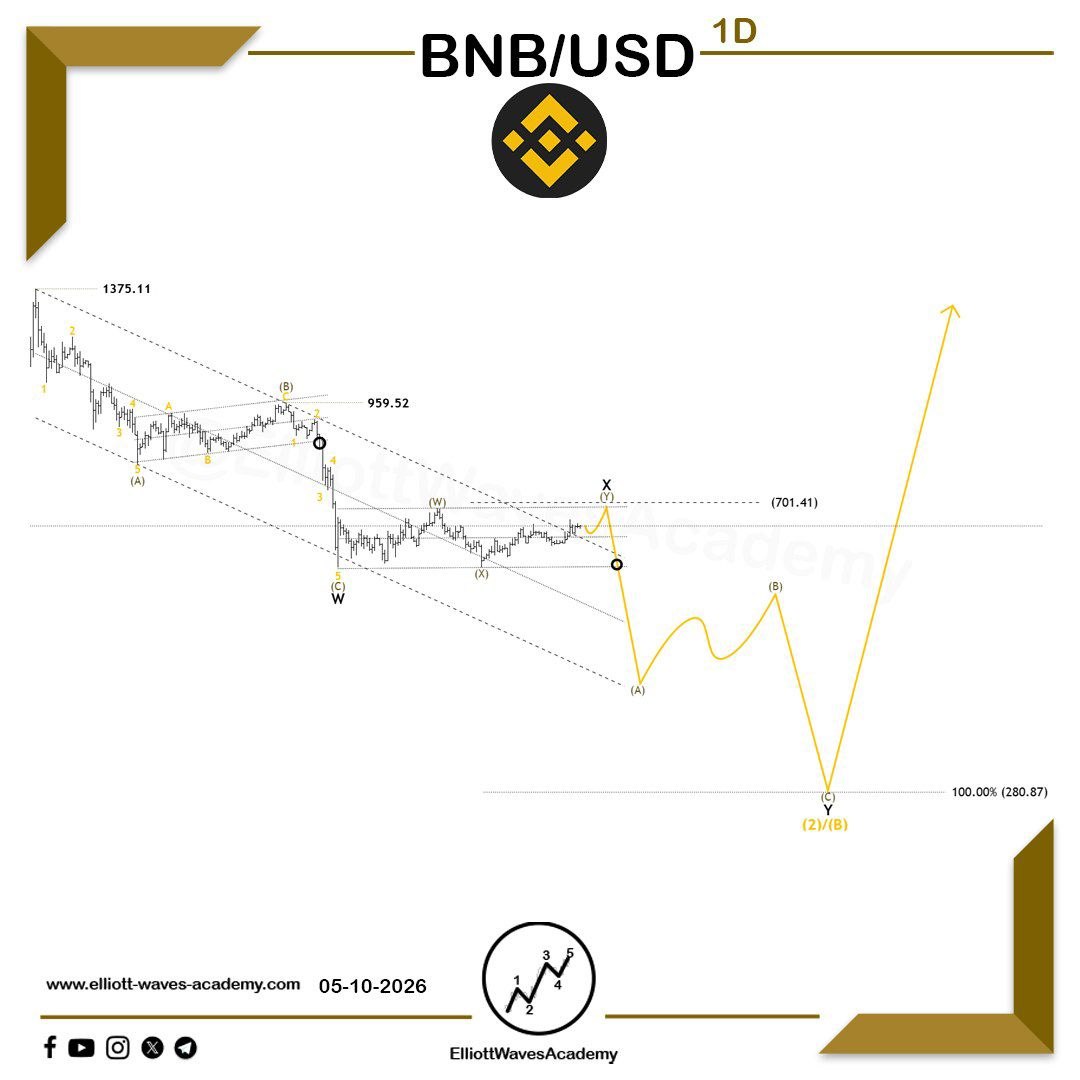
Follow-Up on the Expected Outlook for the Cryptocurrency #BNBUSD 🇺🇸 on the Daily Timeframe
Selling Pressure 🐻
A closer examination 🧐 of the pair’s wave movements shows that it is currently under strong selling pressure from the bears 🐻, as a key level related to the latest wave structure has been broken 🔨, reinforcing bearish control over the market.
Based on this outlook, we can expect further downside through the sub-waves of Wave Y, which could potentially drive the price toward the 100% extension of the previous wave, forming a new low and ideally reaching the 307.08 level. 📉
Price action should then be reassessed once this scenario is achieved.
Our Daily Premium Analysis 👉 : elliottwavesacademy.gumroad.……
For Our Educational Program Analysis 👉 :
elliott-waves-academy.com/pr……
#elliottwave #tradingview #technicalanalysis #swingtrading #waveanalysis #BTCUSD #cryptocurrencies #btctrading #forexdubai #forexeurope #forexuk #ETHUSD #tradingstrategies #priceactiontrader #ethereumtrading #ethereuminvestment #ethereumprice #bitcoinsignals #priceactiontrading #forexmalaysia #forexespanol #forexfrance #tradingacademy #forexaustralia #bitcointrading #Dogecoin #BNBUSDT
3
16
1,543

Jun 12
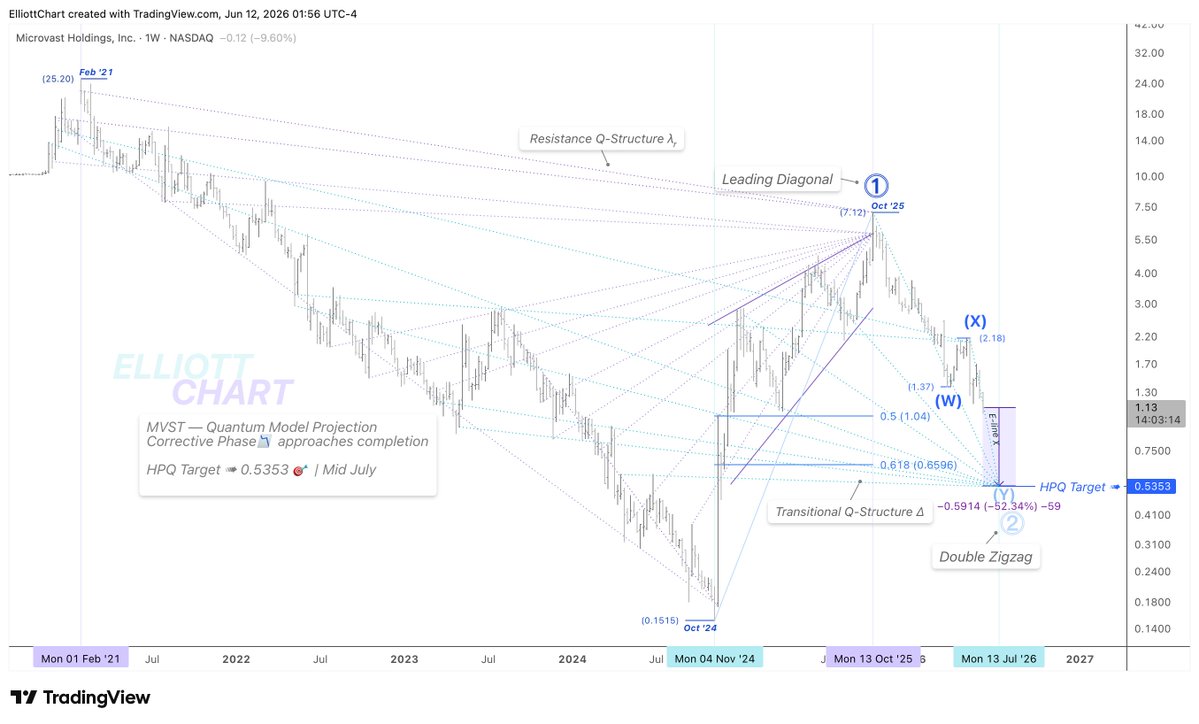
$MVST — Quan-Model Projection
Bullish Outlook | Corrective Phase📉 Approaching Completion
MVST remains one of the clearest Quan-Structural weekly charts within my framework. And strategically, I think this is the perfect time to share my perspective on Microvast's analysis and its evolving structure.
The corrective phase has developed directly from the extreme high at ➤ $7.12✨precisely identified in the October 18 analysis as the termination point of a Leading Diagonal in Intermediate Wave ⓵.
The correction now appears to be in its final stage, continuing its decline along Support E-line χ through Intermediate Wave (Y) toward the next retracement level at ➤ 0.618.
The converging transitional Q-Structure Δ provides firm support at its confluence zone, projecting an HPQ Target of ➤ $0.53 🎯, aligned with the July 13 timeline and reflecting the projected depth of the market's corrective phase.
🔖 Outlook is derived from insights within the Quantum Models framework. Within this methodology, Q-targets are high-probability projections generated by the convergence of equivalence lines. These Quantum Structures also serve as structural anchors, shaping the model’s internal geometry and guiding the evolution of alternative paths as price action unfolds.
#MVST #Microvast #QuanModel #QuanStructures #WaveAnalysis #MarketStructure #TechnicalAnalysis #StockMarket #Investing #BatteryTechnology #EnergyStorage #ElectricVehicles #CleanEnergy #EnergyTransition #EV
19 Oct 2025

$MVST — 📈Wave|Trend Analysis
Bearish Alt. Scenario ( Near-term | Medium-term )
Based on this Quantum model of possibility, the rising tide since early November may have potentially formed a Leading Diagonal as Primary Wave ⓵.
$MicrovastHoldingInc closed the week right at the apex of the equivalence lines from the prior downtrend — a key confluence zone within my technical framework, marking a potentially pivotal zone to monitor for either a reversal confirmation or a rejection.
🔖 Should the reversal be confirmed, I’ll provide a more comprehensive breakdown of the structure.
#TechnicalAnalysis #ElliottWave #TrendAnalysis #WaveAnalysis #Charting #FibLevels #PriceAction #StocksToWatch #SmallCaps
#BreakoutStocks #StockMarket #Investing
#EnergyStorage #EVBatteries #GreenTech #CleanEnergy #ElectricVehicles #BatteryTech #BatteryStocks #EVStocks #Microvast #MVST

1
14
1,932
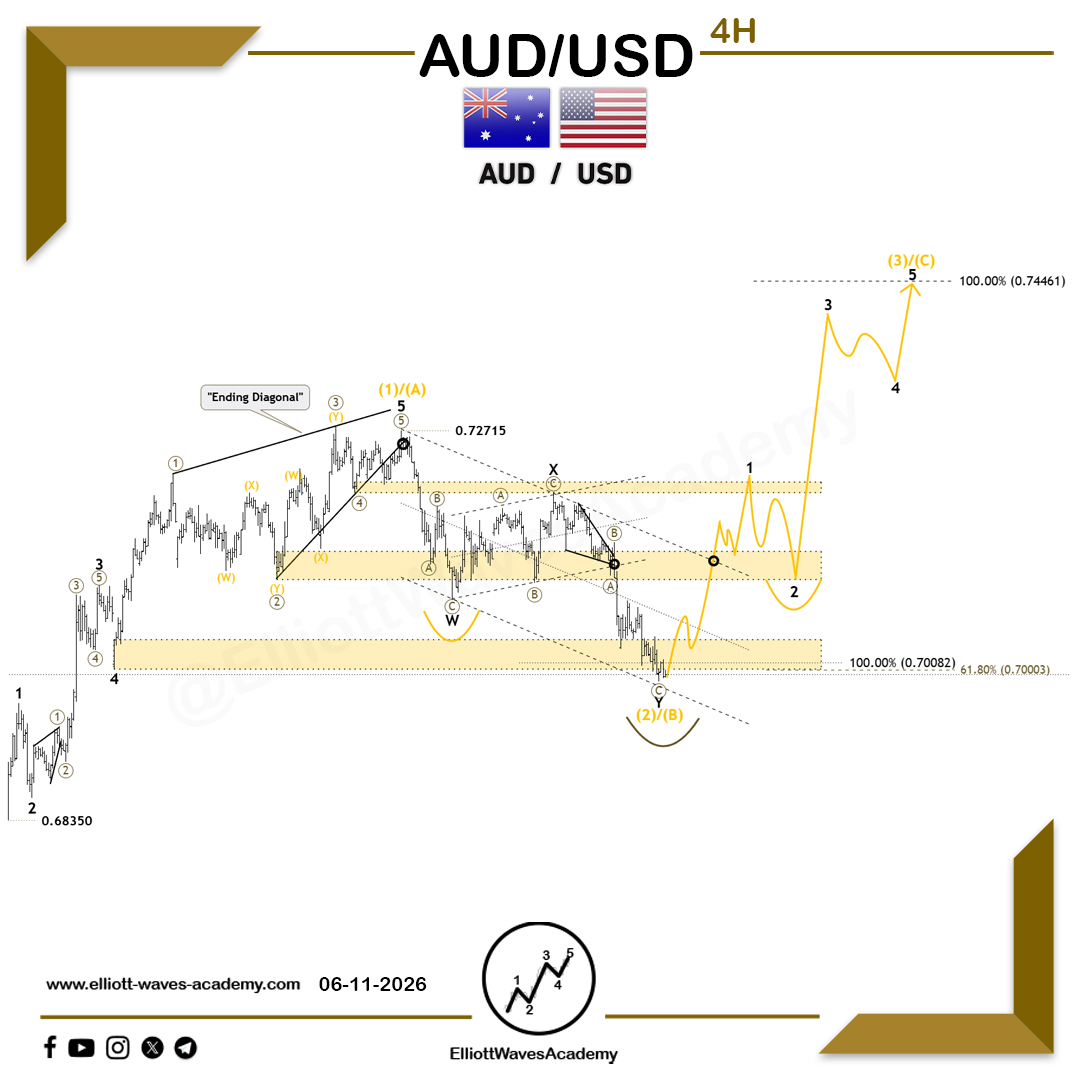
#AUDUSD 🇦🇺/🇺🇸 Follow-Up on the Expected Wave Outlook for the Currency Pair on the 4-Hour Timeframe
✨ Imminent Bullish Move ⚡️
The Current Structure:
* Wave (1)/(A) formed as an impulsive structure, with the final wave ending in a leading diagonal pattern. 📈
* A bearish corrective wave formed as a double zigzag pattern, representing Wave (2)/(B). 🔽
* The correction retraced ideally and successfully retested the price channel. 📉
* The price has reached the Wave 4 territory in addition to the 61.8% Fibonacci retracement of the previous wave.
Expectations:
* A strong formation of Wave 1 within a new bullish structure is expected, providing momentum for Wave 3 to break above the price channel and form a new high. 🚀
* If the scenario unfolds as expected, the ideal bullish target would be the 0.74461 level. 🎯
⚠️ A close below the lower boundary of the price channel would weaken this bullish scenario.
...To analyze our educational program 👉:
elliott-waves-academy.com/pr…
#EURUSD #ElliottWaves #PriceActionTrading #PriceAction #PriceActionStrategy #CurrencyTrading #TechnicalAnalysis #TradingForLives #TradingAcademy #TradingStrategies #TradingProfits #TradingExpert #TradingForLives #ForexSchool #ForexAsia #ForexDubai #ForexEurope #ForexUK #ForexMalaysia #ForexAustralia #ForexSpain #ForexFrance #ForexJapan #ElliottWaves #WaveAnalysis #GoldTrading #PriceActionTrading #XAUUSD #DowJones #ForexUK

9
1,238
#GBPJPY 🇬🇧/🇯🇵 Wave Outlook on the 30-Minute Timeframe
🔥 Further Upside with Potential Resistance Ahead ⚡️
💥 The pair appears to be moving within a bullish structure that signals continued upside momentum. It is clear that the corrective wave has already been completed, and price is now trading within Wave 5 of Wave (1)/(A), reinforcing the bullish outlook. Based on this structure, we expect 👉
✨ Completion of the internal structure of this wave
✨ The ideal target zone lies between 215.103 – 215.546, representing the first and second targets, with the possibility of further upside in the event of a strong breakout above the upper boundary of the price channel through an extension of Wave 5.
⚡️ The pair may encounter a strong resistance zone, which could influence price direction during the upcoming period.
...To analyze our educational program 👉:
elliott-waves-academy.com/pr…
#EURUSD #ElliottWaves #PriceActionTrading #PriceAction #PriceActionStrategy #CurrencyTrading #TechnicalAnalysis #TradingForLives #TradingAcademy #TradingStrategies #TradingProfits #TradingExpert #TradingForLives #ForexSchool #ForexAsia #ForexDubai #ForexEurope #ForexUK #ForexMalaysia #ForexAustralia #ForexSpain #ForexFrance #ForexJapan #ElliottWaves #WaveAnalysis #GoldTrading #PriceActionTrading #XAUUSD #DowJones #ForexUK

1
6
1,062
Expected Path for the Cryptocurrency #ETCUSD 🇺🇸 on the 4-Hour Timeframe
Corrective Move Expected 📉
🧐 Bearish momentum appears to be fading somewhat, as the pair may have completed the structure of the impulsive wave representing Wave 3 within a larger-degree impulsive structure. 👌
⏫ Based on this outlook, a corrective upward move is expected through the formation of Wave 4, which could develop in any corrective pattern. Since Wave 2 formed as a deep double zigzag correction, Wave 4 is more likely to take the shape of a sideways structure such as a triangle or flat pattern. 📐
👀 In any case, the 38.2%–50% Fibonacci levels represent the expected zones for this correction. Afterward, if bearish continuation is confirmed, the levels illustrated on the chart would represent potential targets for the next wave movement. 🎯
Our Daily Premium Analysis 👉 : elliottwavesacademy.gumroad.……
For Our Educational Program Analysis 👉 :
elliott-waves-academy.com/pr……
#elliottwave #tradingview #technicalanalysis #swingtrading #waveanalysis #BTCUSD #cryptocurrencies #btctrading #forexdubai #forexeurope #forexuk #ETHUSD #tradingstrategies #priceactiontrader #ethereumtrading #ethereuminvestment #ethereumprice #bitcoinsignals #priceactiontrading #forexmalaysia #forexespanol #forexfrance #tradingacademy #forexaustralia #bitcointrading #Dogecoin #ETCUSDT

2
19
2,156
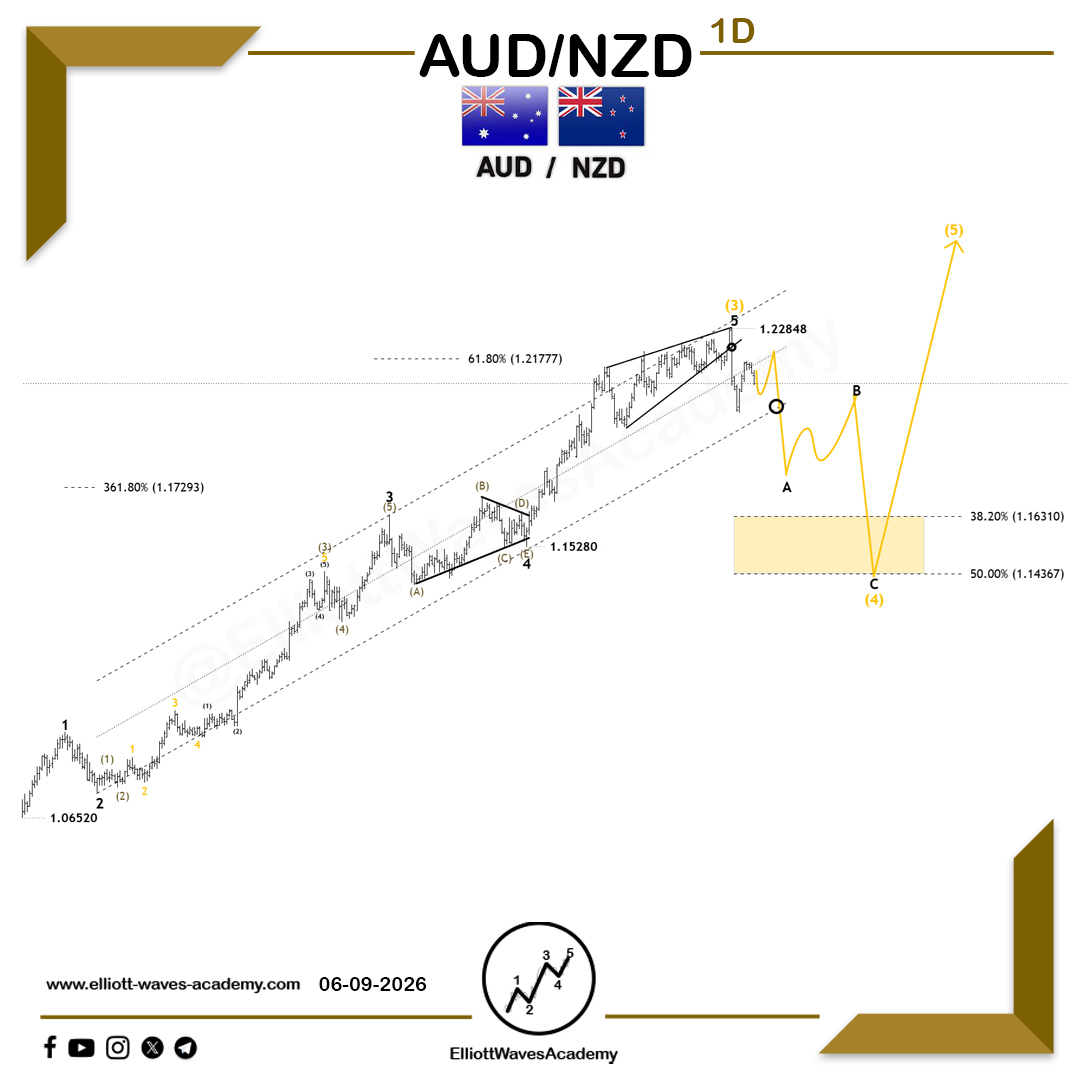
#AUDNZD 🇦🇺/🇳🇿 Follow-Up on the Expected Outlook for the Currency Pair on the Daily Timeframe
Wave 4 Currently in Formation
The price appears to be preparing for a strong bullish move following a decisive breakout above the price channel! 💥 The market successfully formed the structure of an impulsive wave that ended with a diagonal pattern as the final leg of the impulse, signaling the completion of Wave 3, which forms the backbone of the current bullish trend. 📈
💡 We are now entering the anticipated Wave 4 phase, which follows the sharp rally of Wave 3. Given the aggressive nature of the previous Wave 2 correction, Wave 4 is likely to develop in a calmer manner, potentially moving sideways or forming a corrective triangle pattern. This corrective structure reflects temporary market balance before preparing for another bullish advance! 💥
🎯 If the key level of the corrective pattern is broken to the upside, the next bullish wave could move toward forming a new high, signaling major upside potential for bullish traders! 🐂
...To analyze our educational program 👉:
elliott-waves-academy.com/pr…
#EURUSD #ElliottWaves #PriceActionTrading #PriceAction #PriceActionStrategy #CurrencyTrading #TechnicalAnalysis #TradingForLives #TradingAcademy #TradingStrategies #TradingProfits #TradingExpert #TradingForLives #ForexSchool #ForexAsia #ForexDubai #ForexEurope #ForexUK #ForexMalaysia #ForexAustralia #ForexSpain #ForexFrance #ForexJapan #ElliottWaves #WaveAnalysis #GoldTrading #PriceActionTrading #XAUUSD #DowJones #ForexUK

8
1,090
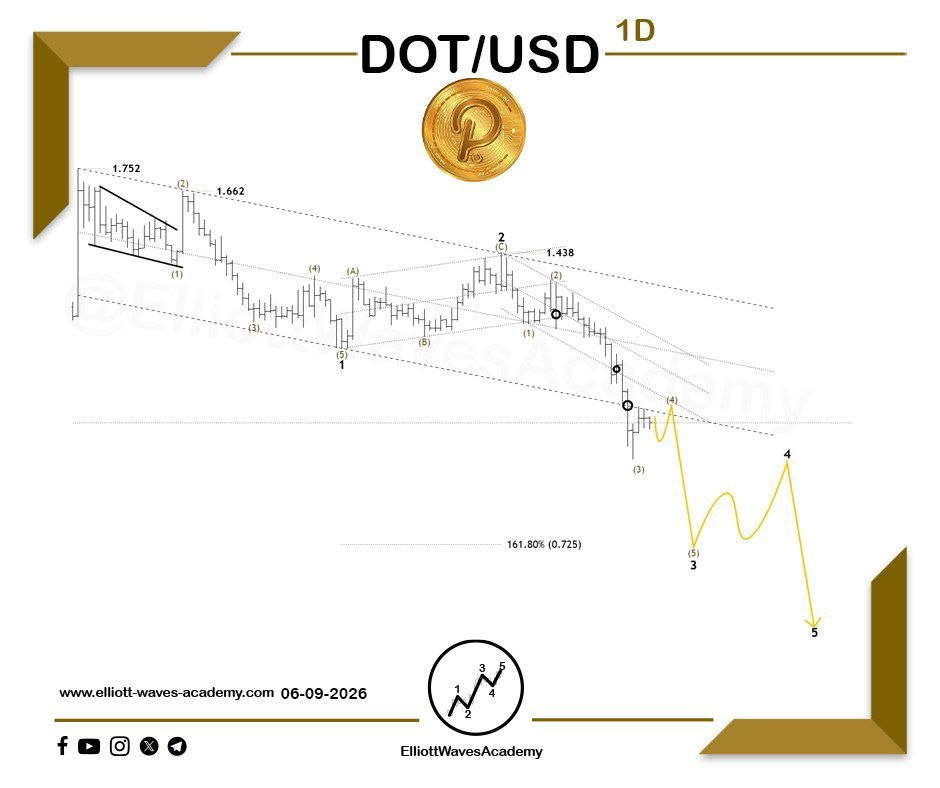
🔥 #Polkadot (#DOTUSD) 🇺🇸 Expected Path for the Cryptocurrency on the Daily Timeframe 🔥
🐻 Bears in Control
👌 The bearish outlook continues to dominate the pair’s direction, as we have already witnessed a strong decline through the sub-waves of Wave (3) within a bearish impulsive structure. This wave may represent Wave (5) within a larger bearish impulse, targeting the 161.8% extension level as one of the key objectives for Wave 3 and an important support zone.
📉 If no reversal appears at this level, the decline could extend further through the sub-waves of Wave 5, signaling continued selling pressure over the medium term.
⏳ In the short term, we may see the formation of Wave 4, which is likely to develop into a corrective structure such as a sideways pattern (triangle or flat). A break below a key level would confirm the continuation of the bearish trend. 🔑
📊 Monitoring price action developments remains essential to identify the next potential moves!
Our Daily Premium Analysis 👉 : elliottwavesacademy.gumroad.……
For Our Educational Program Analysis 👉 :
elliott-waves-academy.com/pr……
#elliottwave #tradingview #technicalanalysis #swingtrading #waveanalysis #BTCUSD #cryptocurrencies #btctrading #forexdubai #forexeurope #forexuk #ETHUSD #tradingstrategies #priceactiontrader #ethereumtrading #ethereuminvestment #ethereumprice #bitcoinsignals #priceactiontrading #forexmalaysia #forexespanol #forexfrance #tradingacademy #forexaustralia #bitcointrading #Dogecoin #DOTUSDT
9
61
1,487
Wave Outlook for #INTC 🇺🇸 on the 4-Hour Timeframe 🌟
Bullish Momentum on the Horizon 🔥
🏹 The price has witnessed a notable rally, forming the structure of Wave 3 within a higher-degree impulsive wave.
Now that Wave 3 and part of Wave 4 appear to be completed, we expect the following:
1. The completion of a corrective pattern representing Wave 4 of the current bullish movement. 🔀
2. A possibility that Wave 4 develops into a sideways corrective structure, given the sharp nature of Wave 2. 🔃
3. A breakout above a key level to confirm the bullish outlook and the continuation of the positive trend. 🔑
4. Potential upside targets for the next bullish wave, as illustrated on the chart. 💸💸
For Our Daily Premium Analysis 👉 : elliottwavesacademy.gumroad.……
For Our Educational Program 👉 :
elliott-waves-academy.com/pr……
#us30trading #elliottwave #waveanalysis #tradingview #technicalanalysis #swingtrading #dax30 #Dowjones #sp500 #stockstobuy #nasdaqtrading #US30 #dowjonestrading #dowjonessignals #nikkei225 #UK100 #priceactiontrading #priceactiontrader #priceactiontrading #priceaction #priceactionstrategy #tradingschool #tradingacademy #tradingstrategies #stockstrading

9
1,384
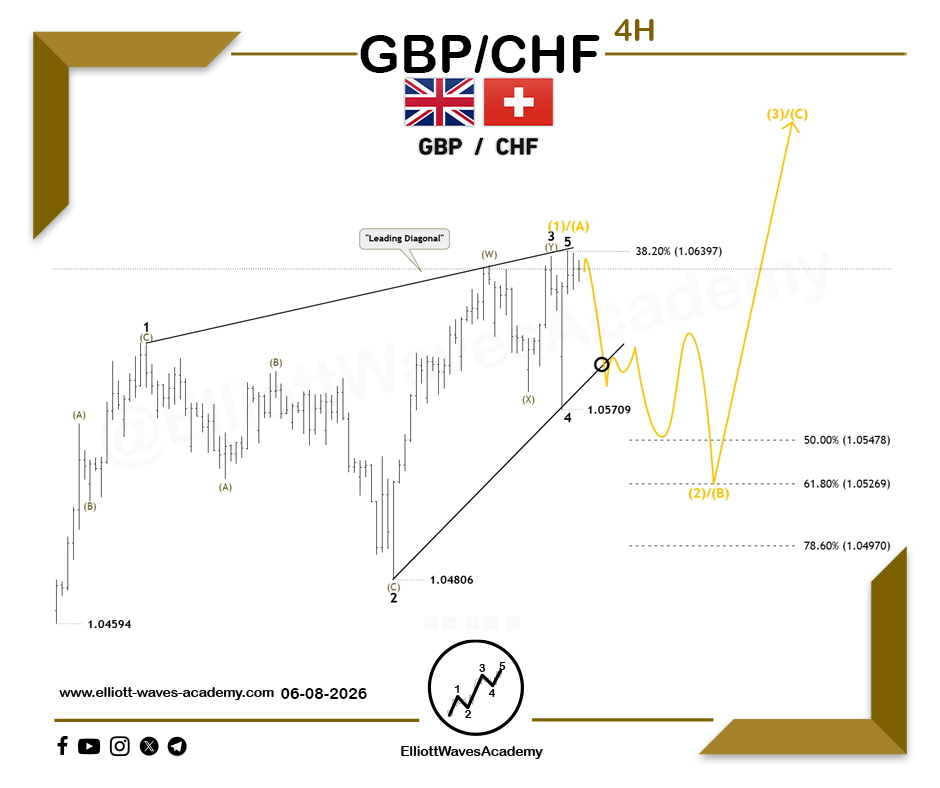
#GBPCHF 🇬🇧/🇨🇭 | 📊 Expected Wave Outlook on the 4-Hour Timeframe
A Decline Followed by a Rally! 🚀
One of the proposed scenarios suggests the formation of an impulsive wave within a contracting diagonal pattern, representing Wave (1)/(A). 📈
We expect a corrective decline targeting common retracement zones, which align with the 50%–78.60% Fibonacci retracement levels of the previous wave. 📊
If reversal signals emerge from these areas, it could serve as a positive indication supporting the bullish scenario! 🌟 In addition, a breakout above a key level may further confirm this outlook. 🔑
Bullish Wave Targets: The expected upward wave aims to achieve at least a new high and, ideally, reach the 100% extension of Wave (1)/(A)! 🏆
...To analyze our educational program 👉:
elliott-waves-academy.com/pr…
#EURUSD #ElliottWaves #PriceActionTrading #PriceAction #PriceActionStrategy #CurrencyTrading #TechnicalAnalysis #TradingForLives #TradingAcademy #TradingStrategies #TradingProfits #TradingExpert #TradingForLives #ForexSchool #ForexAsia #ForexDubai #ForexEurope #ForexUK #ForexMalaysia #ForexAustralia #ForexSpain #ForexFrance #ForexJapan #ElliottWaves #WaveAnalysis #GoldTrading #PriceActionTrading #XAUUSD #DowJones #ForexUK
1
10
1,400
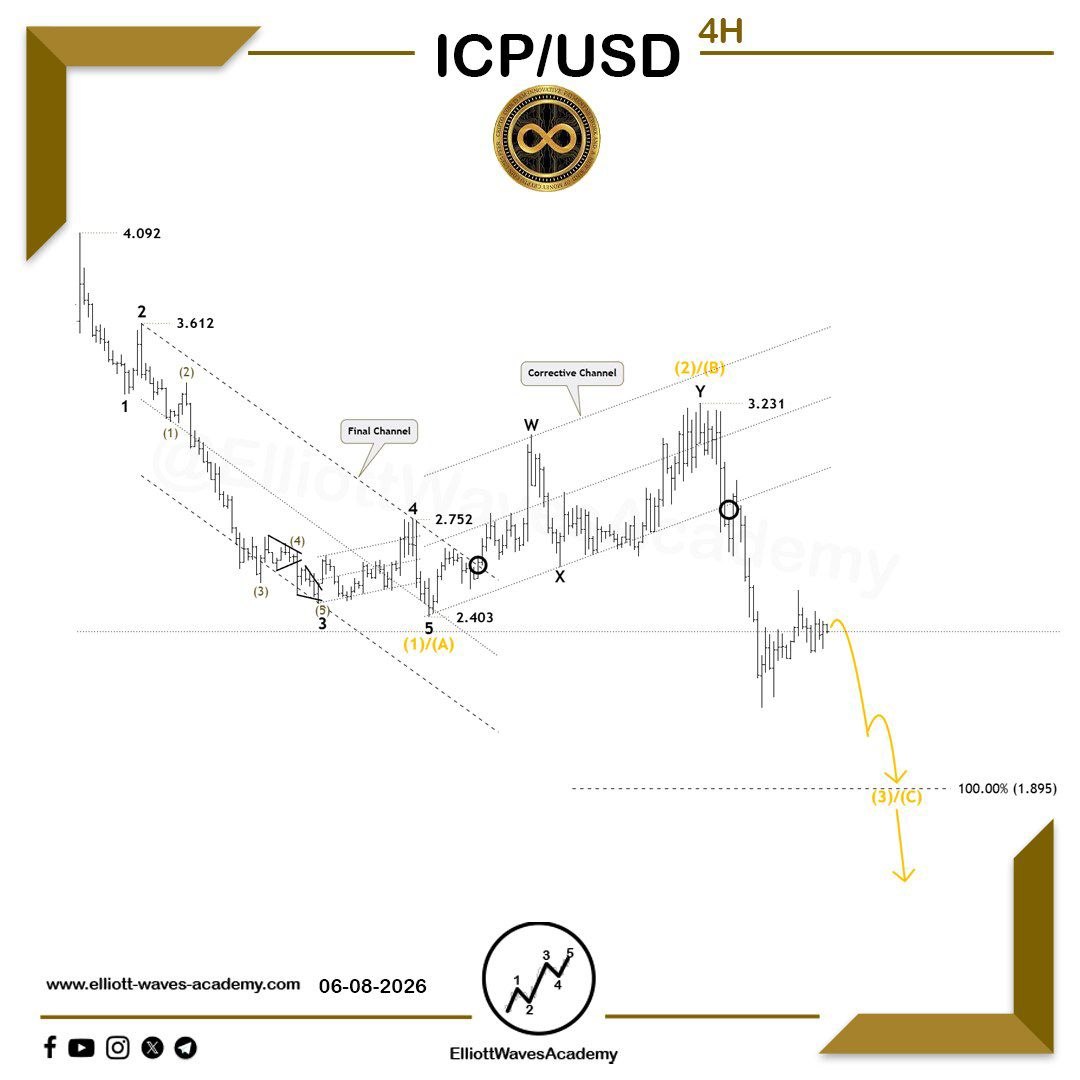
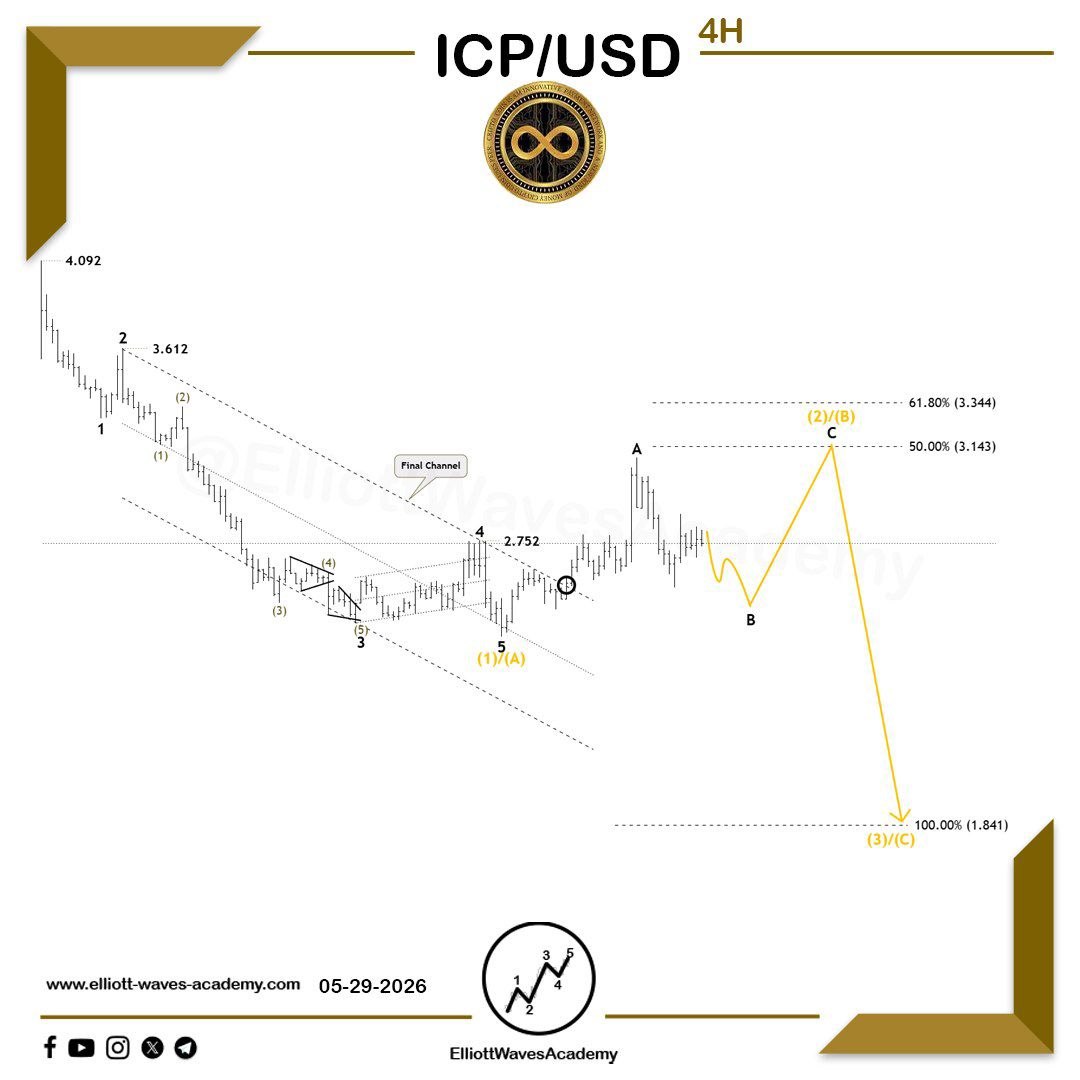
Follow-up on the expected path of the cryptocurrency #ICPUSD 🇺🇸 on the 4-hour timeframe
Recovery or Further Decline? 🤔
〽️ After the series of declines witnessed through the sub-waves of a bearish structure, this downward move may be nearing completion — at least in the short term — with a potential recovery on the horizon. The price is approaching the ideal target of Wave (C)/(3), and a strong reversal through an impulsive wave would reinforce the recovery outlook. 📈
🏹 A breakout above a key level of the bearish wave structure could trigger a bullish move, potentially pushing the price to form a new high above 4.092 🚀
⚠️ On the other hand, the 1.895 level remains extremely important for maintaining the recovery outlook. A break below this level could lead to further downside through an extension of the bearish waves. 🚨
Our Daily Premium Analysis 👉 : elliottwavesacademy.gumroad.……
For Our Educational Program Analysis 👉 :
elliott-waves-academy.com/pr……
#elliottwave #tradingview #technicalanalysis #swingtrading #waveanalysis #BTCUSD #cryptocurrencies #btctrading #forexdubai #forexeurope #forexuk #ETHUSD #tradingstrategies #priceactiontrader #ethereumtrading #ethereuminvestment #ethereumprice #bitcoinsignals #priceactiontrading #forexmalaysia #forexespanol #forexfrance #tradingacademy #forexaustralia #bitcointrading #Dogecoin #ICPUSDT
2
11
1,357

Jun 8
#IDEA is showing classic Elliott Wave strength and appears to be moving into Wave (iii) of the 3rd wave — often considered the most powerful phase of an uptrend.
The bigger story? The stock has broken above an 11-year trendline resistance, a level that kept price capped for more than a decade. Such long-term breakouts are rarely random and often signal a major shift in market sentiment.
As long as the breakout holds, the path of least resistance remains upward. When a stock spends years building energy, the eventual move can surprise even the strongest bears.
#IDEA #VodafoneIdea #ElliottWave #WaveAnalysis #TechnicalAnalysis #PriceAction #StockMarket #IndianStocks #ChartAnalysis #SwingTrading #Investing #Trading #BreakoutStocks #NSE #BSE

4
2
14
725
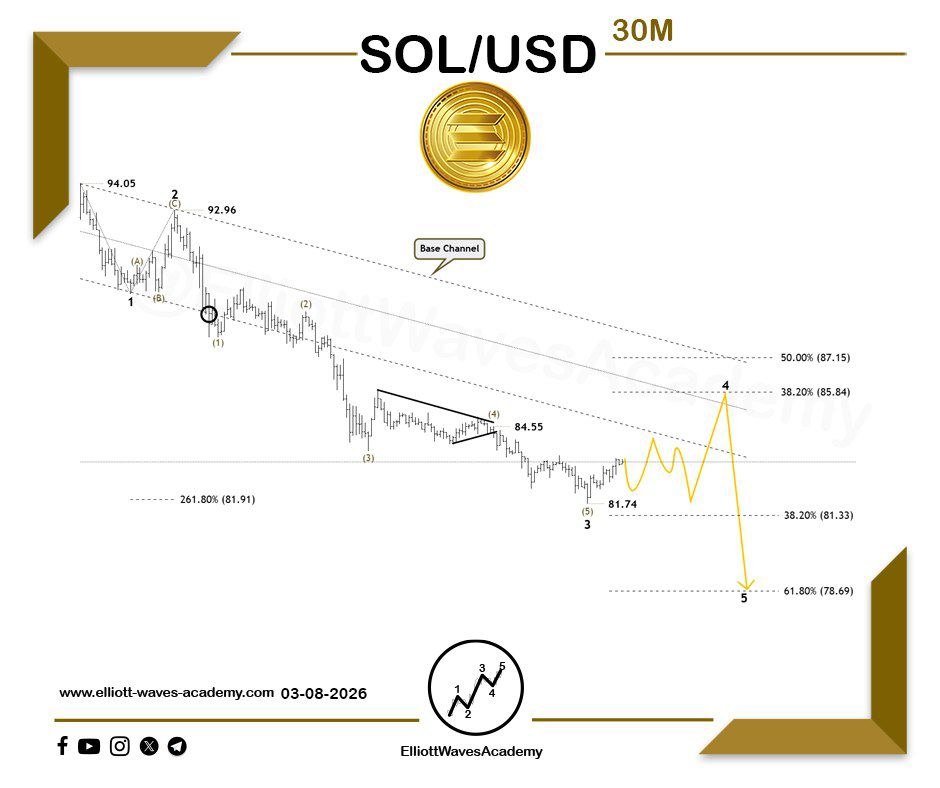
#Solana (#SOL) 🇺🇸 Wave outlook on the 30-minute time frame
🔀 Wave Four in progress
The pair appears to be preparing for a strong bearish move after the decisive break of the price channel! 💥 The price has reached the 261.80% level, indicating the completion of wave three, which forms the backbone of the current bearish trend. 📈
💡 Now we are in the fourth wave phase, which comes after the sharp decline of wave three. Considering the sharp nature of the previous second wave, wave four is likely to take on a calmer character and may move within a sideways pattern or possibly form a corrective triangle pattern. This corrective structure reflects a temporary balance before preparing for another round of decline! 💥
🎯 If the key level of the corrective pattern is broken, we may see the next bearish wave heading toward the 81.33 – 78.69 zone, indicating significant downside targets for bearish traders.
Our Daily Premium Analysis 👉 : elliottwavesacademy.gumroad.……
For Our Educational Program Analysis 👉 :
elliott-waves-academy.com/pr……
#elliottwave #tradingview #technicalanalysis #swingtrading #waveanalysis #BTCUSD #cryptocurrencies #btctrading #forexdubai #forexeurope #forexuk #ETHUSD #tradingstrategies #priceactiontrader #ethereumtrading #ethereuminvestment #ethereumprice #bitcoinsignals #priceactiontrading #forexmalaysia #forexespanol #forexfrance #tradingacademy #forexaustralia #bitcointrading #Dogecoin #SOLUSDT
3
1
17
2,273
#Bitcoin Against the US Dollar 🇺🇸 #BTCUSD – Following-Up on the Expected Wave Structure on the Weekly Timeframe
Is the Correction Still Ongoing? 🤔
The current price trend remains corrective in nature, as reflected in the internal structure of the bearish waves. The market may witness one final decline through the sub-waves of Wave C within a larger-degree corrective structure, representing Wave (2)/(B). This scenario would likely unfold after the formation of the final leg of Wave B within this corrective pattern and a break below a key level.
This corrective outlook could extend 〽️ toward the first reversal support zones or even reach the second zone, as illustrated on the chart. 👌
A breakout above a key level through an impulsive wave structure would provide the green light for this bullish scenario, supported by the internal details of a new impulsive wave formation. 🚀
As an alternative scenario, there may still be one final upward leg remaining within Wave B before another decline toward the previously mentioned zones.
Our Daily Premium Analysis 👉 : elliottwavesacademy.gumroad.……
For Our Educational Program Analysis 👉 :
elliott-waves-academy.com/pr……
#elliottwave #tradingview #technicalanalysis #swingtrading #waveanalysis #BTCUSD #cryptocurrencies #btctrading #forexdubai #forexeurope #forexuk #ETHUSD #tradingstrategies #priceactiontrader #ethereumtrading #ethereuminvestment #ethereumprice #bitcoinsignals #priceactiontrading #forexmalaysia #forexespanol #forexfrance #tradingacademy #forexaustralia #bitcointrading #Dogecoin #BTCUSDT


2
9
53
3,763
#AUDUSD 🇦🇺/🇺🇸 Follow-Up on the Expected Wave Outlook for the Currency Pair on the 4-Hour Timeframe
Reversal Zone ⚡️
This comes after the formation of an impulsive bullish wave, followed by a relatively deep corrective wave, with price expected to reach the 100% extension of Wave W 🔄
🤔 The question now is: Has the market completed this correction? We may still witness one final decline, as illustrated on the chart 📊. In this case, several key factors must be met to confirm the bullish scenario:
🔑 A breakout above a key level.
🏹 A breakout above the upper boundary of the diagonal pattern.
⚠️ A break below the 0.68350 level would invalidate the bullish scenario.
...To analyze our educational program 👉:
elliott-waves-academy.com/pr…
#EURUSD #ElliottWaves #PriceActionTrading #PriceAction #PriceActionStrategy #CurrencyTrading #TechnicalAnalysis #TradingForLives #TradingAcademy #TradingStrategies #TradingProfits #TradingExpert #TradingForLives #ForexSchool #ForexAsia #ForexDubai #ForexEurope #ForexUK #ForexMalaysia #ForexAustralia #ForexSpain #ForexFrance #ForexJapan #ElliottWaves #WaveAnalysis #GoldTrading #PriceActionTrading #XAUUSD #DowJones #ForexUK


1
6
1,357
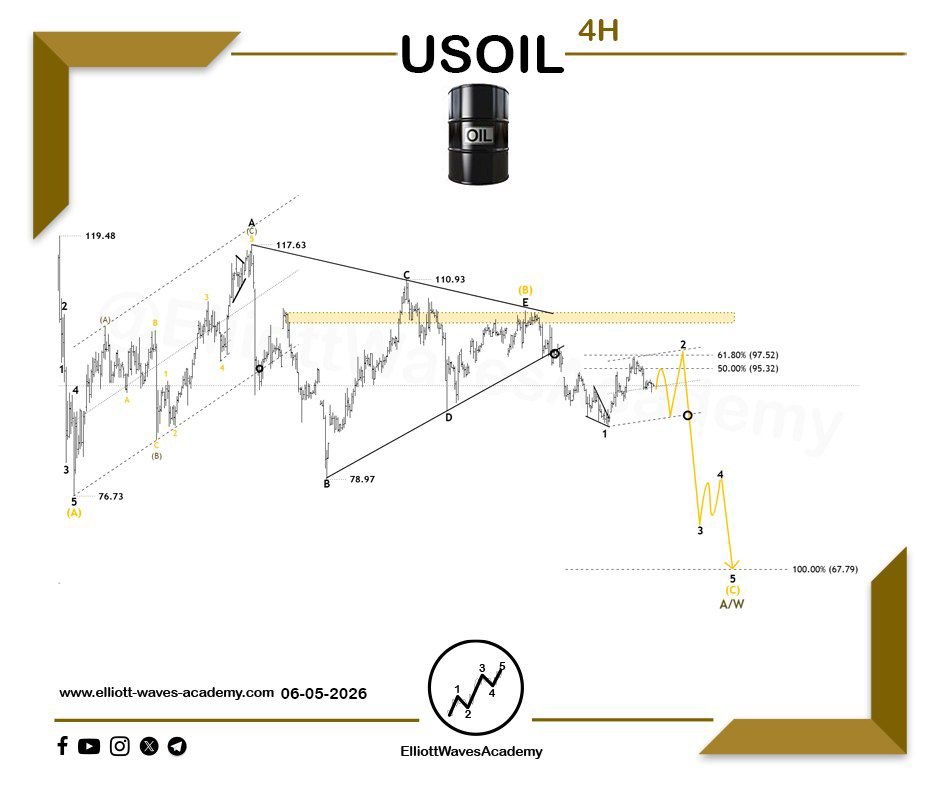
#USOIL (US Crude Oil) 🇺🇸 Wave Outlook on the 4-Hour Timeframe 📈
Selling Pressure 🐻
A closer examination 🧐 of the wave movements shows that the instrument is currently under strong selling pressure from the bears 🐻, as a key level related to the latest wave structure has been broken 🔨, reinforcing bearish control over the market.
Based on this outlook, we can expect further downside through the sub-waves of Wave (C), which could potentially drive the price toward the 100% extension of the previous wave, forming a new low below the 76.73 level and, ideally, reaching the 67.79 level. 📉
Price action should then be reassessed once this scenario is achieved.
For Our Daily Premium Analysis 👉 : elliottwavesacademy.gumroad.……
For Our Educational Program Analysis 👉 :
elliott-waves-academy.com/pr……
#XAUUSD #elliottwave #tradingview #technicalanalysis #swingtrading #GOLD #waveanalysis #metal #goldprice #goldcost #goldsignals #xauusdsignals #XAGUSD #silverprice #crudeoil #WTI #oiltrading #oilprice #eurusd #gbpusd #btc #priceactionstrategy #forexuk
4
19
3,038
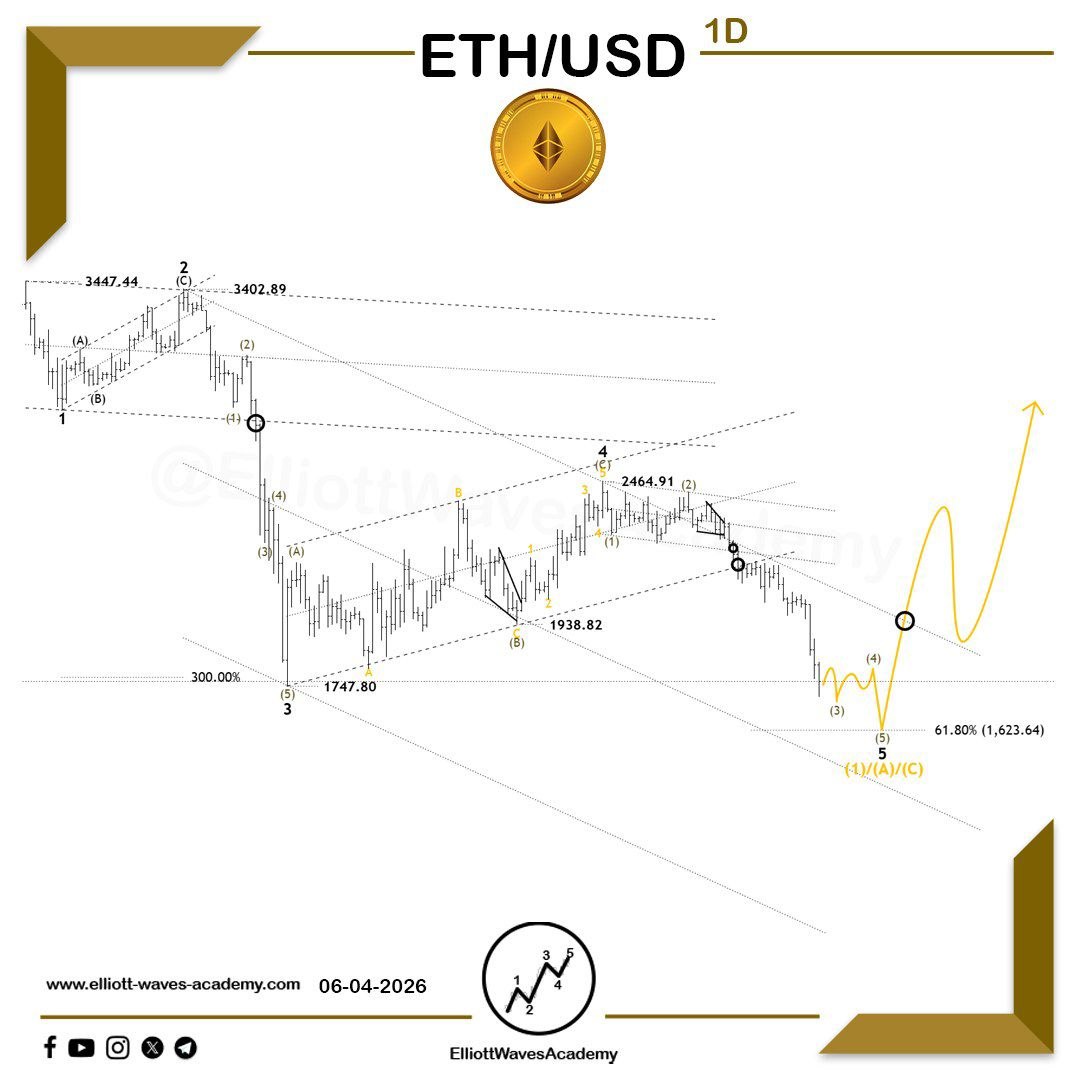
#Ethereum 🇺🇸 Against the US Dollar – Follow-Up on the Expected Path for the Cryptocurrency on the Daily Timeframe
Recovery or Further Decline? 🤔
〽️ After the series of declines the price has experienced through the sub-waves of a bearish structure, this downward movement may be nearing completion — at least in the short term — with a potential recovery on the horizon. The price is approaching the ideal target for Wave 5, and if a reversal occurs from the median line of the price channel, it would strengthen the recovery outlook. 📈
🏹 A breakout above the key level of the bearish wave could trigger a bullish move, potentially pushing the price toward the Wave 4 territory at the very least. 🚀
⚠️ On the other hand, if the key level or the upper boundary of the final channel fails to break, further downside could be expected through an extension of the bearish waves. 🚨
Our Daily Premium Analysis 👉 : elliottwavesacademy.gumroad.……
For Our Educational Program Analysis 👉 :
elliott-waves-academy.com/pr……
#elliottwave #tradingview #technicalanalysis #swingtrading #waveanalysis #BTCUSD #cryptocurrencies #btctrading #forexdubai #forexeurope #forexuk #ETHUSD #tradingstrategies #priceactiontrader #ethereumtrading #ethereuminvestment #ethereumprice #bitcoinsignals #priceactiontrading #forexmalaysia #forexespanol #forexfrance #tradingacademy #forexaustralia #bitcointrading #Dogecoin #ETHUSDT

1
4
41
2,754
Wave outlook for #DXCM 🇺🇸 on the 1-hour timeframe 🌟
Bullish dominance on the horizon 🔥
🏹 The price has witnessed a notable rise, forming the structure of wave 3 within a higher-degree impulsive wave.
Since wave 3 and part of wave 4 have already been completed, we expect the following:
1. Completion of a corrective pattern representing wave 4 of the current bullish movement. 🔀
2. Wave 4 may develop into one of the sideways corrective structures due to the sharp nature of wave 2. 🔃
3. A breakout above a key level would confirm the bullish outlook and continuation of the positive trend. 🔑
4. Potential targets for the upward wave as illustrated on the chart. 💸💸
For Our Daily Premium Analysis 👉 : elliottwavesacademy.gumroad.……
For Our Educational Program 👉 :
elliott-waves-academy.com/pr……
#us30trading #elliottwave #waveanalysis #tradingview #technicalanalysis #swingtrading #dax30 #Dowjones #sp500 #stockstobuy #nasdaqtrading #US30 #dowjonestrading #dowjonessignals #nikkei225 #UK100 #priceactiontrading #priceactiontrader #priceactiontrading #priceaction #priceactionstrategy #tradingschool #tradingacademy #tradingstrategies #stockstrading

5
1,117
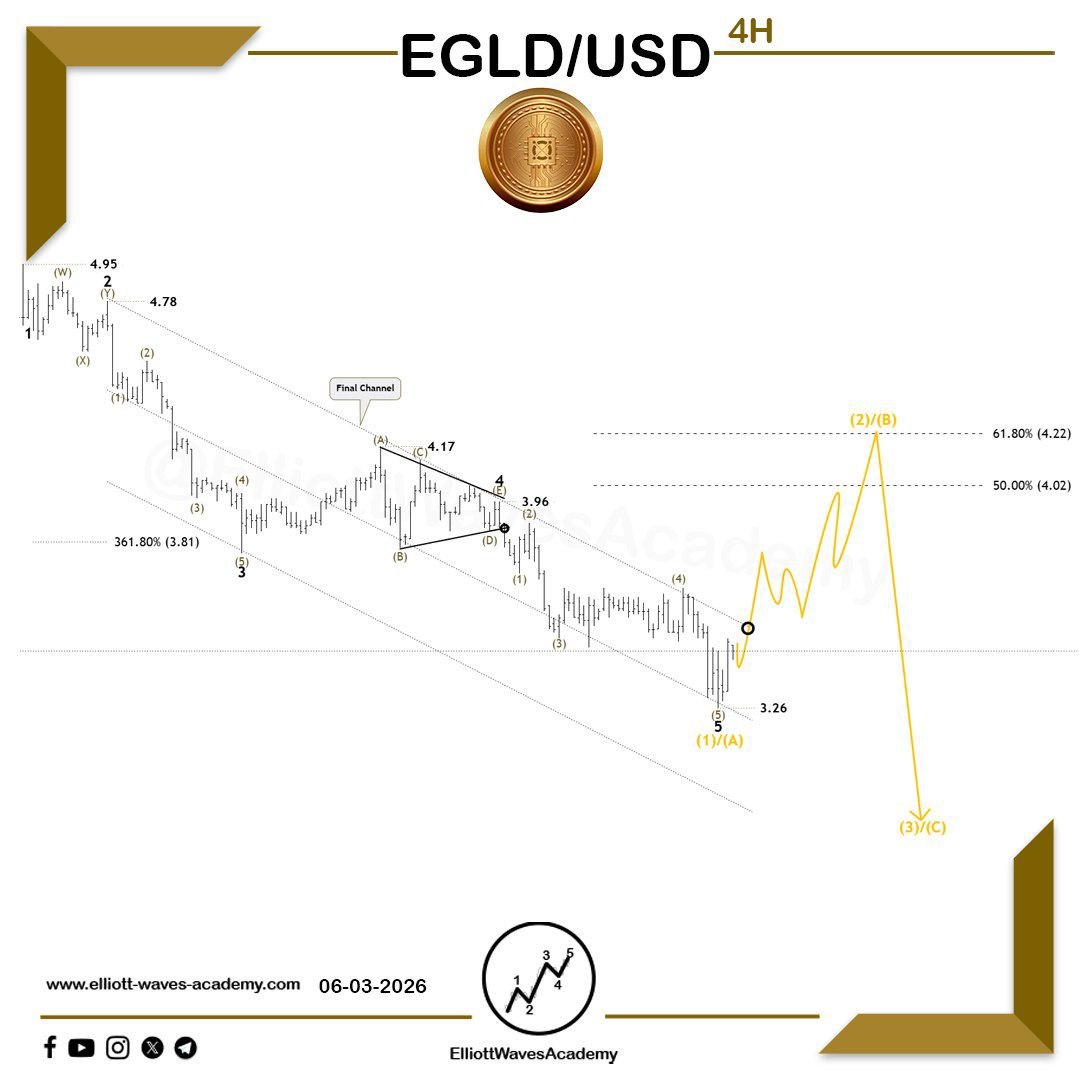
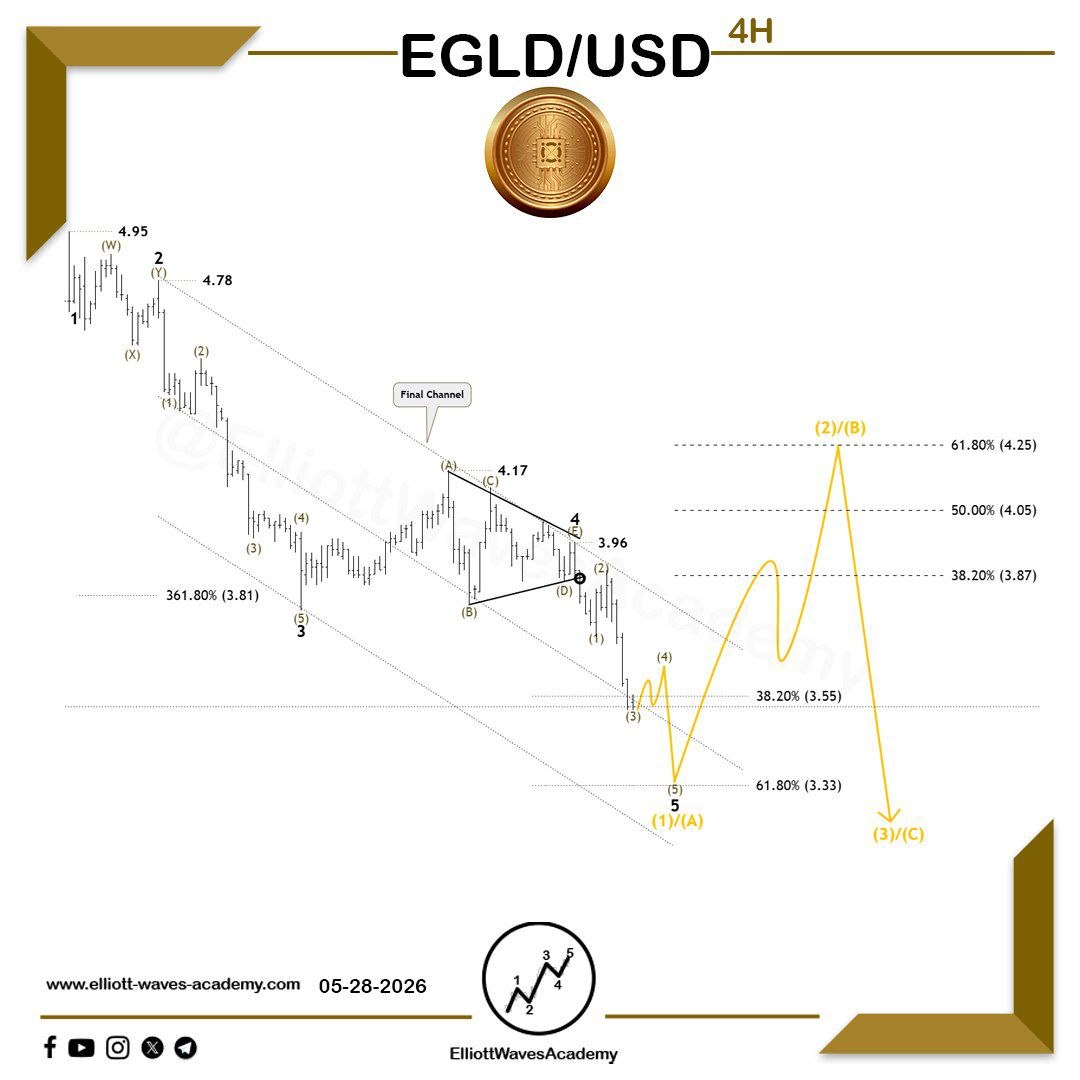
Follow-up on the wave count for 🇺🇸 #EGLDUSD on the 4-hour timeframe
Expected recovery 📈
👉 One of the possible short-term scenarios for the pair is a recovery 📈 through a corrective wave that may represent wave (2)/(B), potentially forming as a zigzag pattern.
✨ A breakout 🏹 above the price channel, along with the key level of the bearish wave, strengthens the probability of this recovery. The corrective wave may also be contained within a price channel, as illustrated on the chart. ⚡️
The expected recovery zone lies between the 50%–61.8% Fibonacci retracement levels of the previous bearish wave.
💫 In order to see another bearish wave, this zone must act as a resistance area and a gathering point for the bears. 🐻
If impulsive waves continue to form while maintaining the current low without being broken, further upside movement is expected.
Our Daily Premium Analysis 👉 : elliottwavesacademy.gumroad.……
For Our Educational Program Analysis 👉 :
elliott-waves-academy.com/pr……
#elliottwave #tradingview #technicalanalysis #swingtrading #waveanalysis #BTCUSD #cryptocurrencies #btctrading #forexdubai #forexeurope #forexuk #ETHUSD #tradingstrategies #priceactiontrader #ethereumtrading #ethereuminvestment #ethereumprice #bitcoinsignals #priceactiontrading #forexmalaysia #forexespanol #forexfrance #tradingacademy #forexaustralia #bitcointrading #Dogecoin #EGLDUSDT
1
7
1,086