
Joined January 2009
- Tweets 1,680
- Following 698
- Followers 483
- Likes 90
330 Photos and videos


Jan Dutton retweeted

Jun 16
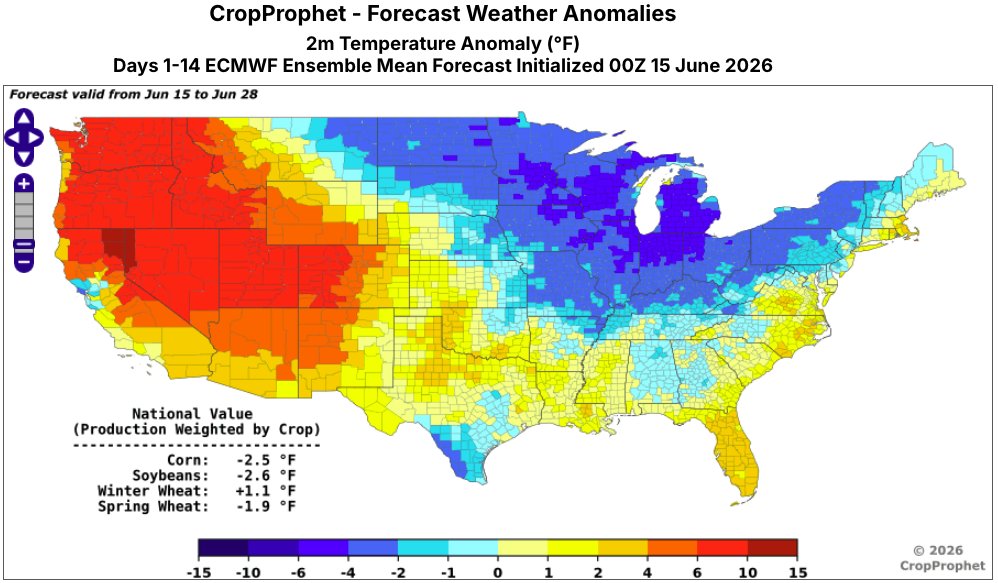
A customer asked us why the 15-day weather forecast affected the corn and soybean yield forecasts differently.
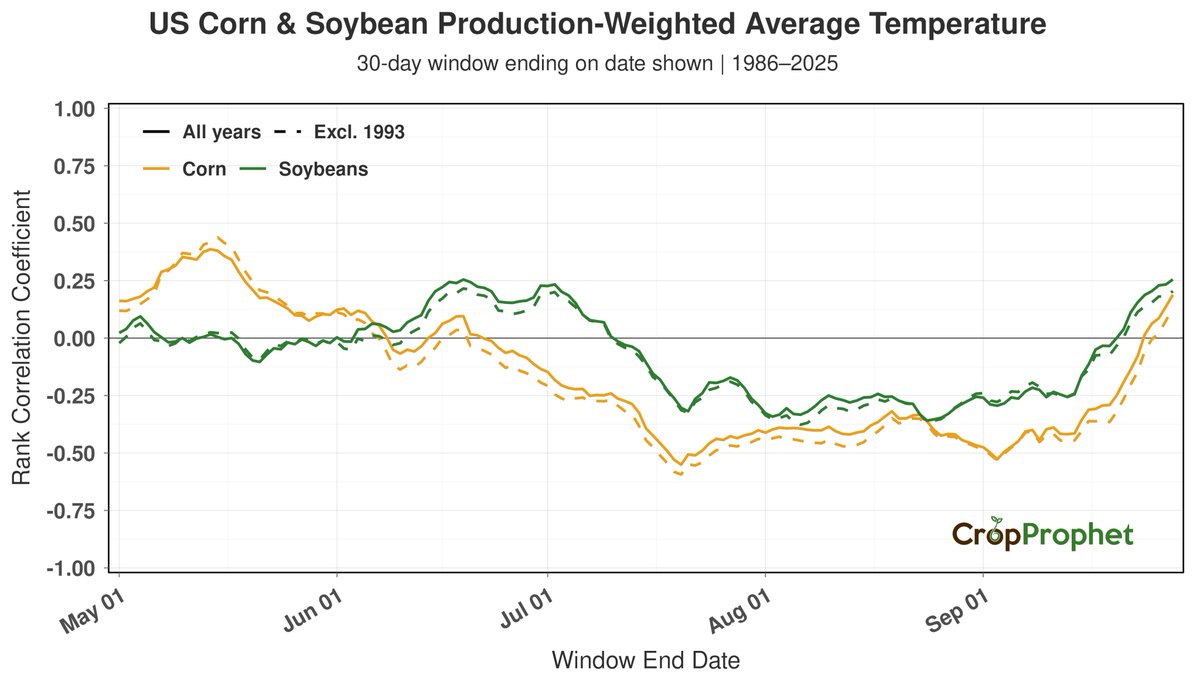
The short answer: cooler late-June temperatures do not affect corn and soybeans the same way.
In this analysis, cooler average temperatures during the current 14-day forecast period are more closely associated with higher end-of-season corn yield, but lower end-of-season soybean yield.
That helps explain why CropProphet’s latest ECMWF 15-day yield forecast shows a slightly positive national change for corn, while soybeans show a negative national change.
#OOTT #AgWx #AgWeather #Corn #Soybeans


1
2
11
1,719
Jan Dutton retweeted
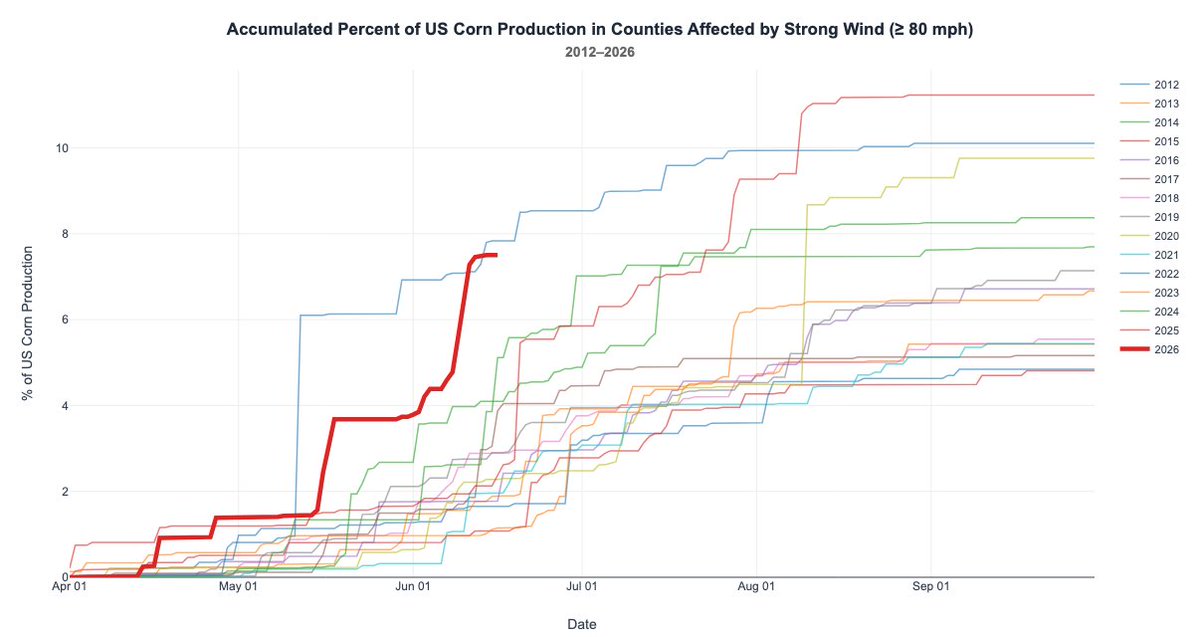
Reed Timmer noted that the Corn Belt has been affected by recurring severe weather setups since March, with only a brief break in May.
As of June 16, 2026, counties with large hail reports of 2 inches or greater account for the highest accumulated percentage of U.S. corn production at this point in the season compared with all prior years since 2012.
For wind reports of 80 mph or greater, 2026 is also near the high end of the historical range shown. As of June 16, only 2022 has a higher accumulated percentage.
Today’s SPC Moderate Risk across portions of Illinois and Indiana could further change these rankings.
#AgWx #GrainMarkets #Corn #CornBelt #SevereWx

Jun 16

Live emergency update - lead jet streak could cause failure scenarios for #tornado outbreak in central Illinois into northern Indiana. Moderate risk includes Peoria/Springfield to South Bend. Supercells fire on front 3-4 pm if ample recovery happens
2
20
96
30,901
Jan Dutton retweeted
Jun 15
@StandardGrain this morning asked: when is it too much rain, and at what point is it a bullish story? So we looked into it.
🌧️ When is it too much? Above about 173% of normal, roughly 14 inches in a typical Corn Belt county. Yields fall to about 11% below trend at the wettest extreme.
📈 When is it bullish? Both tails are, but drought is the bigger, cleaner bull (driest seasons 33.5% to 47.1% below trend). Too much rain is bullish too, just smaller and mostly a wet Iowa/Minnesota story.
Rain only turns bullish once it's genuinely extreme.
#OOTT #AgWx #AgWeather #Corn #CornBelt


1
3
16
3,145
Jan Dutton retweeted
Jun 12
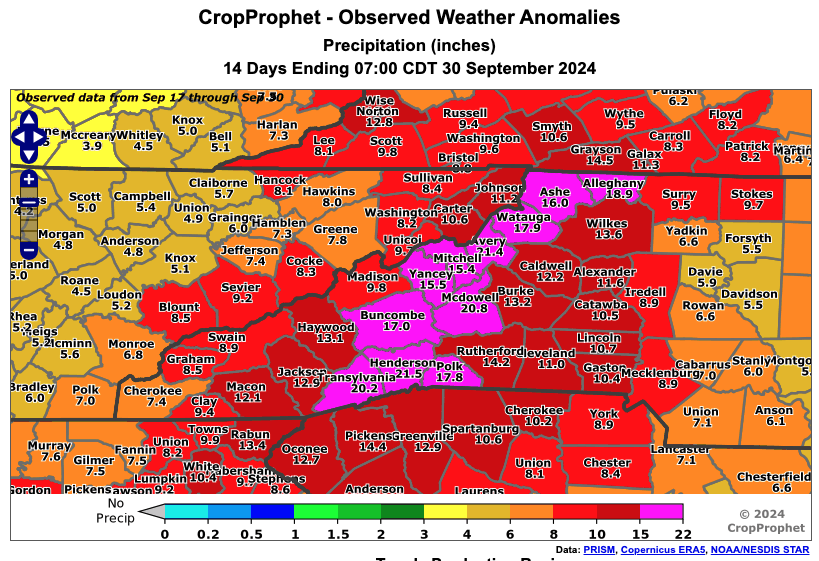
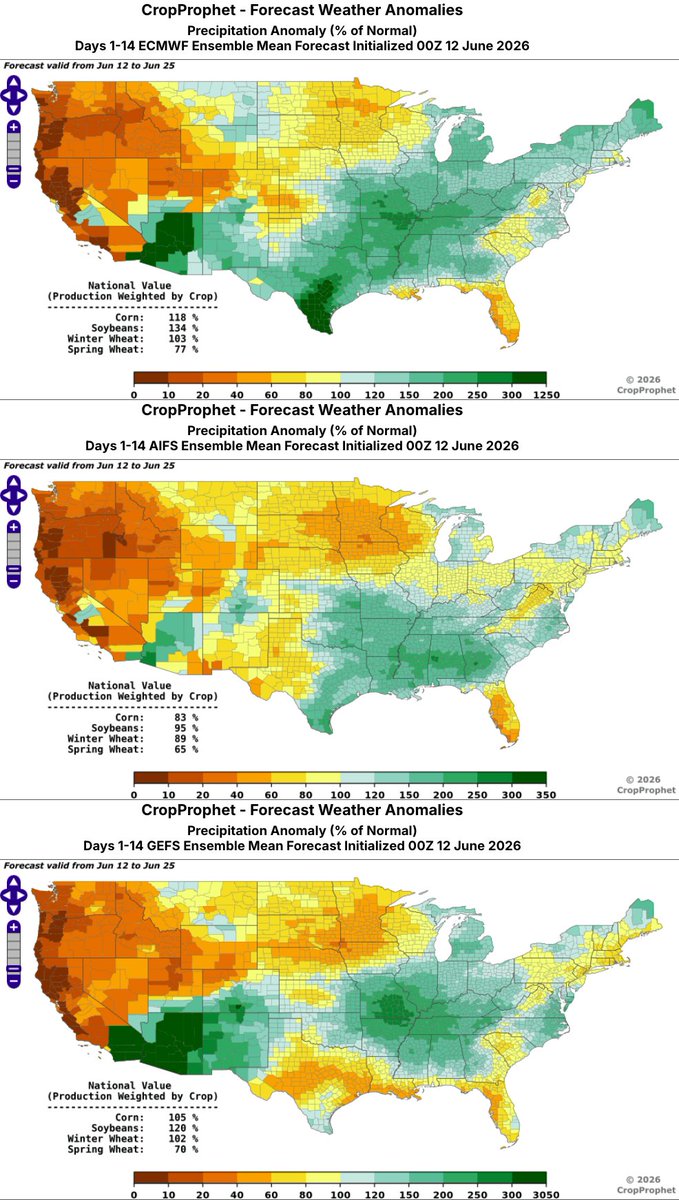
Over the past 60 days, precipitation has been below normal across portions of the western Corn Belt.
The latest 00z ECMWF, AIFS-ENS, and GEFS weather forecasts show continued below-normal precipitation across portions of the western Corn Belt during the next 14 days.
This weather pattern is worth monitoring as the calendar approaches July and the corn pollination window.
Use CropProphet to analyze weather risk with objective, data-driven insights: bit.ly/TryCropProphetTwitter
#OOTT #AgWX #AgWeather #Weather #Corn

1
2
8
1,047
Jan Dutton retweeted

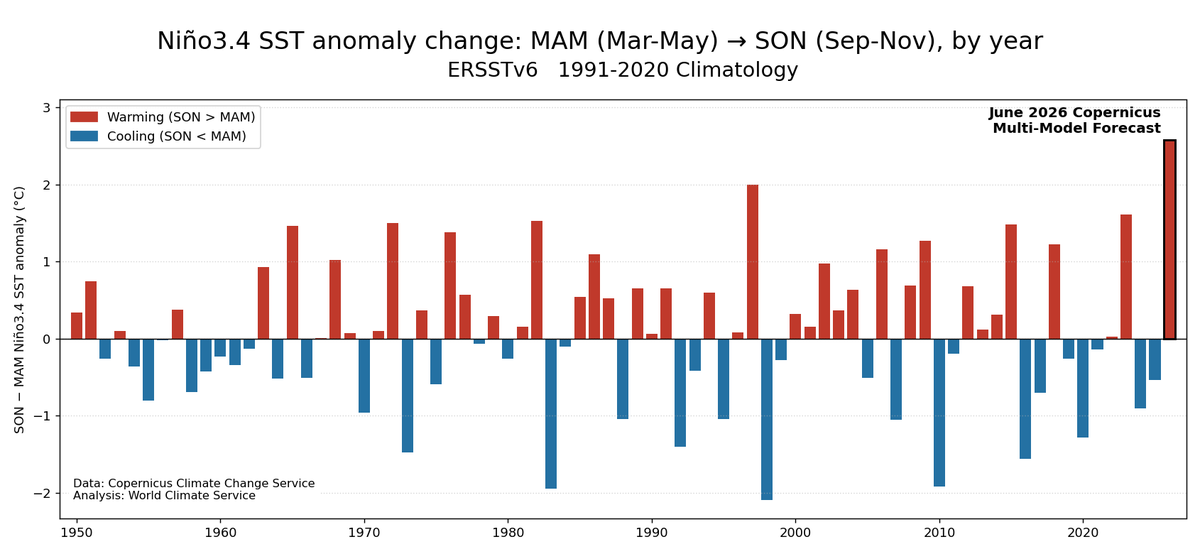
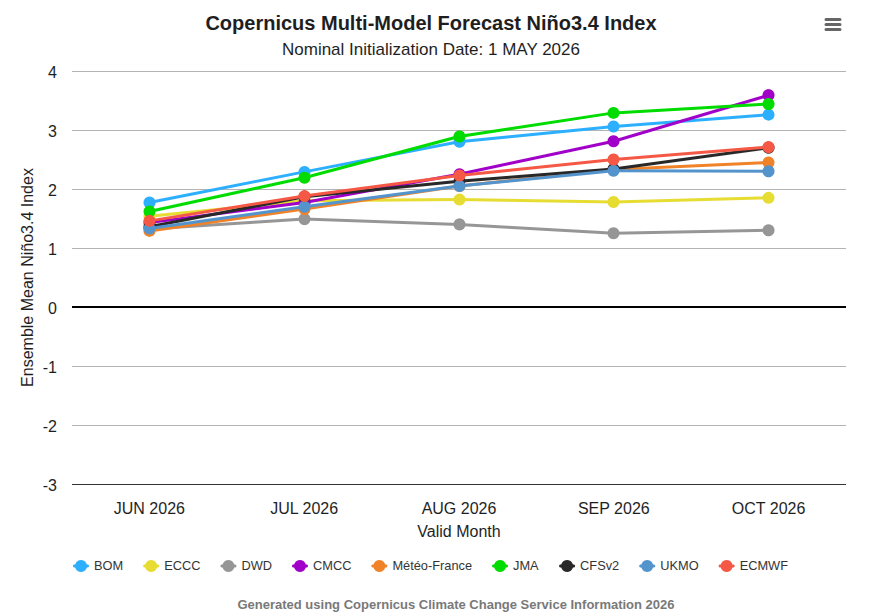
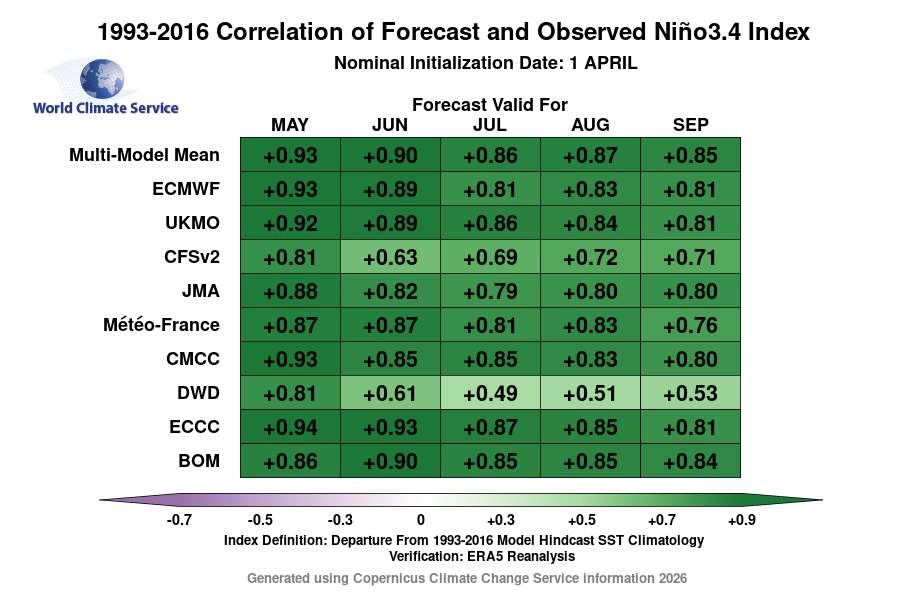
It's hard to overstate how remarkably the @CopernicusECMWF C3S models have escalated their forecasts for El Niño.
For example, the 6-month Niño3.4 warming ending Sep-Nov is expected to far exceed 1997 - and 1997 was previously an outlier by this metric.
4
20
111
24,522
Jan Dutton retweeted
Jun 8
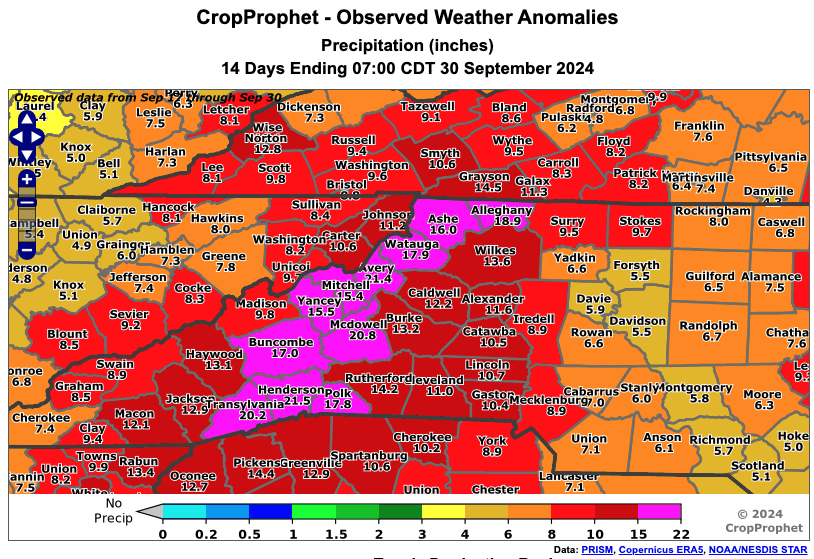
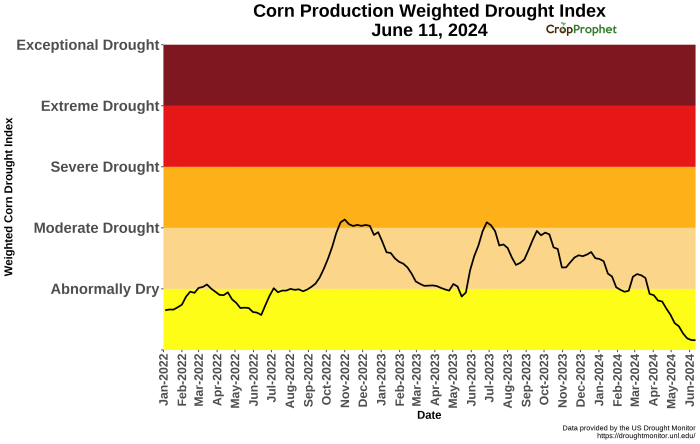
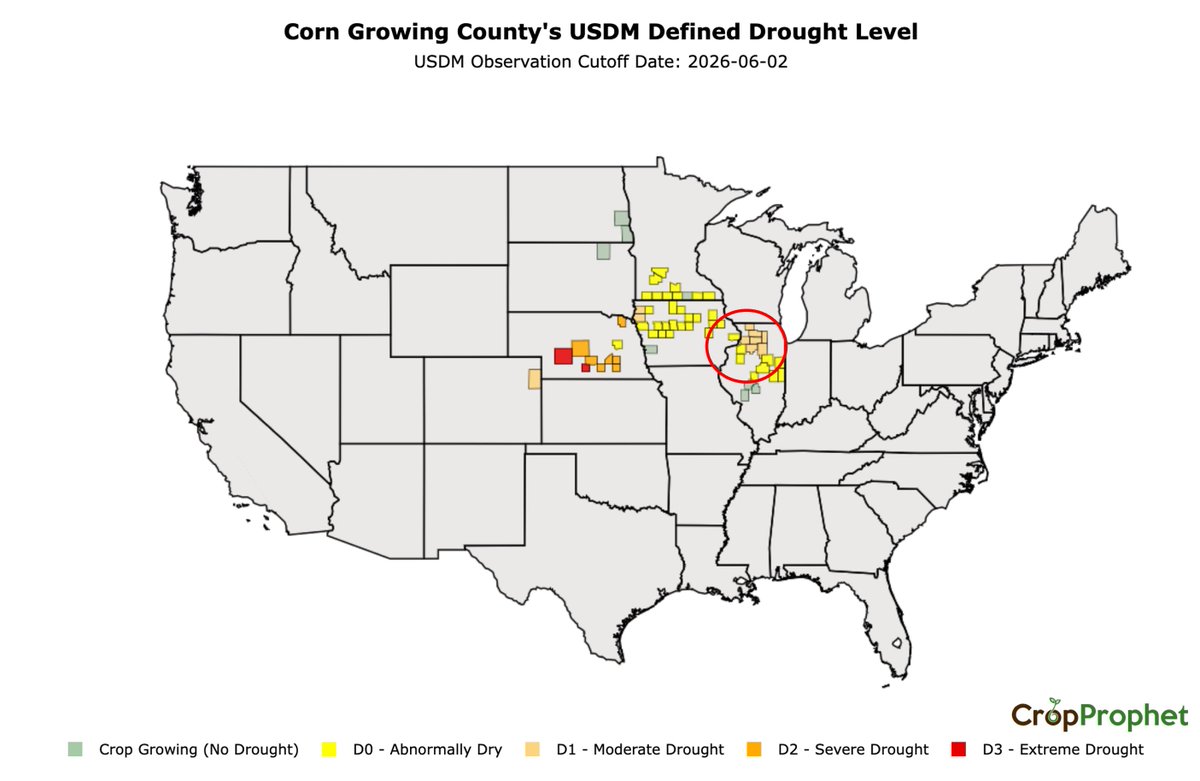
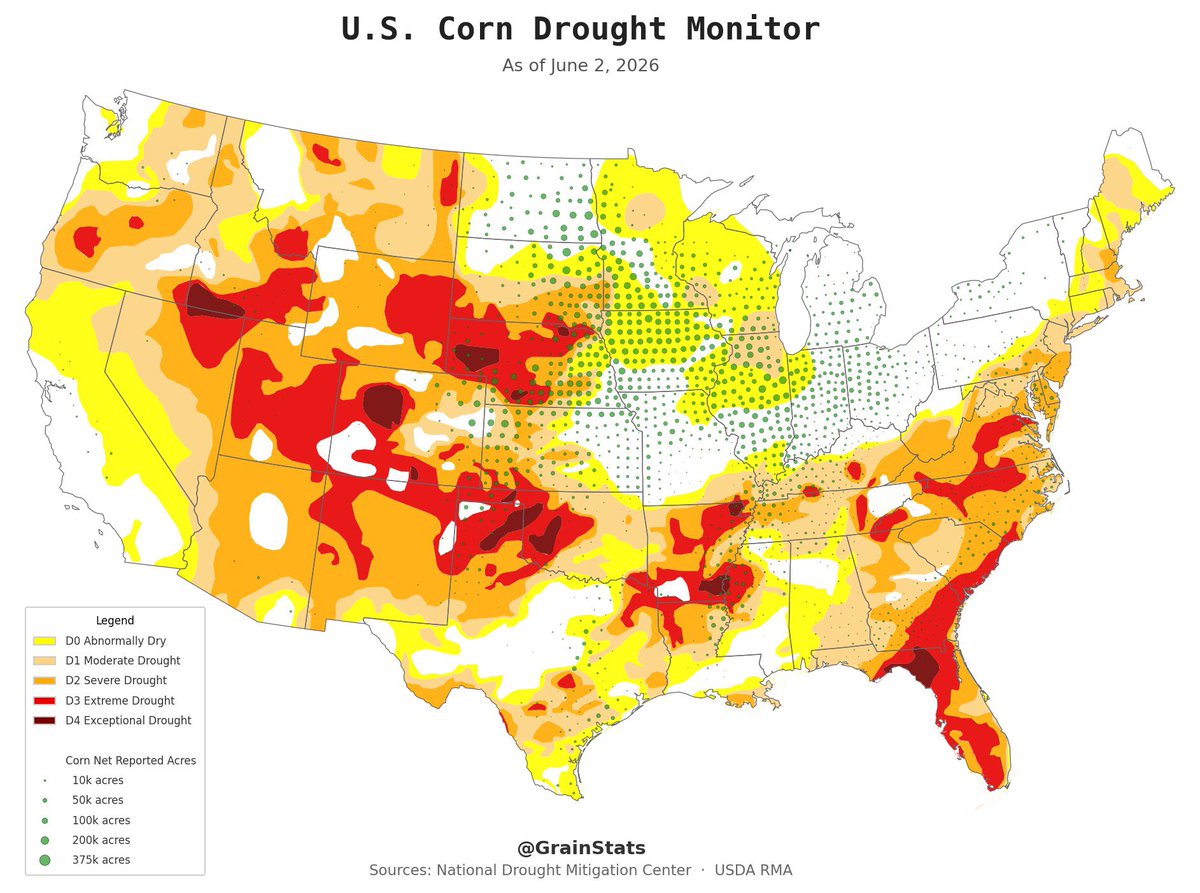
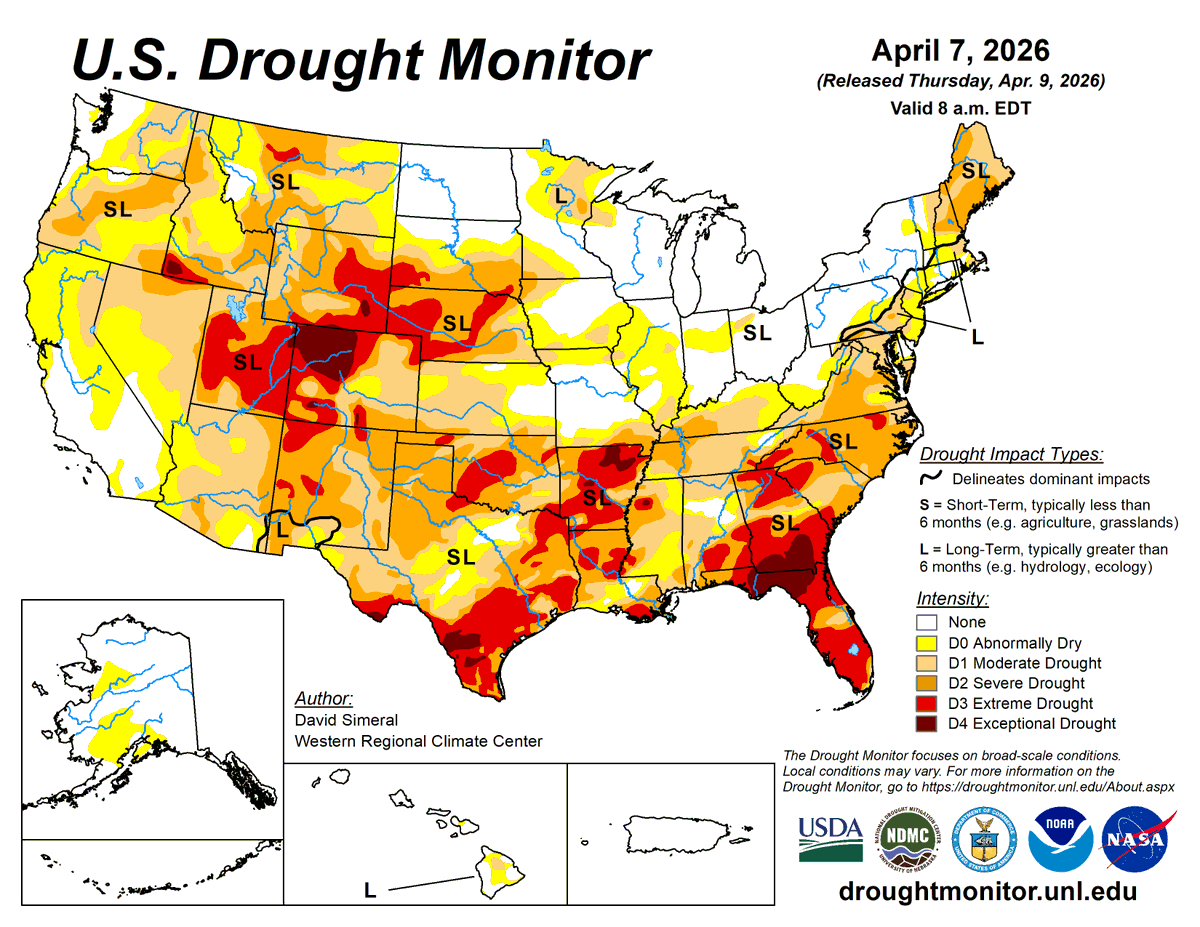
A soon-to-be-released CropProphet tool identifies the USDM-defined drought category for corn-growing counties within the top 20% of U.S. corn production.
Northern Illinois contains several of these high-production corn counties, with many currently classified as D2, Severe Drought, based on the latest USDM observation cutoff date shown in the graphic.
Today's 00Z ECMWF 14-day Illinois corn production-weighted precipitation forecast shows a surplus relative to seasonal normal, with the largest daily total forecast being today. As a result, the overall 14-day forecast outcome will be strongly influenced by how much precipitation occurs today.
#OOTT #AgWx #AgWeather #Corn

1
2
3
1,146
Jan Dutton retweeted
Jun 4
Check out our soon-to-be-released USDM graphic, which will be available in the CropProphet Enterprise interface.
This GIF shows corn-growing counties by U.S. Drought Monitor-defined drought level.
The animation filters counties by corn production share, starting with all corn-producing counties and narrowing in 10% increments to the top 10% of corn-producing counties.
Try CropProphet: bit.ly/TryCropProphet
#OOTT #AgWx #AgWeather #USDM

2
7
1,475
Jan Dutton retweeted
May 29
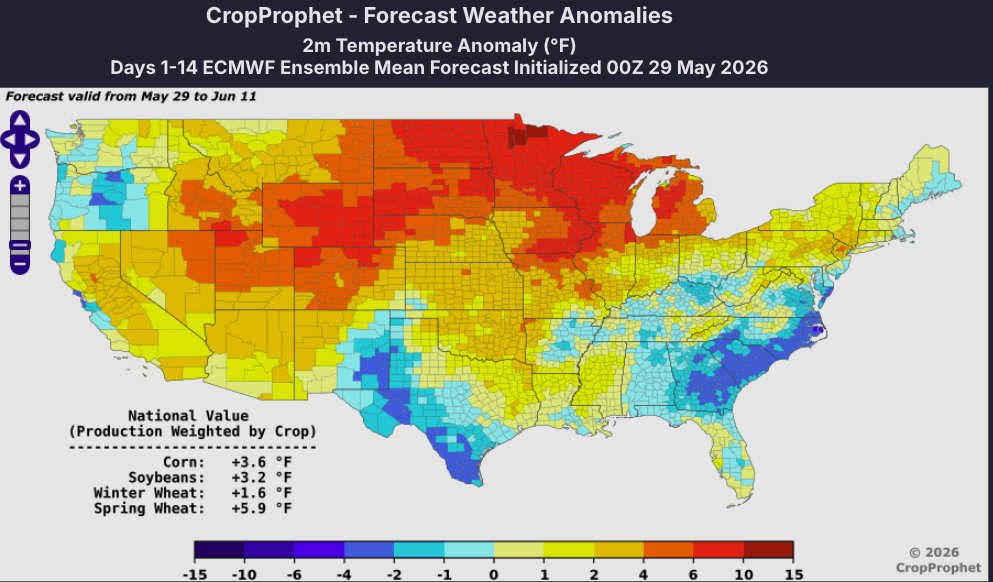
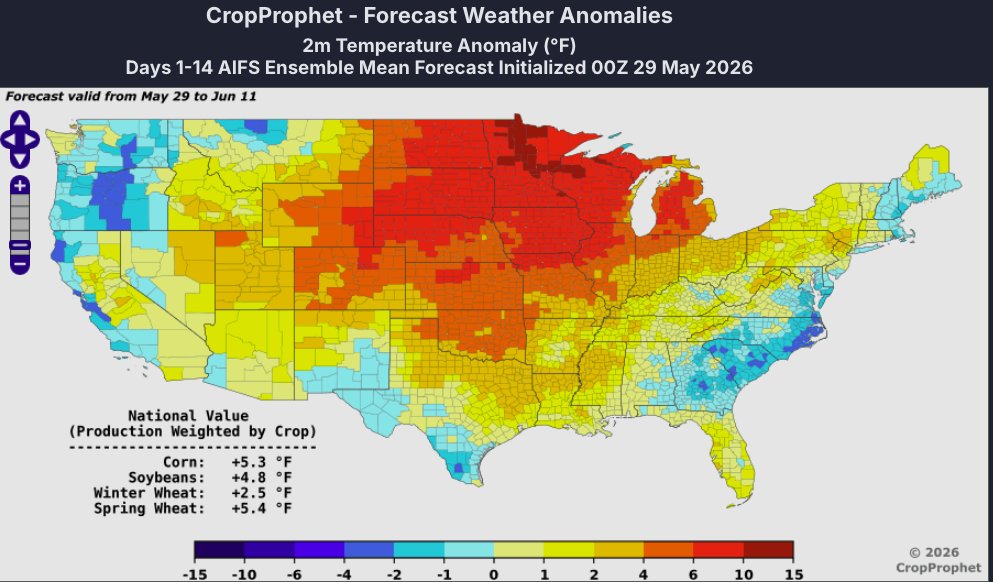
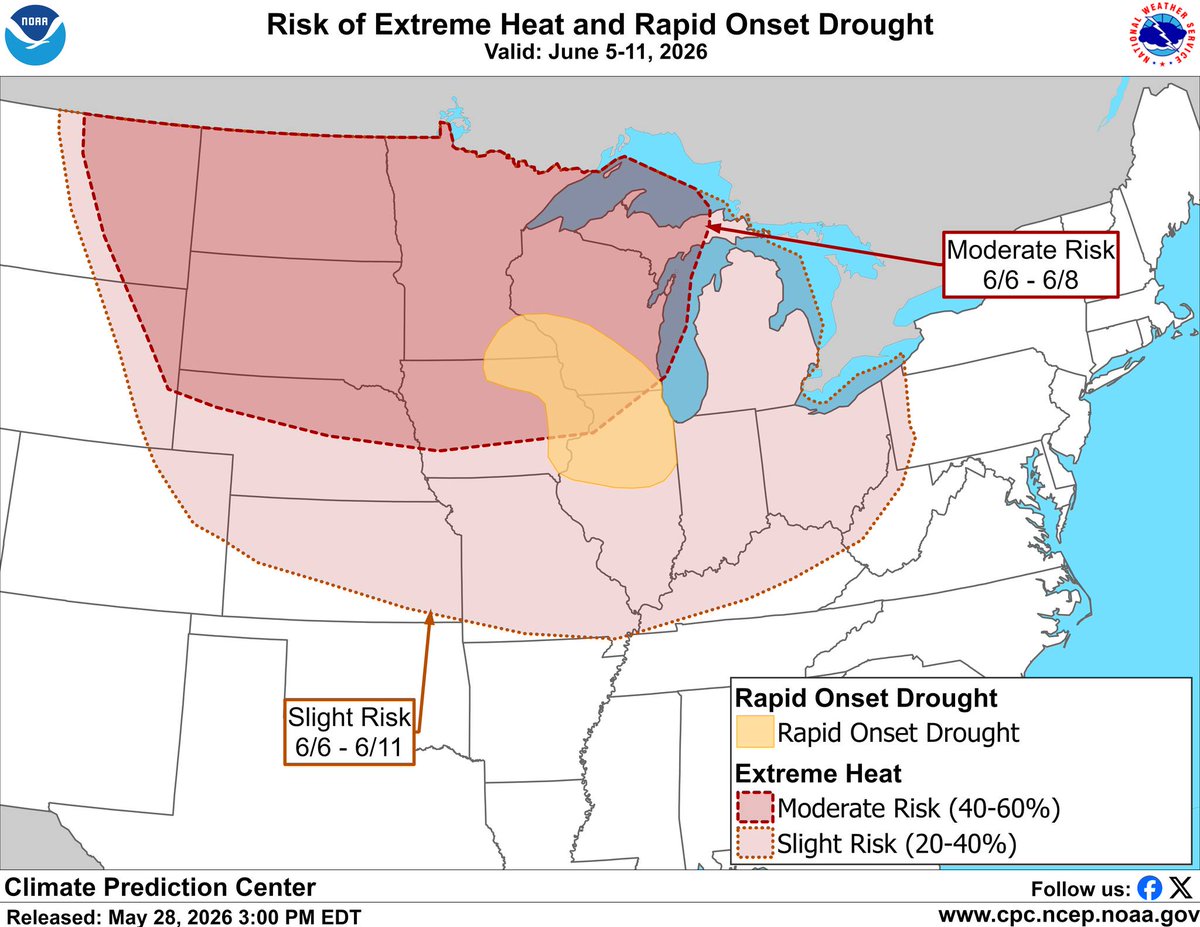
NOAA's Climate Prediction Center flagged a moderate risk of extreme heat with a Rapid Onset Drought risk designated across portions of the central Corn Belt for June 5-11.
This may not be bad news for corn yields right now. CropProphet's 1986-2025 analysis (rank correlation of the 30-day production-weighted average temperature vs. end-of-season corn yield, plotted by window end date) shows the relationship is positive for windows ending in May through early June, roughly neutral for windows ending mid-to-late June, then turns sharply negative for windows ending in July, when heat becomes a clear yield drag.
Today's 00Z 14-day ECMWF and AIFS forecasts show above-normal US corn production-weighted average temperatures of 3.6°F and 5.3°F respectively.
Heat in May/early June and heat in July are not the same story for corn.
#OOTT #Corn #Ags #Wx #AgWx #AgWeather #CPC
1
3
6
11,099
Jan Dutton retweeted
May 26
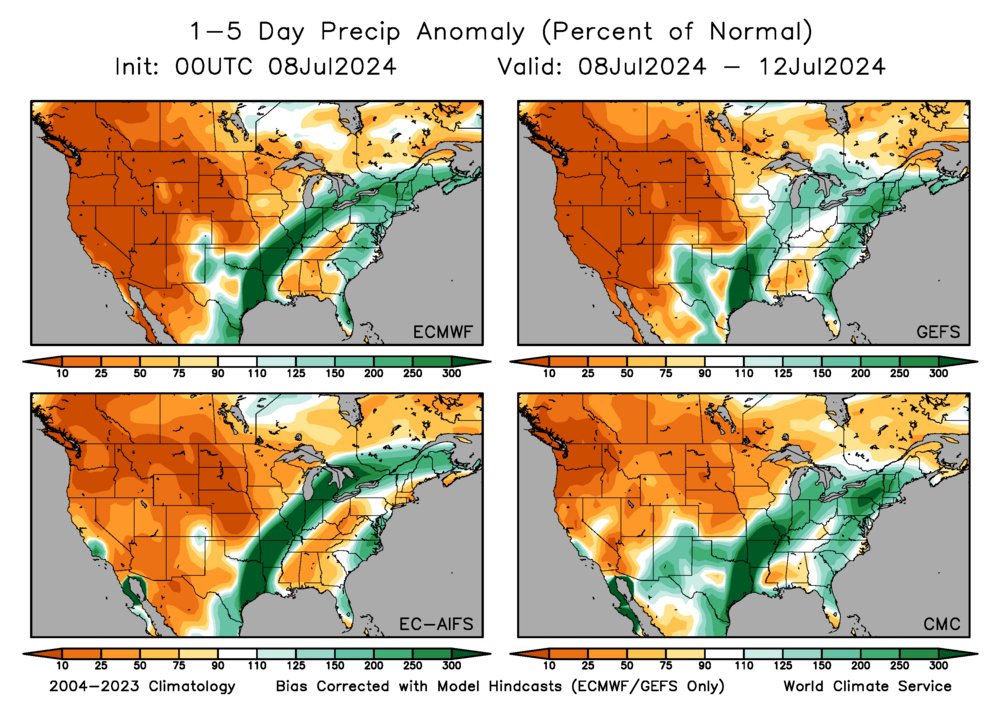
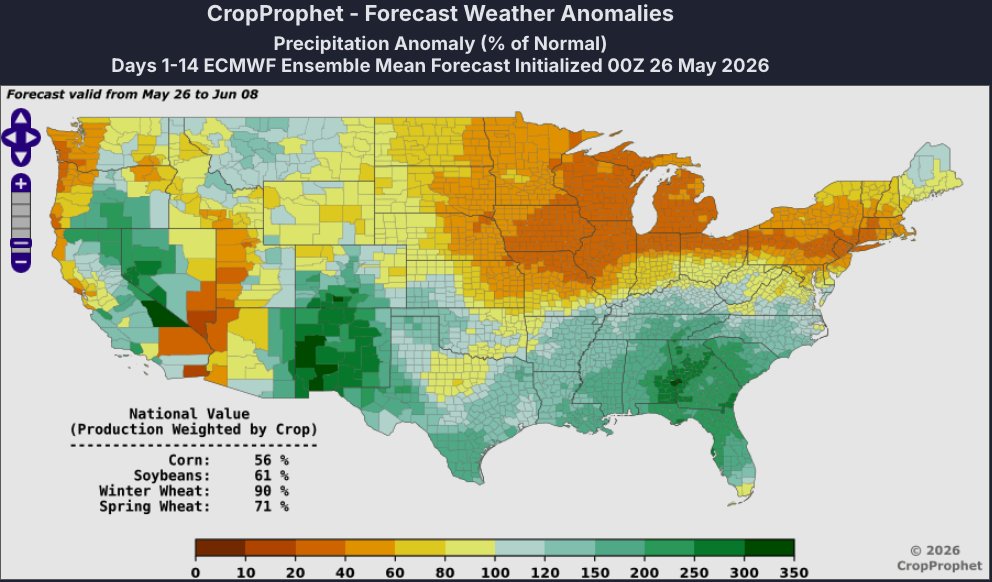
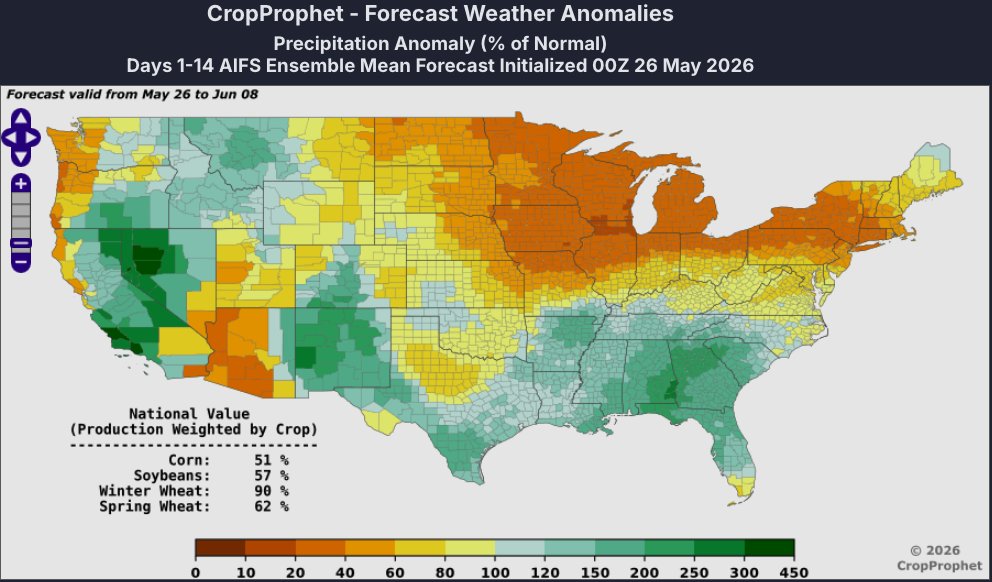
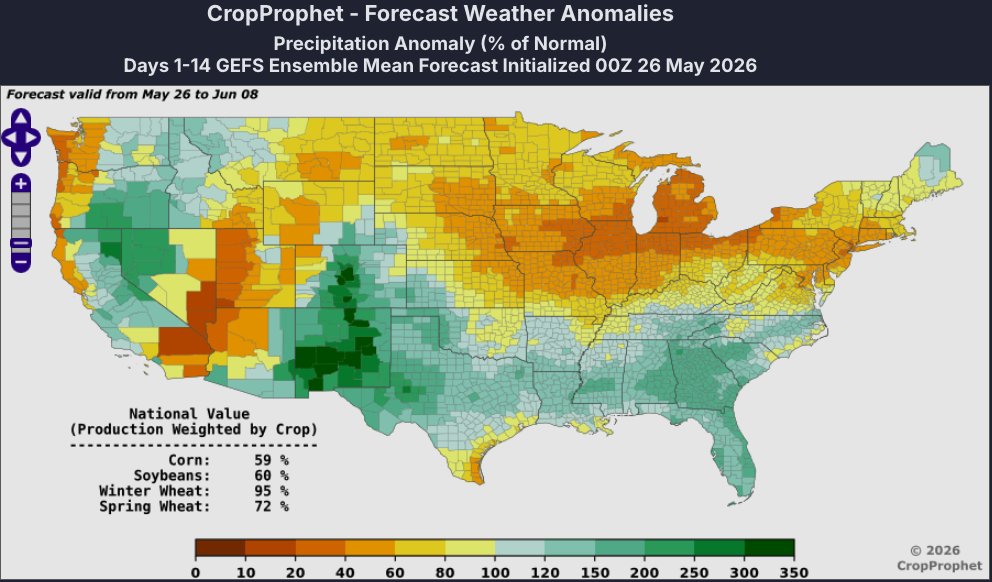
Today's 00z ECMWF, AIFS, and GEFS all forecast below normal US corn production-weighted precipitation over the next 14 days.
• ECMWF: 56% of normal
• AIFS: 51% of normal
• GEFS: 59% of normal
We are now in the US weather market season. It is time to start monitoring the weather forecasts more closely.
#OOTT #AgWx #AgWeather #Corn #CornBelt
1
5
9
7,737
Jan Dutton retweeted
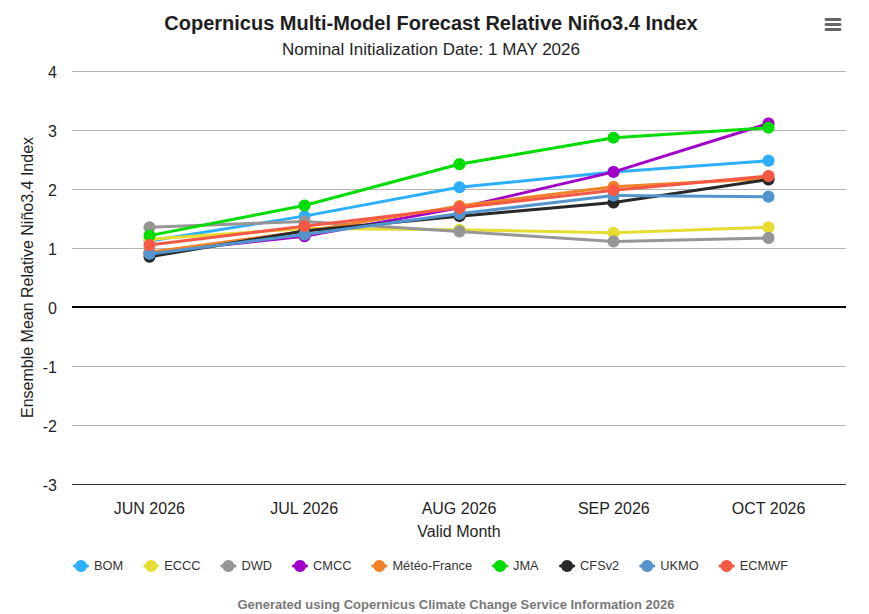
While the amplitude of the latest El Niño forecasts is a worthy headline, the latest C3S models show more variance than last month - both for traditional and relative Niño3.4 SSTs.
All models have warmed, but some much more than others.
(DWD is less credible - poor skill)
1
7
38
4,467
Jan Dutton retweeted
Good news as the U.S. Midwest growing season gets under way: drought/dryness have all but disappeared in the heart of the Corn Belt in the last two months, even as the Plains and Southeast have been very dry.
May 7

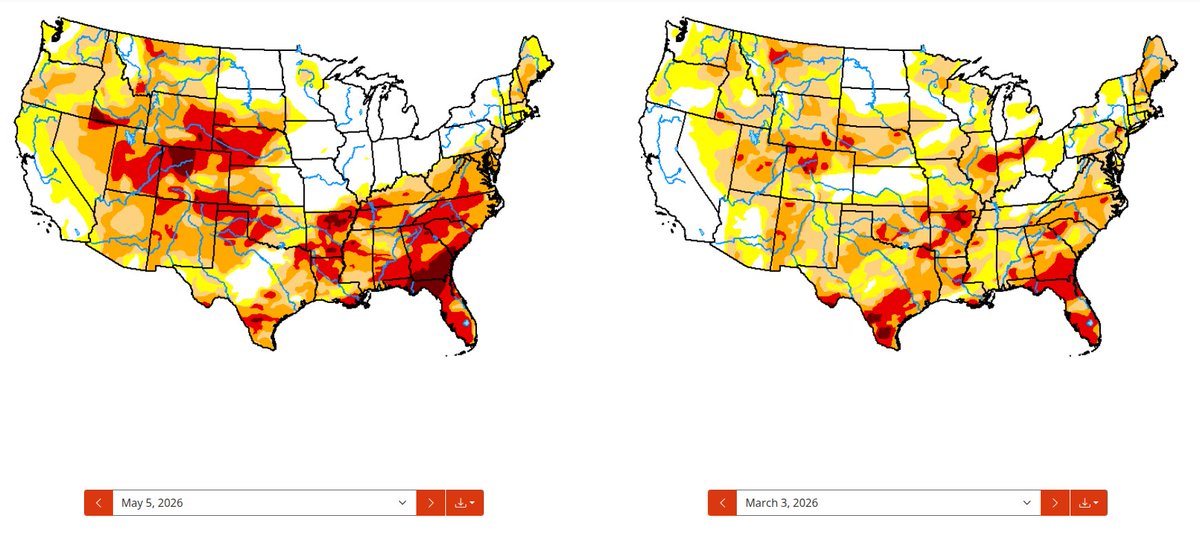
While drought in the Plains keeps worsening, the percentage of U.S. corn/soybean production NOT currently experiencing drought has increased significantly in the past two months.
In early March, only about 42% of U.S. corn production was outside a drought/dryness category. That figure has now risen to roughly 66% (top left panel).
#oatt #AgWx #AgWeather #Corn #Plant2026 #Weather
2
14
1,640
Jan Dutton retweeted
May 6
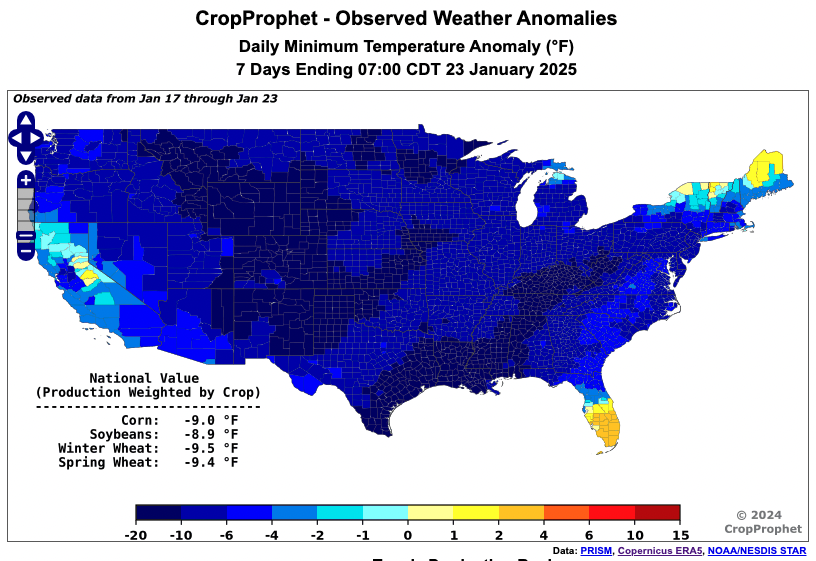
Minimum temperatures have been notably cold relative to 1981–2025 historical values since April 29 on a U.S. corn production-weighted basis.
Over the last 7 days, Nebraska and South Dakota corn production-weighted minimum temperatures have ranked much colder relative to history than Ohio.
The most comparable U.S. years for this period in 2026 include 1996 and 1984.
#oatt #AgWx #AgWeather #Corn #Plant2026 #Frost #Freeze

2
4
735
Jan Dutton retweeted
The progression of ECMWF seasonal VP200 forecasts shows the strengthening of this summer's atmospheric El Niño signal in recent months
1
29
116
18,826
Jan Dutton retweeted
May 4
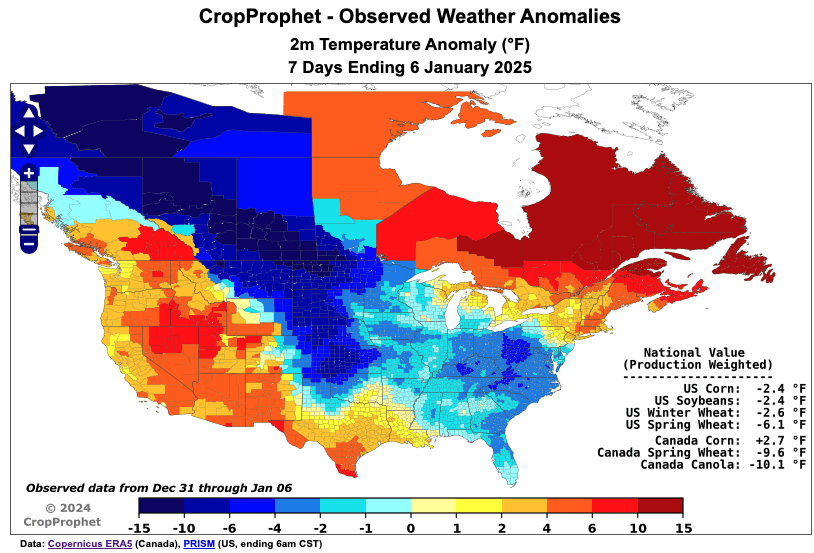
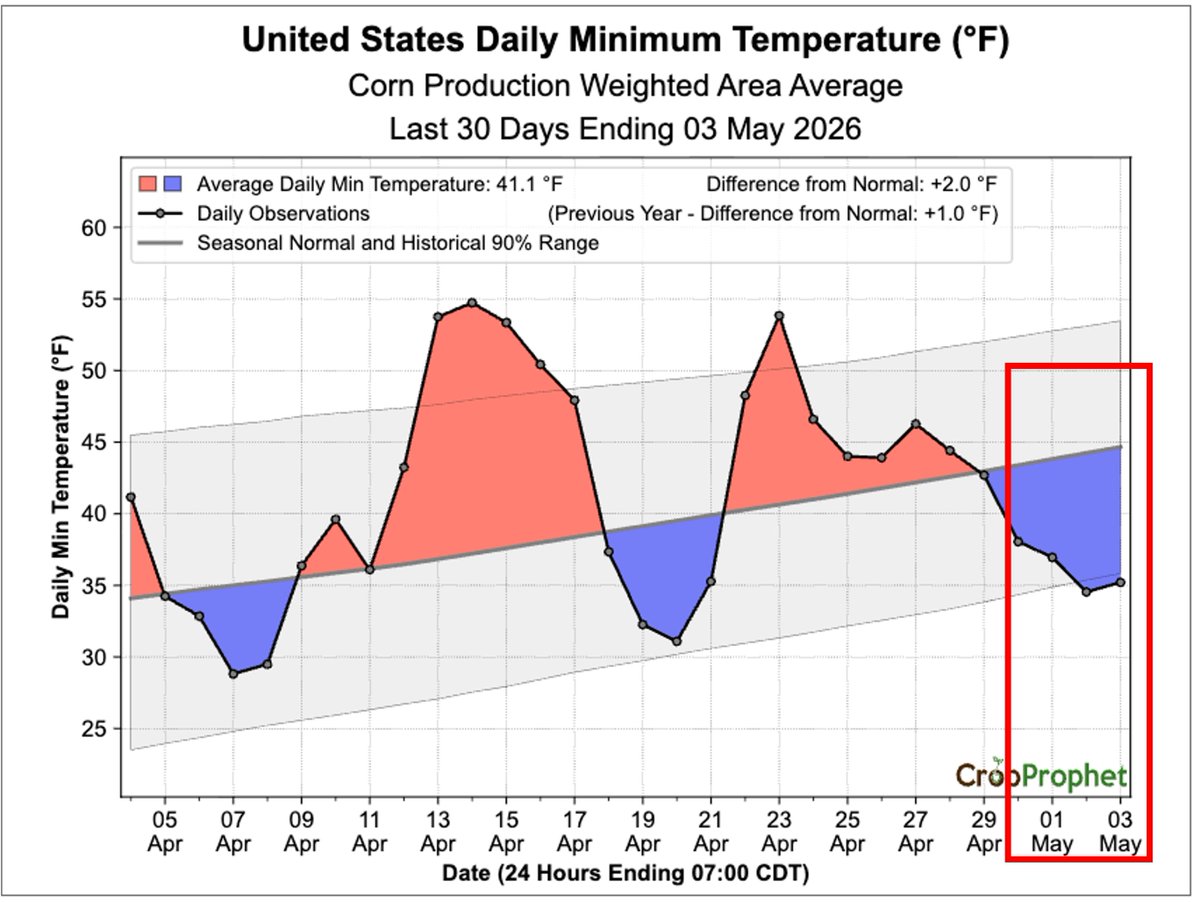
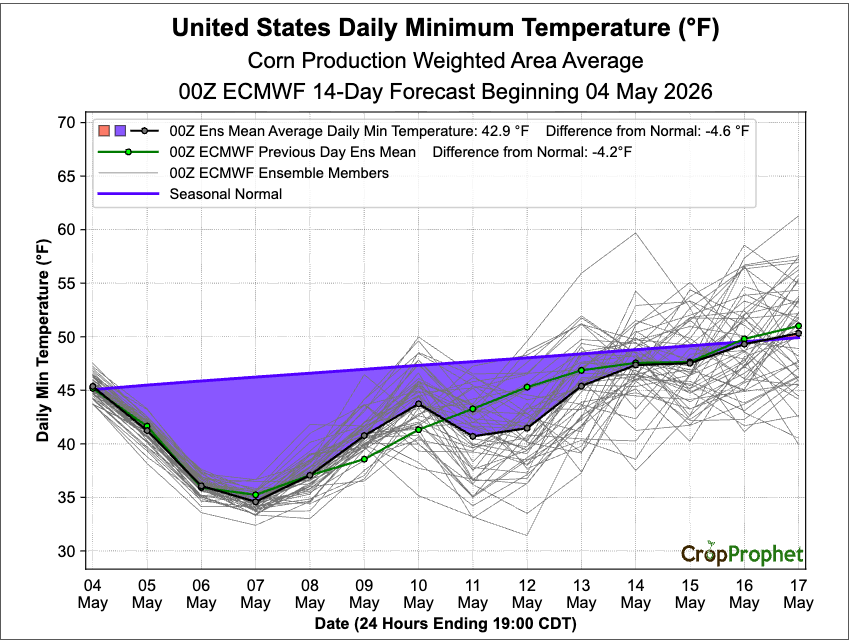
Minimum temperatures have fallen outside the 90% historical range over the past two days on a U.S. corn production-weighted basis.
Notably below-normal minimum temperatures are forecast to persist across U.S. corn production regions over the next 1 to 10 days.
Let us know in the comments whether frost has impacted you.
#OATT #AgWx #AgWeather #Corn #Frost #Plant2026
1
3
12
1,823
Jan Dutton retweeted
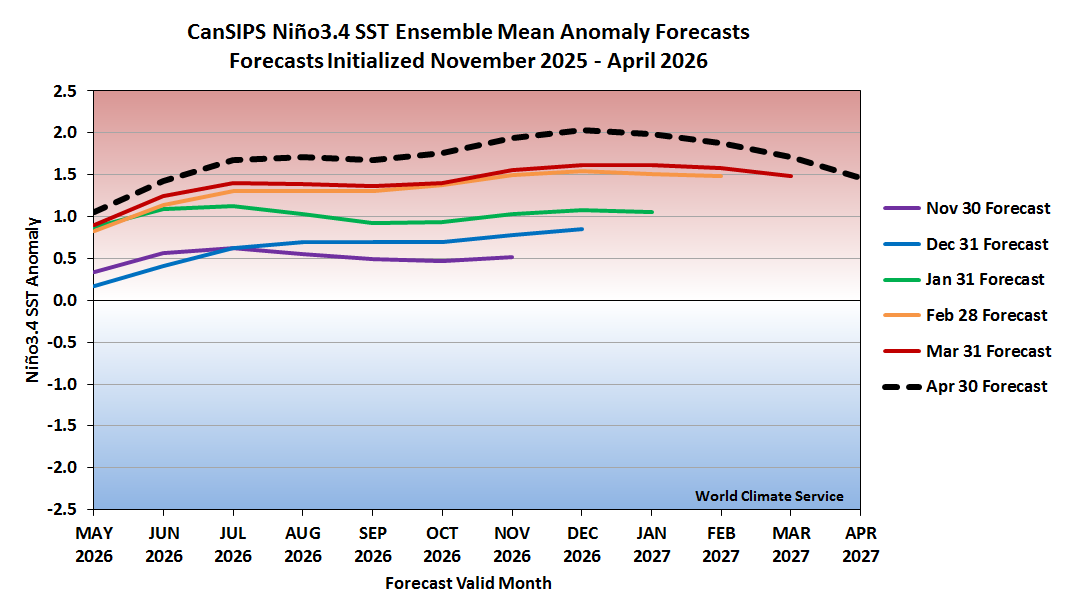
Yet another leg up in today's CanSIPS Niño3.4 forecast update.
The ensemble mean shows 9 months above 1.5°C anomaly. The ERSSTv5 record (1991-2020 baseline) is 8 consecutive months in 1997-98 and 2015-2016.
4
18
80
10,617
Jan Dutton retweeted
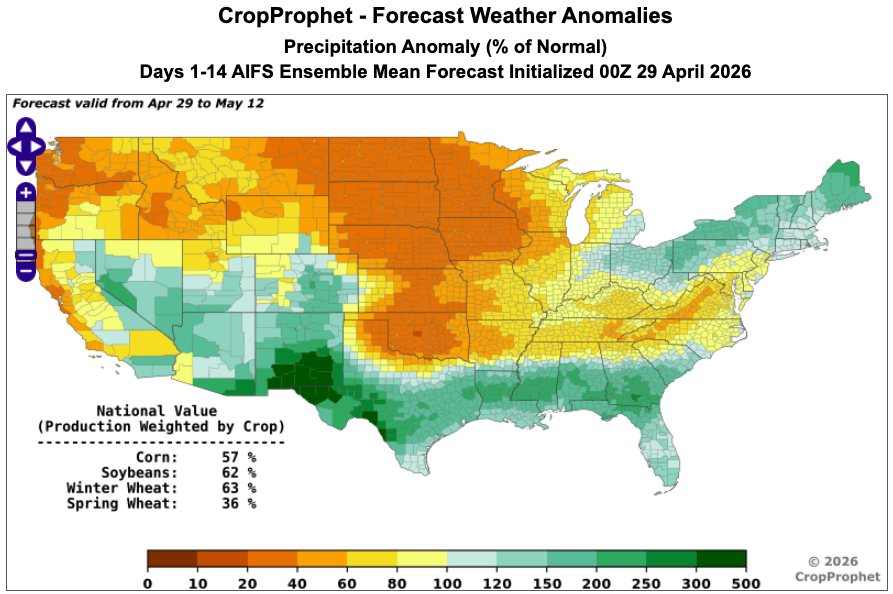
Apr 29
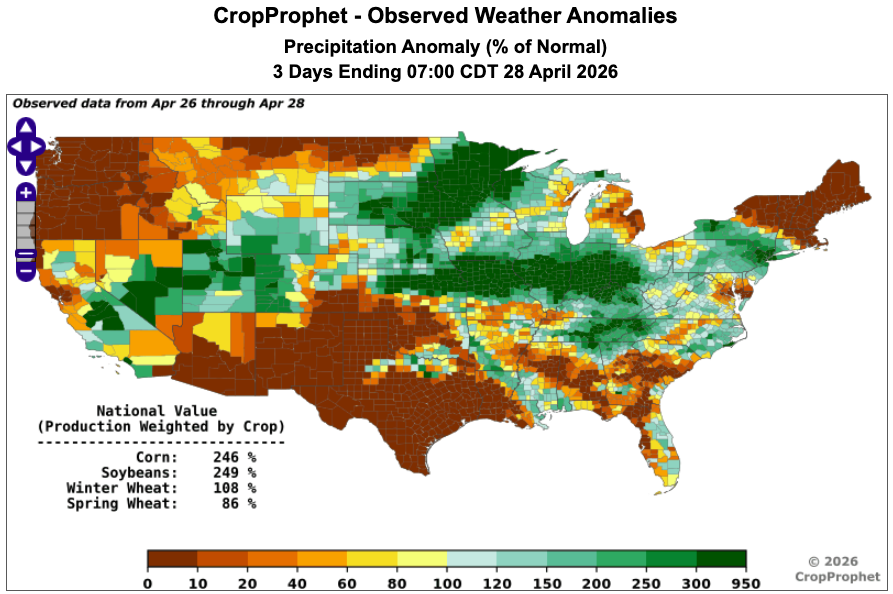
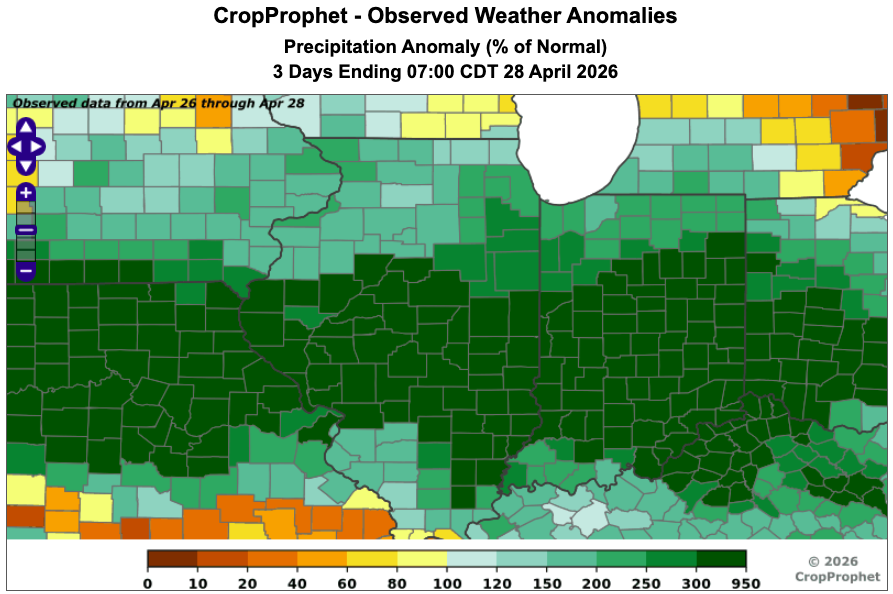
Heavy precipitation has impacted northern Missouri, Illinois, Indiana, and western Ohio over the past 3 days.
Some counties have received over 400% of normal precipitation during that time period.
The good news is that the AIFS is predicting notable dry conditions over the next 2 weeks for the corn belt.
#oatt #AgWx #AgWeather #Corn #Plant2026
7
19
4,736
Jan Dutton retweeted
Apr 28
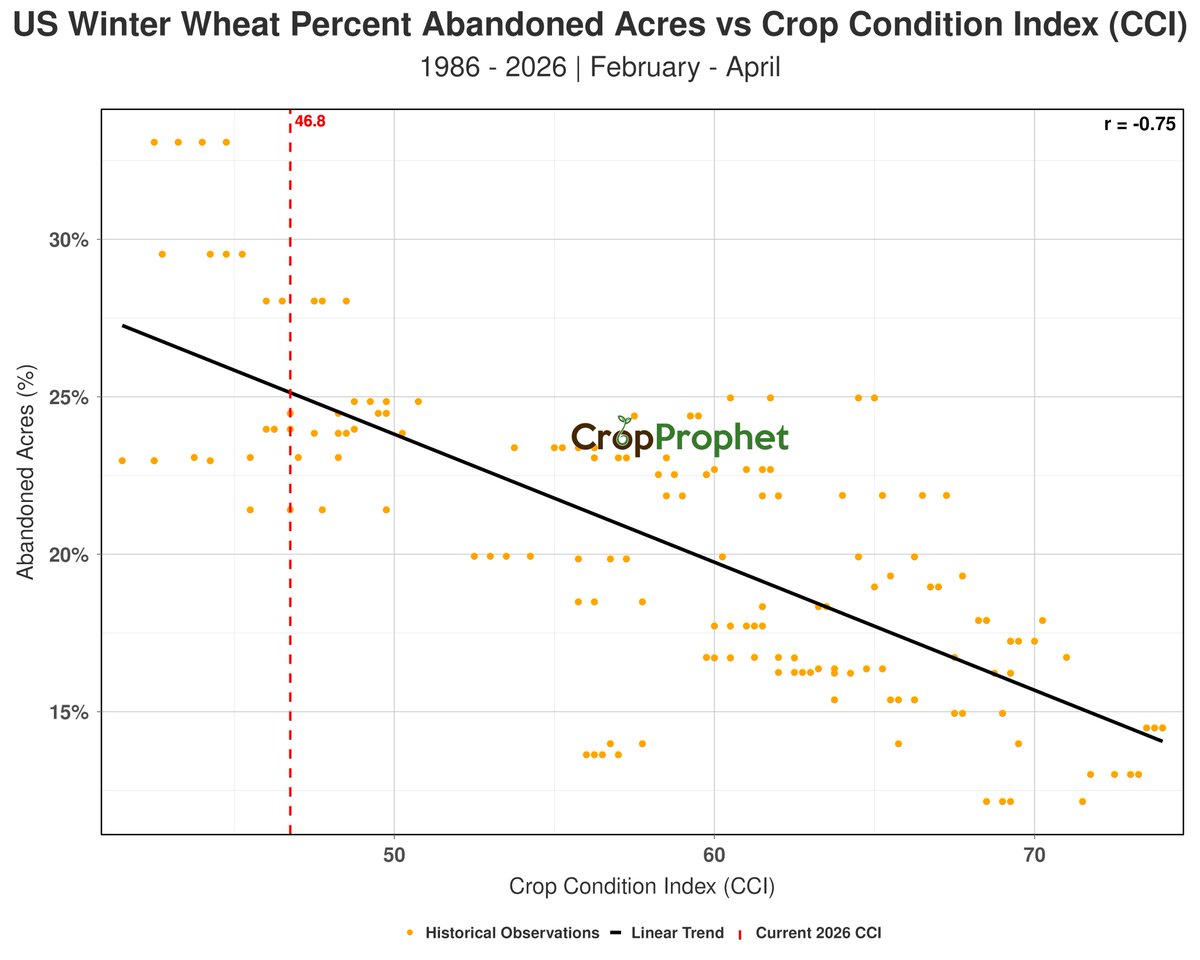
And, to follow up on @ArlanFF101's point, here is the crop condition index (i.e., the CCI) vs. winter wheat abandonment.
Apr 28
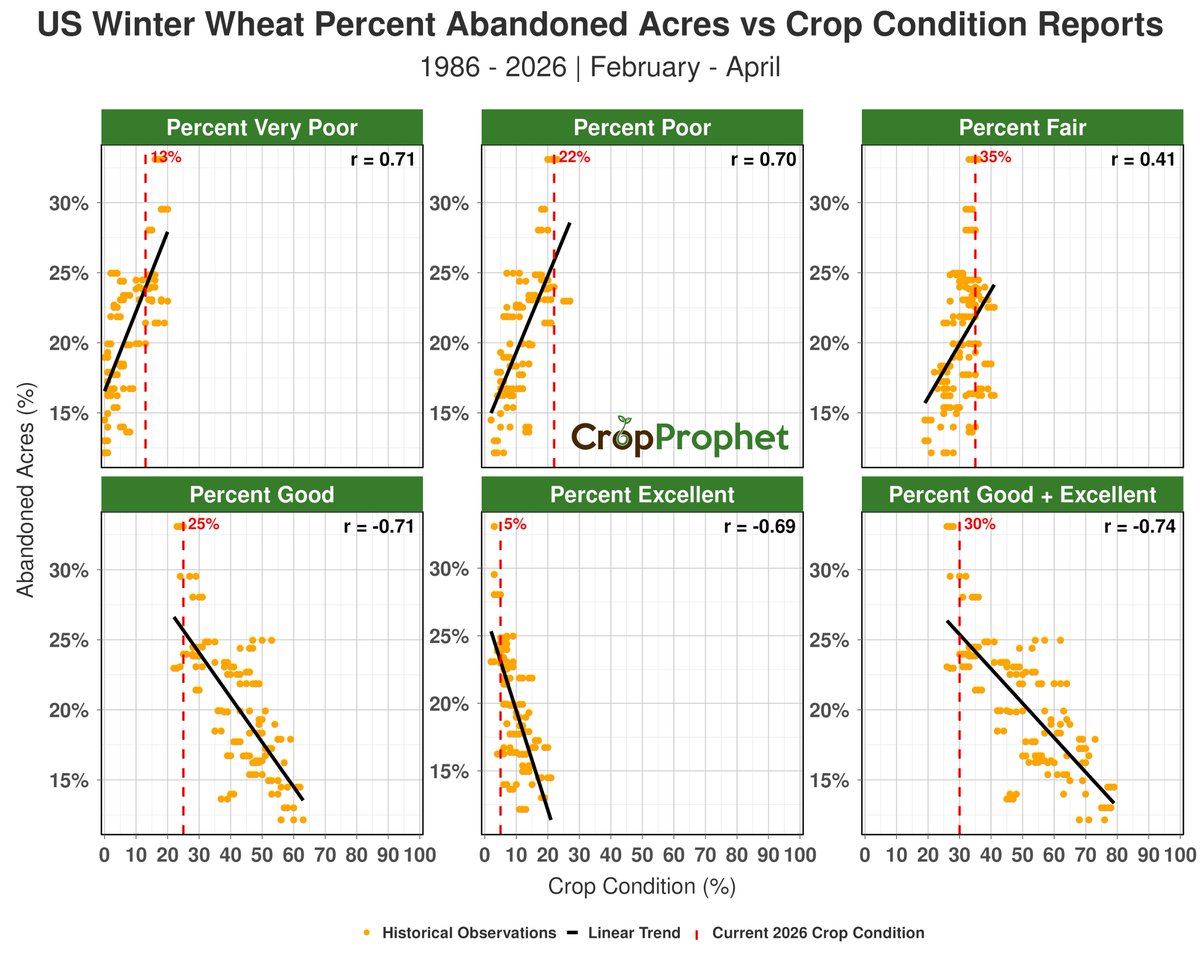
@ScottIrwinUI "Does anyone know?" inspired an analysis. The short answer is "Yes," although we examined G E%. At low G E%, the abandonment can exceed the linear relationship.
3
9
1,793
Jan Dutton retweeted
The SPB is significantly overcome by April. We don't have to wait until June to have a very good idea what's going to happen.
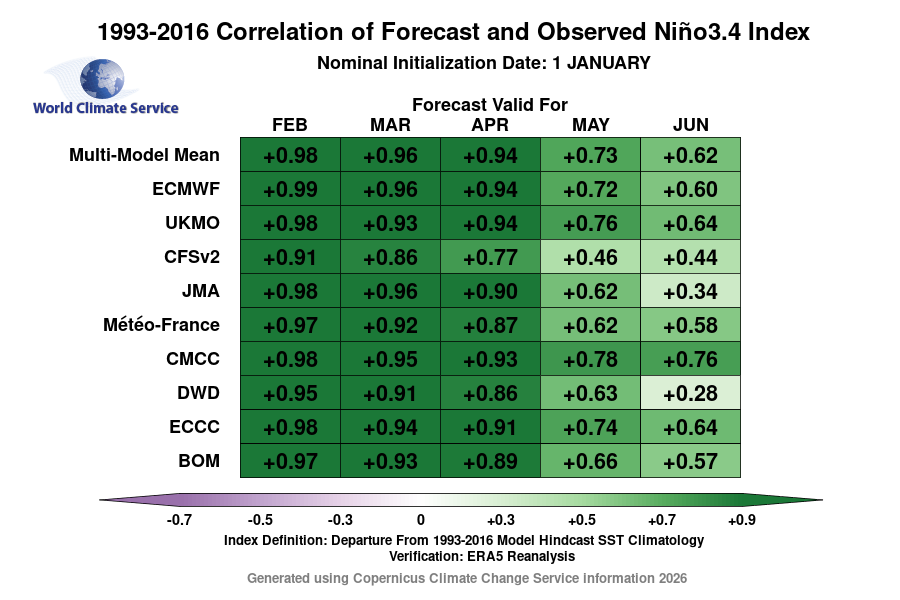
1
4
37
5,326
Jan Dutton retweeted
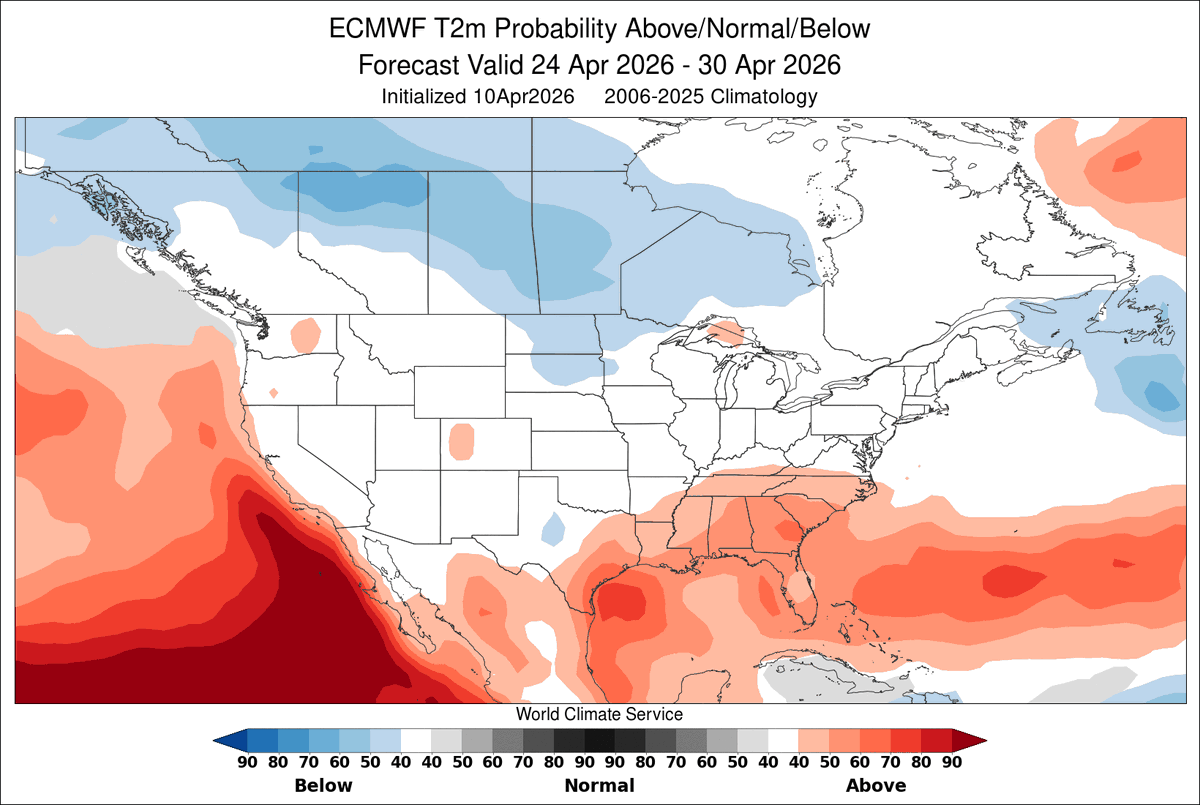
Increasingly summer-like heat will exacerbate rapidly worsening drought in the U.S. Southeast in the next 10 days, and perhaps beyond

2
2
25
2,433
Jan Dutton retweeted
Apr 8
With U.S. corn planting underway, current March through May U.S. corn production-weighted cumulative precipitation for 2026 is tracking above climatology and above many historical years shown in the 1981 to 2025 background distribution.
The chart also indicates that the 00z ECMWF forecast would keep cumulative precipitation rising over the next 14 days, maintaining a wetter-than-normal pattern relative to climatology.
Follow our Twitter feed for additional updates on weather conditions affecting the 2026 U.S. growing season.
#oatt #AgWx #AgWeather #USDA #Corn #Plant2026

6
18
5,090