
postdoctoral fellow @martienssenlab @cshl
Joined September 2016
- Tweets 230
- Following 212
- Followers 236
- Likes 375
8 Photos and videos


Pinned Tweet

23 Feb 2024
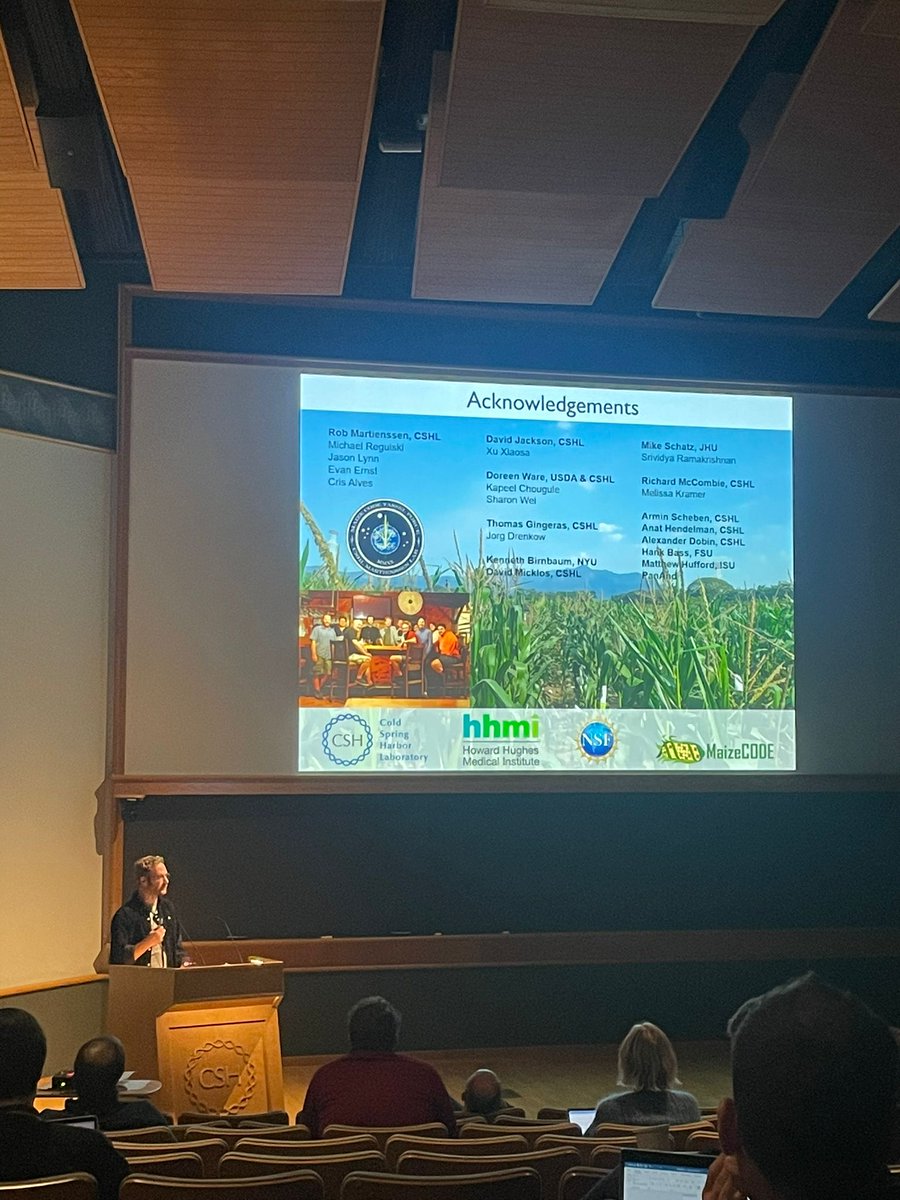
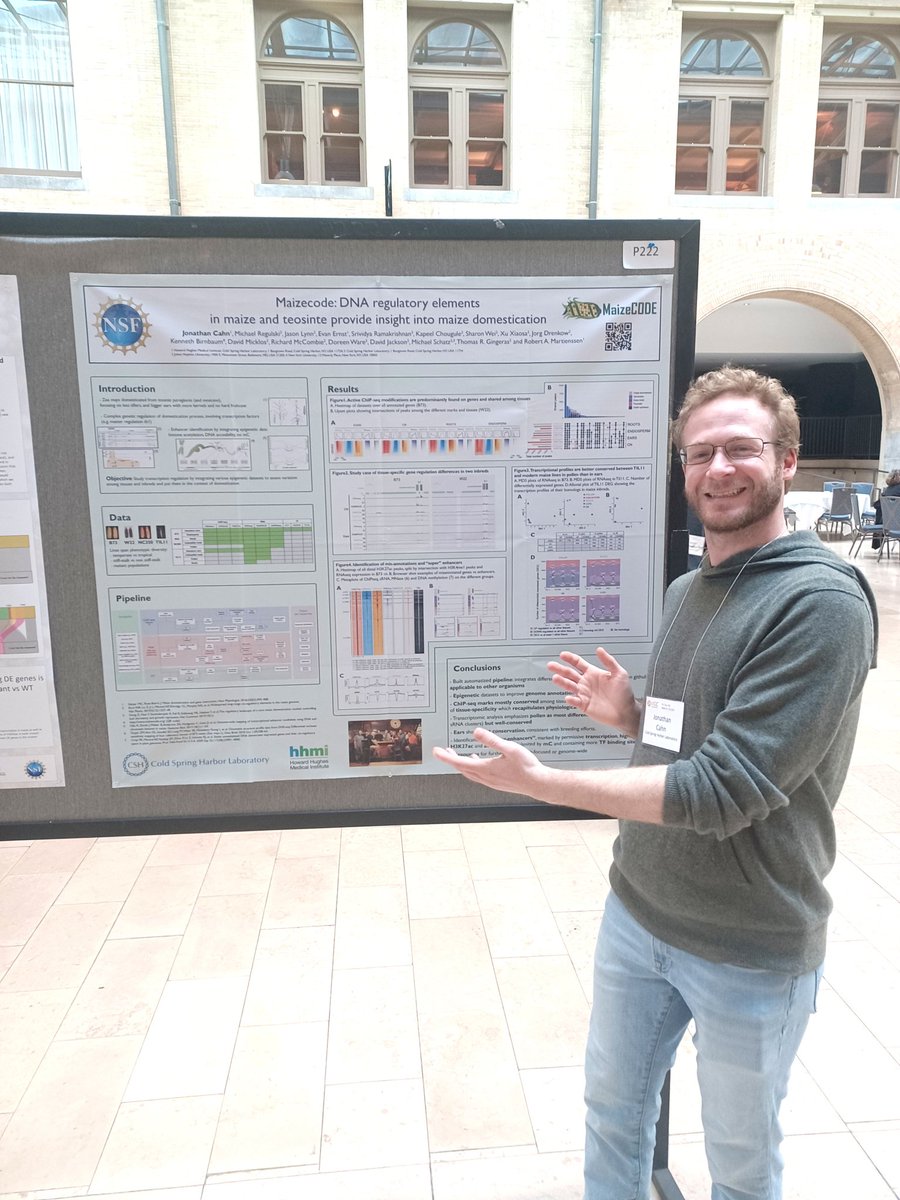
The MaizeCODE paper is on BioRXiv! New insights on enhancers in plants and a lot of data for every maize (epi)geneticist to play with, including on teosinte, the ancestor of maize. A big team effort, very grateful to everyone involved!
biorxiv.org/content/10.1101/…
3
24
67
6,419
Jonathan Cahn retweeted

2 Jan 2025
Centrophilic retrotransposon integration via CENH3 chromatin in Arabidopsis @Nature from Tetsuji Kakutani & colleagues - beautiful insights into control of transposon insertion into the centromeres
nature.com/articles/s41586-0…
3
47
108
11,438
Jonathan Cahn retweeted

12 Dec 2024
Ever wondered how transcription choreographs histone modifications? Our work reveals the basis of co-transcriptional H3K36me3 by SETD2. We visualize how a histone writer coordinates with the transcription machinery! This is the magnus opus of @MarkertJon tinyurl.com/setd2
12
128
503
75,923
Jonathan Cahn retweeted

11 Dec 2024
Interested in chromatin and transcription in plants?🌱🧬 looking for a lab to do a postdoc? 🤓 our lab invites applicants for the following calls: #JuanDeLaCierva from @AgEInves tinyurl.com/y78ueh5v and #CIAPOS from @GVAeducacio tinyurl.com/bmrex8cc Interested, please PM!!
5
47
93
8,986
Jonathan Cahn retweeted

4 Dec 2024
The Slotkin lab is hiring for an exciting project that involves gene editing, transposable elements and plant transformation! Please RT! paycomonline.net/v4/ats/web.…
3
73
85
11,200
Jonathan Cahn retweeted

6 Nov 2024
My co-first author paper now out in @Nature
SWR1 specifically exchanges H2A/H2B dimers for Htz1/H2B dimers in nucleosomes. Here we show double dimer exchange can be processive, explaining how SWR1 ‘proofreads’ dimer identity in a nucleosome.
nature.com/articles/s41586-0…
1
24
118
11,758
Jonathan Cahn retweeted

5 Nov 2024
It is my absolute pleasure to share my incredible postdoc Dawei's @amaizeingcorn manuscript on epigenetics and aging in Arabidopsis. It is the work I am most proud of thus far in my career, and every figure has a breakthrough that we are excited about
biorxiv.org/cgi/content/shor…
3
49
137
33,124
Jonathan Cahn retweeted

30 Oct 2024
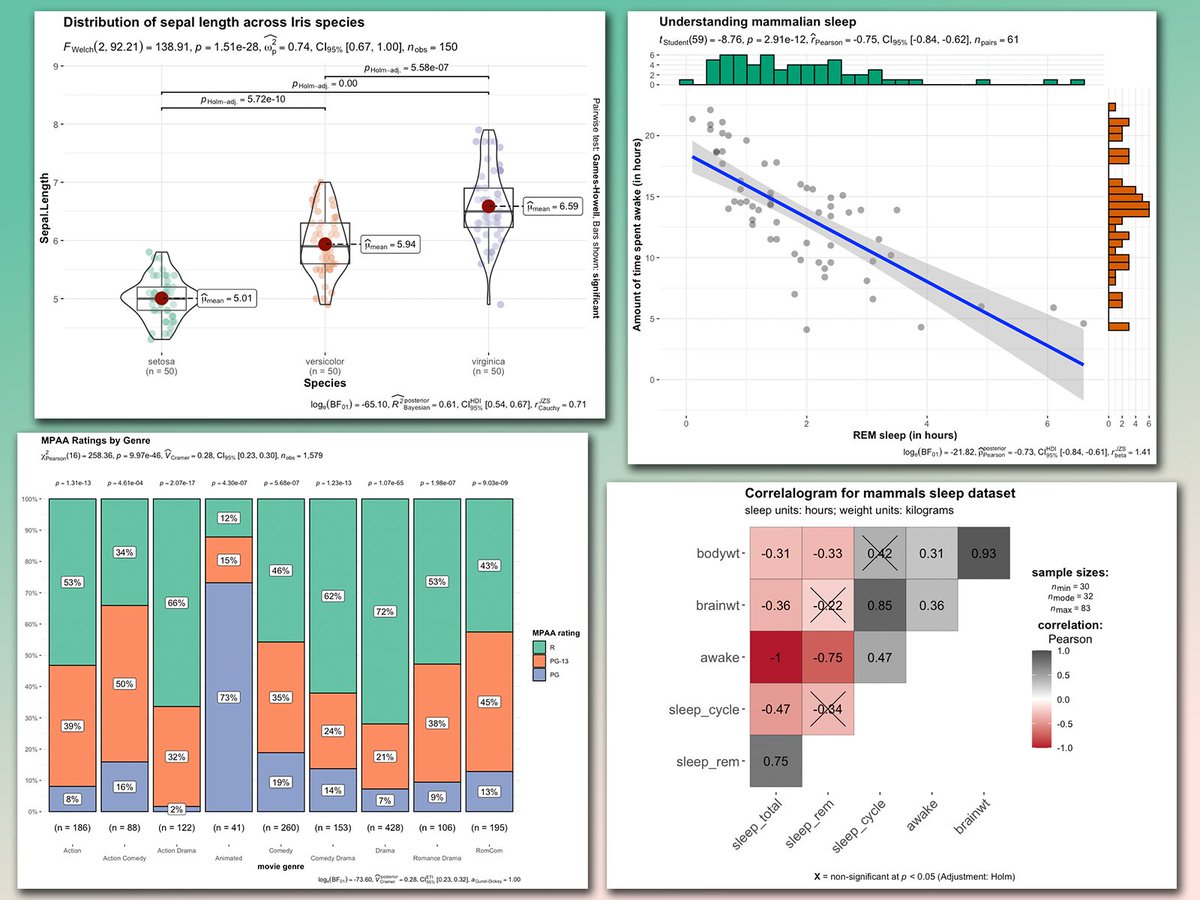
Looking to add statistical insights directly to your ggplot2 visualizations? The ggstatsplot package simplifies this by incorporating statistical tests, effect sizes, and other analyses right within your plots.
✔️ Enhanced Visuals: Automatically includes statistical information in your plots, providing clear insights without the need for extra steps.
✔️ Wide Range of Analyses: Supports various statistical tests, including t-tests, ANOVAs, correlations, and more, making it versatile for different types of data sets.
✔️ Customizable Output: Lets you control which statistical details are displayed and customize the appearance of plots, ensuring clarity and focus on key findings.
✔️ Seamless Integration: Designed to work directly with ggplot2, using the same syntax and functions you’re already familiar with.
The visualizations shown here are from the package website and demonstrate how ggstatsplot integrates statistical results seamlessly into ggplot2 graphics: github.com/IndrajeetPatil/gg…
Want to deepen your knowledge of ggplot2 and learn how to create informative visualizations? Join my online course, “Data Visualization in R Using ggplot2 & Friends,” starting on November 25, 2024!
Claim the early bird promotion before it closes on November 6.
Further details: statisticsglobe.com/online-c…
#DataVisualization #Statistical #programmer #VisualAnalytics #database
140
669
49,678
Jonathan Cahn retweeted

29 Oct 2024
Have we been over-estimating the impact of m6A? Possibly! We present our evidence here @NewPhyt
nph.onlinelibrary.wiley.com/…
"mRNA ADENOSINE METHYLASE promotes drought tolerance through N6‐methyladenosine‐dependent and independent impacts on mRNA regulation in Arabidopsis"
2
10
28
3,206
Jonathan Cahn retweeted

24 Oct 2024
The dual trxG/PcG protein ULTRAPETALA1 modulates H3K27me3 and directly enhances POLYCOMB REPRESSIVE COMPLEX 2 activity for ... biorxiv.org/cgi/content/shor… #biorxiv_genetic
1
11
18
13,389
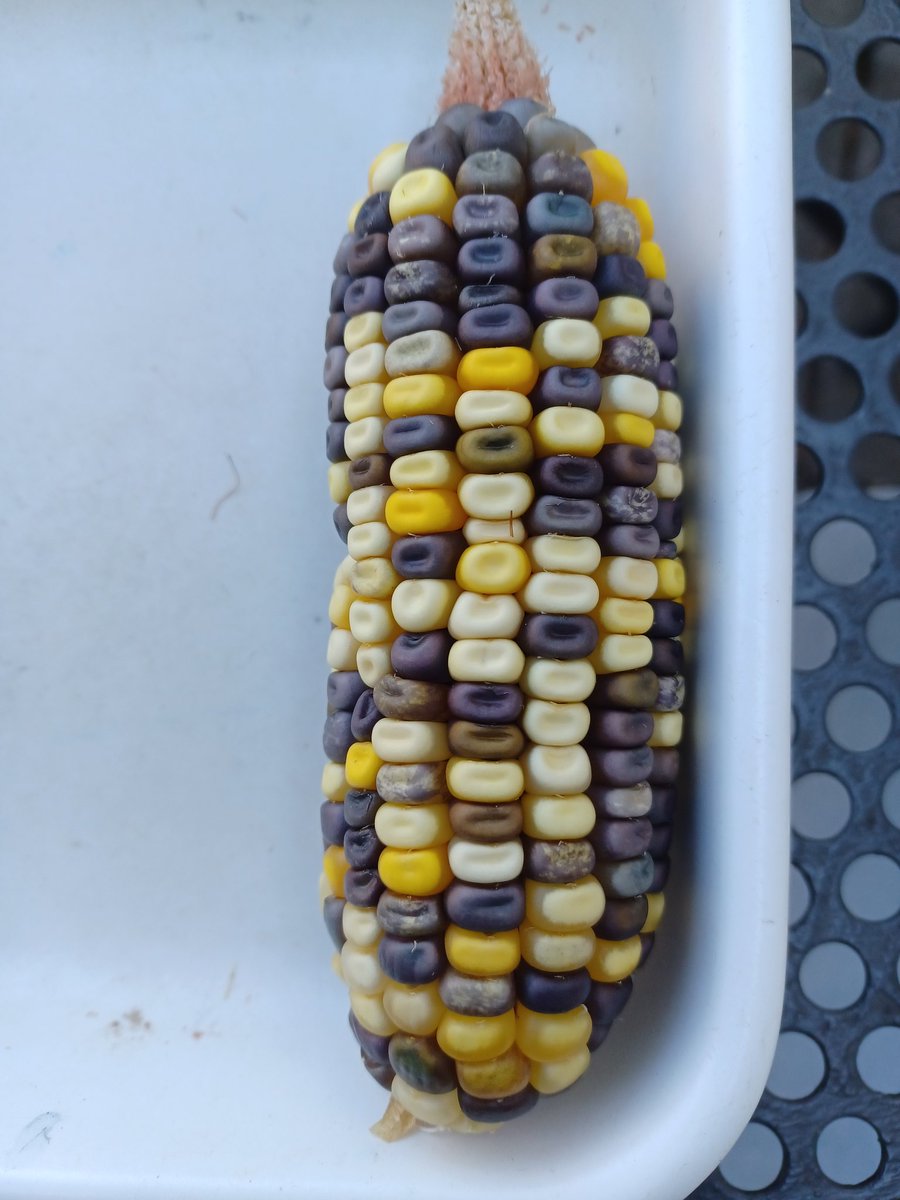
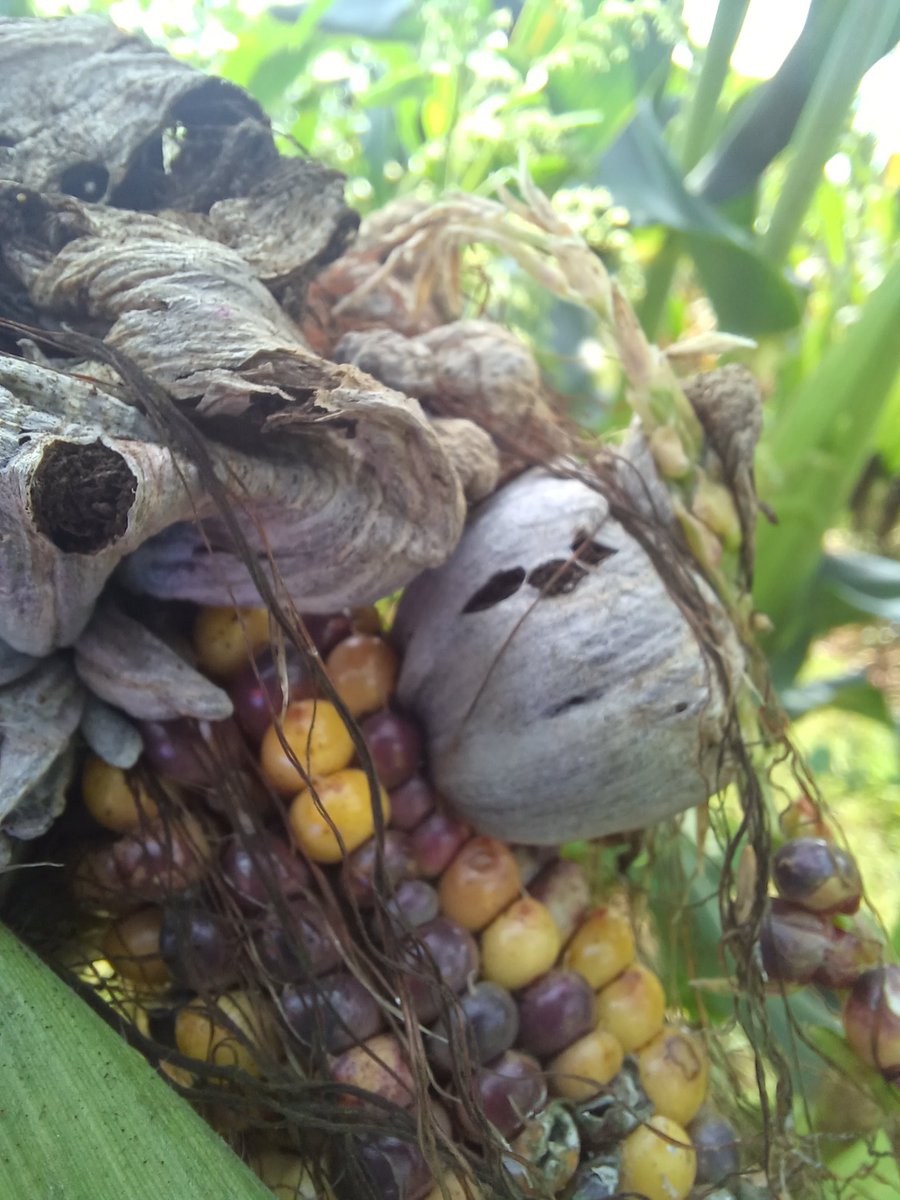
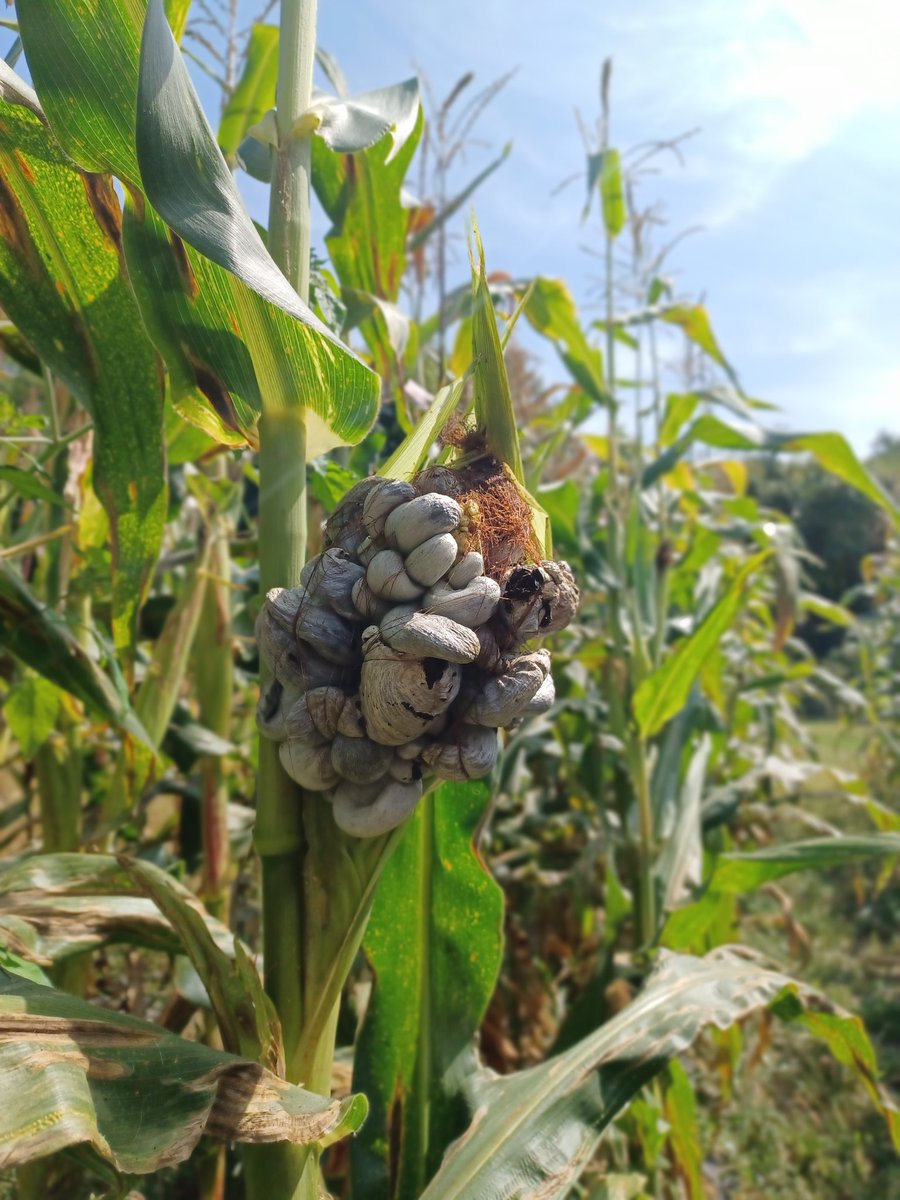
21 Oct 2024
Shelling season is like a box of chocolate.. and this is a particularly beautiful and genetically complex one!
4
23
1,015
Jonathan Cahn retweeted

14 Oct 2024
Very proud to share our second pre-print of the year, this time on the positive crosstalk between DNA methylation and Polycomb-group proteins at Arabidopsis transposable elements (TEs):
biorxiv.org/content/10.1101/…
8
37
126
13,302
Jonathan Cahn retweeted

14 Oct 2024
New preprint! An atlas of conserved TF binding sites across flowering plants generated with multiplexed DAP-seq. When integrated with multi-species snRNA- and snATAC-seq reveals how TF activity shapes development and stress responses at the cellular level.biorxiv.org/cgi/content/shor…
1
48
103
15,626
Jonathan Cahn retweeted

30 Sep 2024
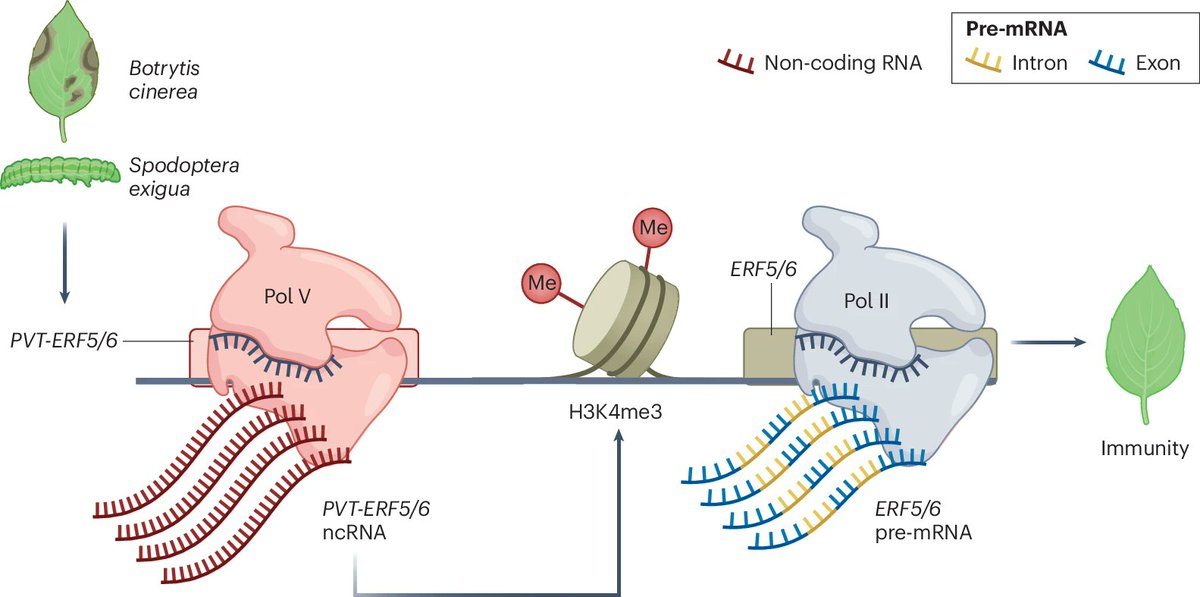
New Article: "An RdDM-independent function of Pol V transcripts in gene regulation and plant defence" rdcu.be/dVzZd
With News & Views: "RNA polymerase V: From RdDM to plant defence" rdcu.be/dVz0c
10
36
6,908
Jonathan Cahn retweeted

Now out in Nature Communications! With additional data documenting reduced DNA methylation associated with DNG targets in pollen - nature.com/articles/s41467-0…

New! Methylation-controlled gene regulation in maize pollen, led by Jonathan Gent (@corncolors group). Tldr: Two maize DNA glycosylases (DNGs, which demethylate DNA) redundantly enable high transcript levels of a small set (~50) of pollen-specific genes, biorxiv.org/content/10.1101/…
2
10
31
4,660
Jonathan Cahn retweeted

20 Sep 2024
🚨 Excited to share this #preprint from my postdoc in the Lippman lab @CSHL, in collab. with @mike_schatz & many others! Using pan-genomics & pan-genetics across the Solanum genus 🍅🥔🍆 we reveal gene duplications 🧬 as contingencies in crop engineering. doi.org/10.1101/2024.09.10.6…
7
44
135
10,880
Jonathan Cahn retweeted

19 Sep 2024
Fun outreach from our highland adaptation grant. A video game for primary school kids to learn about maize, evolution, and archaeology. play.google.com/store/apps/d…
3
9
32
3,337
Jonathan Cahn retweeted

17 Sep 2024
Happy to announce that the PEpiTE lab is officially open since 2 weeks now at the Institute of Biology of @ENS_ULM in Paris! Studying all things related to Polyploidy, Epigenetics and TEs - feel free to get in touch for postdocs / PhD/ Master opportunities! @IBENS_ENS @psl_univ
15
27
104
9,255
Jonathan Cahn retweeted

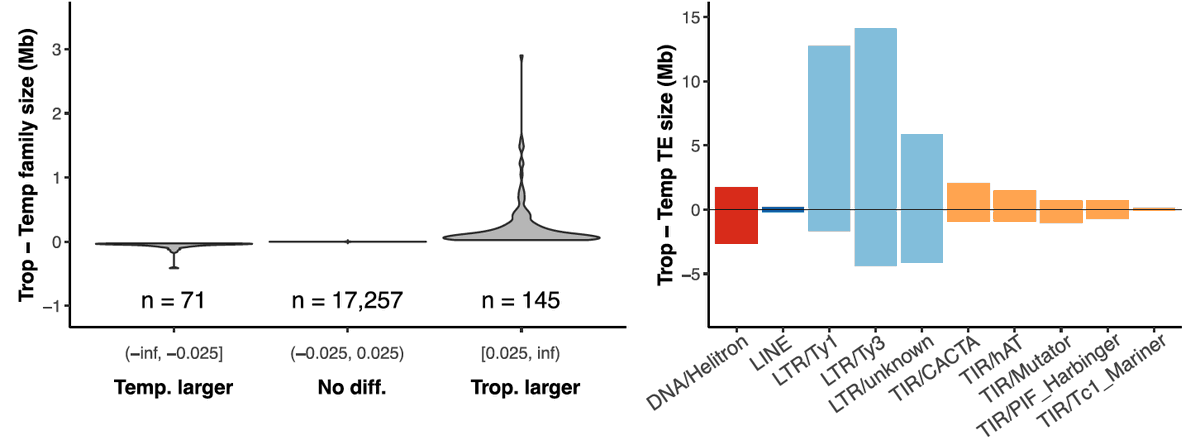
13 Sep 2024
How TEs gain and lose between tropical and temperate maize inbreds? We found that tropical corns have 35Mb more TEs than temperates, and it's mainly due to a small number of LTR families that are young, less methylated, and more expressed in tropical maize.pubmed.ncbi.nlm.nih.gov/3925…
1
26
92
8,328