
👋 I’m a cartographer & information designer who loves maps, graphic design, and interactive viz.
Joined April 2009
- Tweets 2,130
- Following 404
- Followers 768
- Likes 4,486
174 Photos and videos


Phoebe L. retweeted

27 Nov 2025
At a festival with events happening over a week and over a whole city? Dilara Bozkurt explores temporal navigation for festival maps on mobile devices, working out how to incorporate space and time on a small screen like a mobile phone doi.org/10.1080/15230406.202… #GISchat #OpenAccess
5
3
413
Phoebe L. retweeted

19 Sep 2025
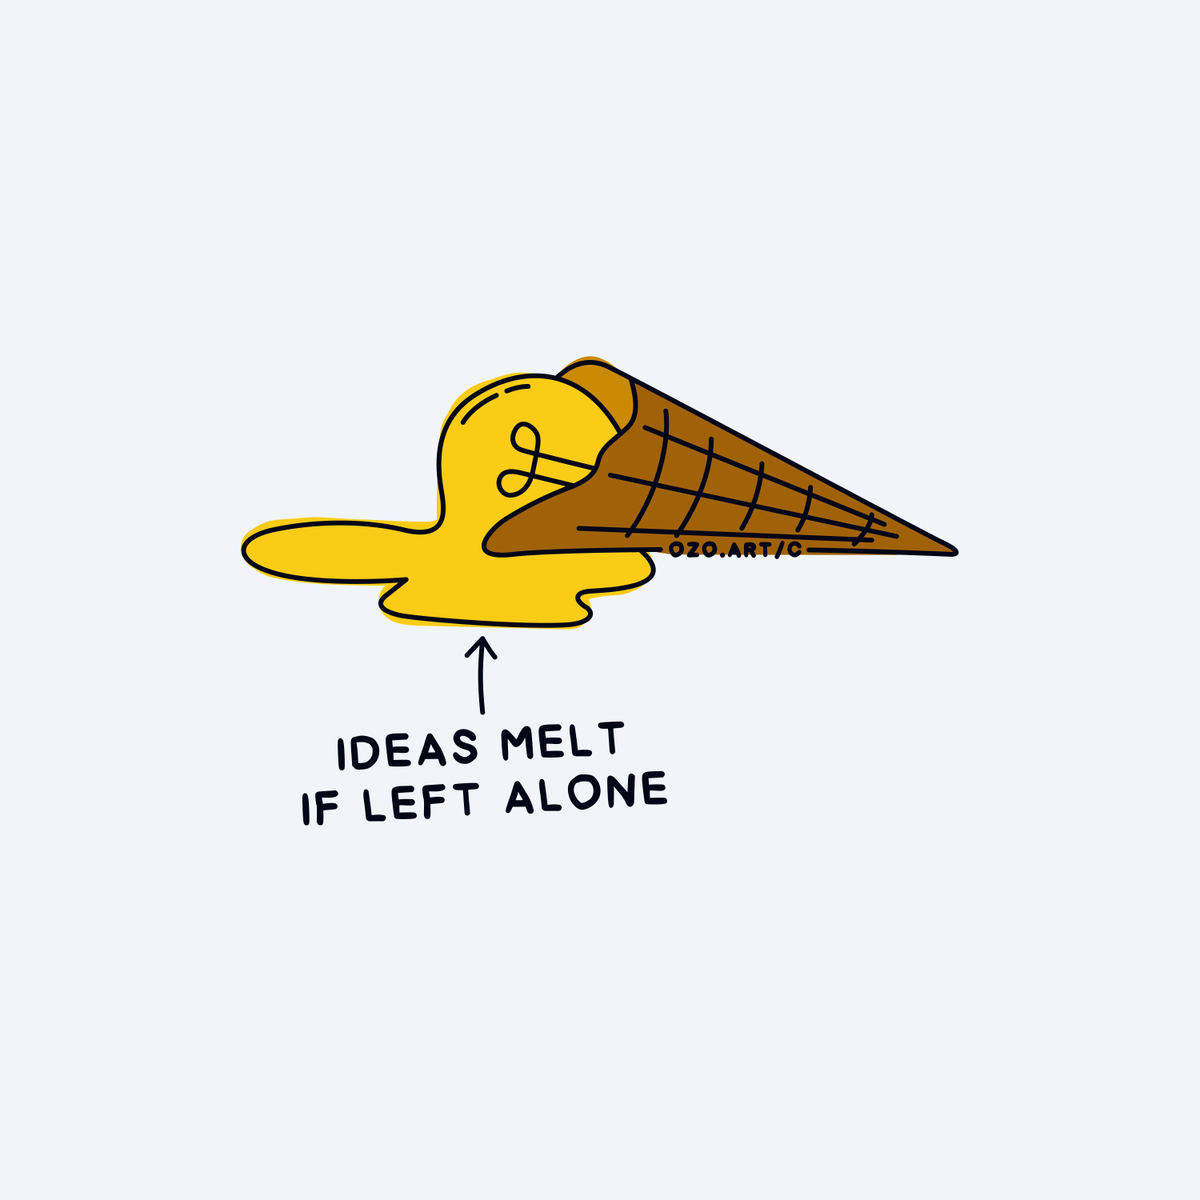
Act fast, store properly, or your ideas will fade away.
10
15
172
10,659

1
20
790
Phoebe L. retweeted

26 Nov 2024
This edition of the Data Vis Dispatch takes us from the ocean to the moon and beyond!
See the week's best data visualizations on our blog: blog.datawrapper.de/data-vis…

ALT Small multiple maps show ships connected side by side in the South China Sea, indicating possible illicit oil transfers. The number of possible transfers has more than doubled over the five years shown, from 204 (5% of ships) in 2020 to 570 (10.3%) in 2024. Published in Bloomberg.
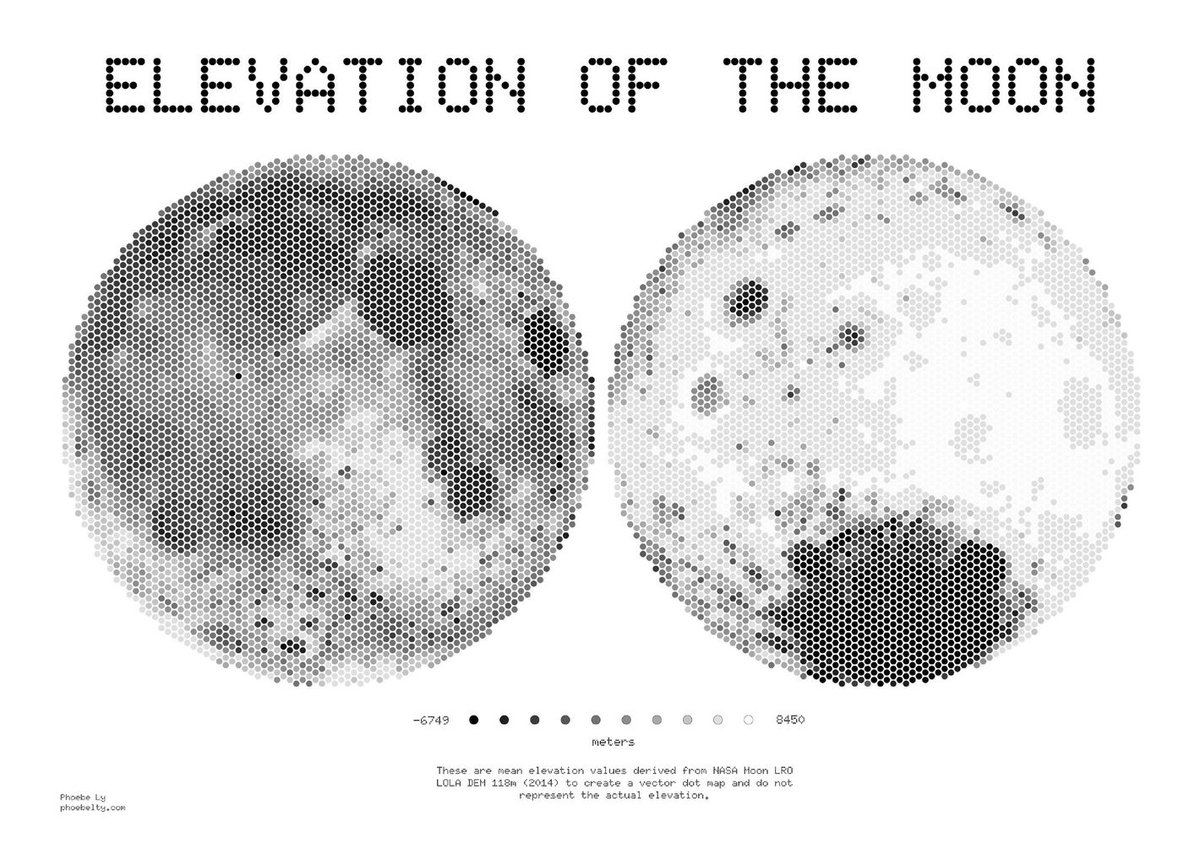
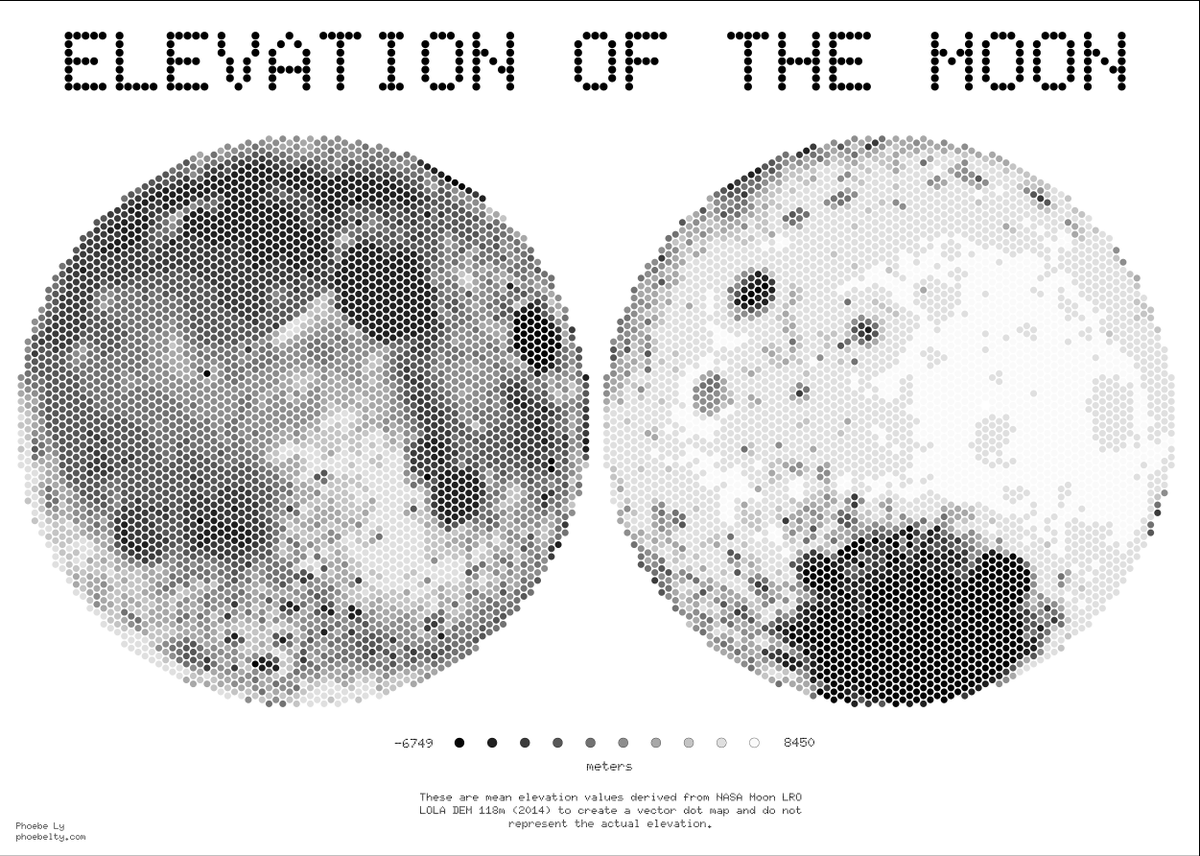
ALT An elevation map of the moon's surface, using dots on a grayscale from dark to light. Created by Phoebe Ly.
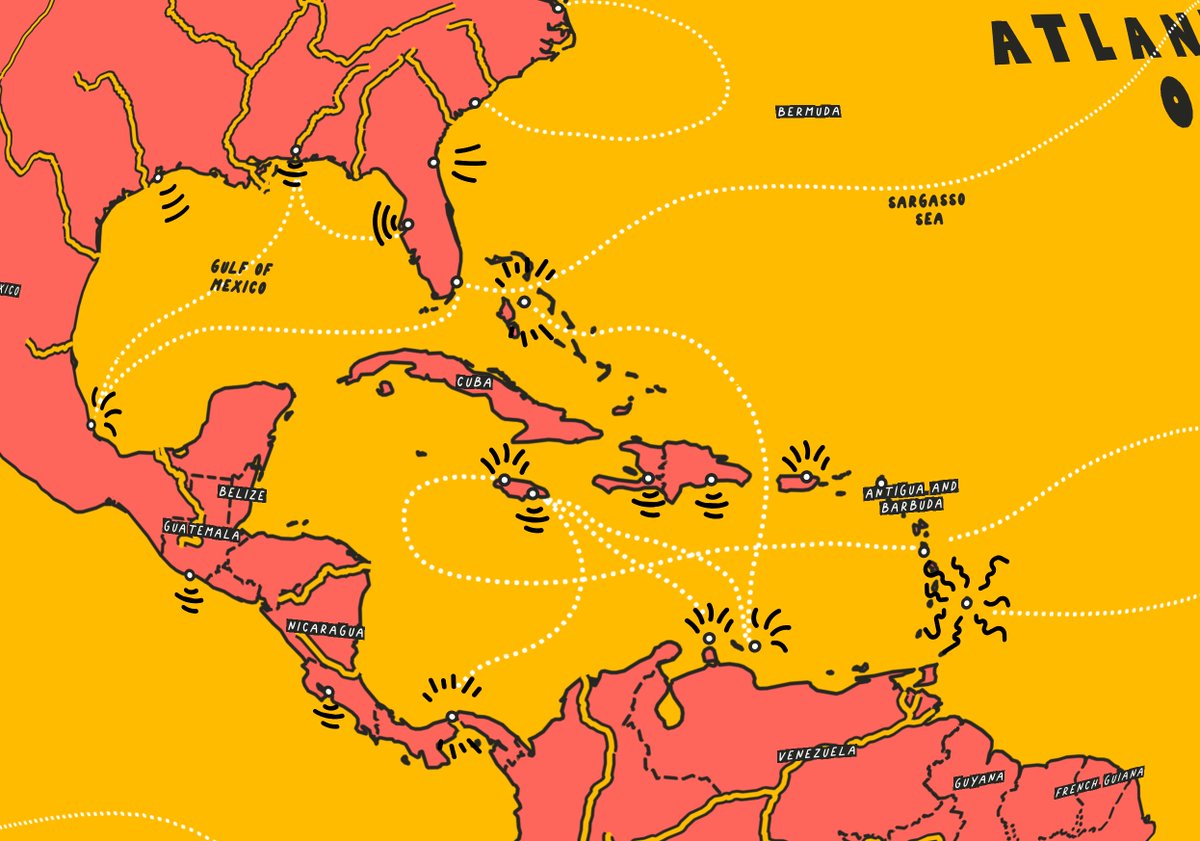
ALT A map of the Gulf of Mexico drawn in the style of Keith Haring. From Mapbox.
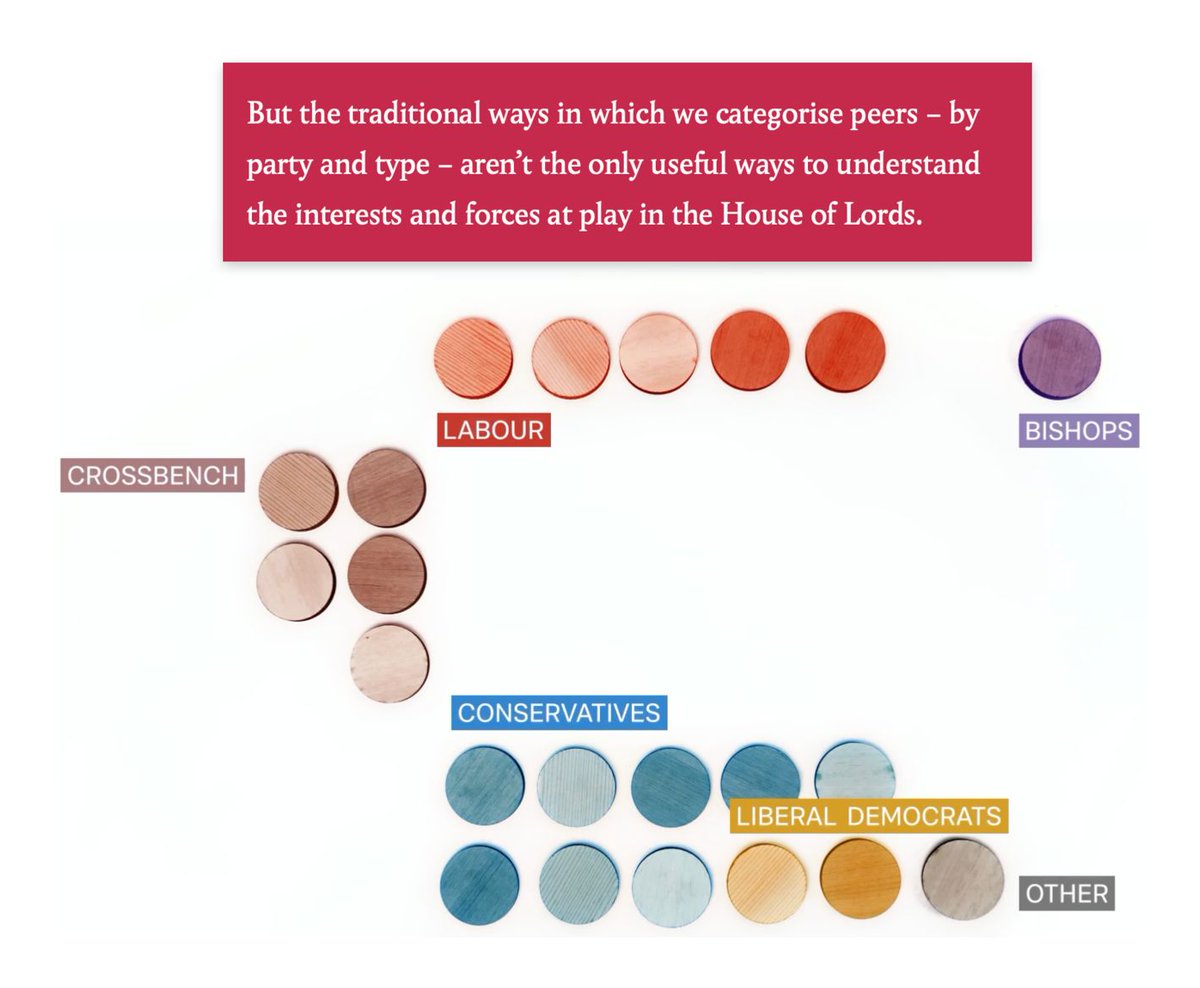
ALT Colored wooden discs represent groupings of peers in the House of Lords, including bishops and crossbenchers as well as political parties. Published in Tortoise Media.
14
57
4,110
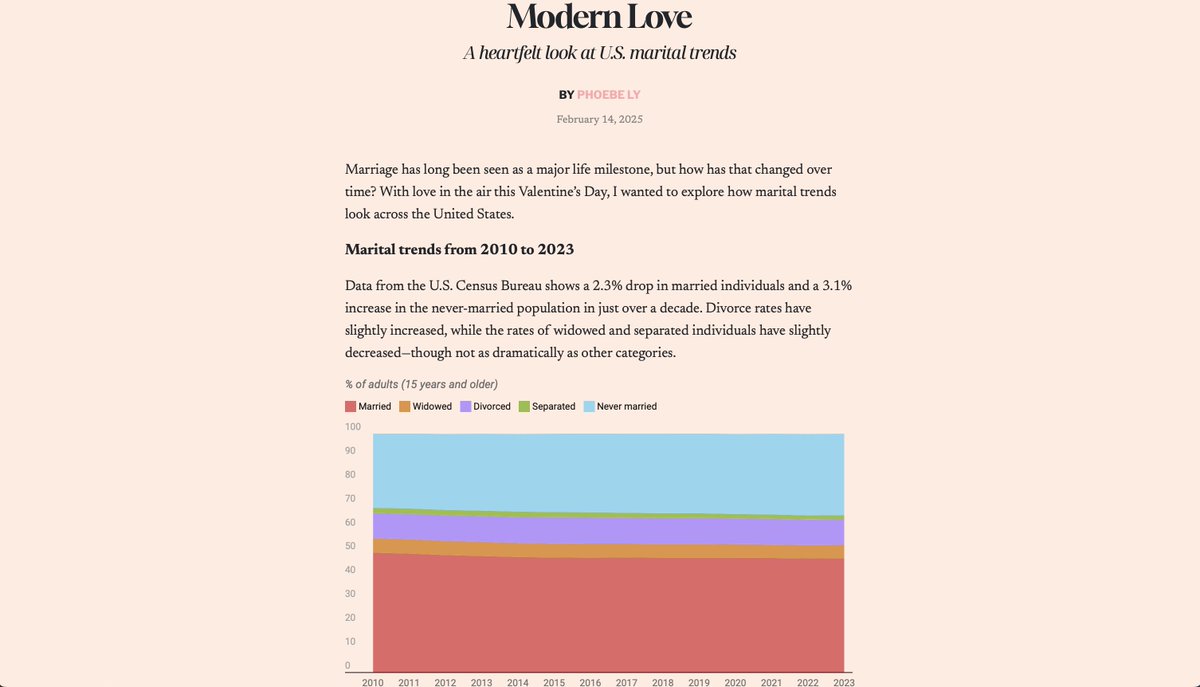
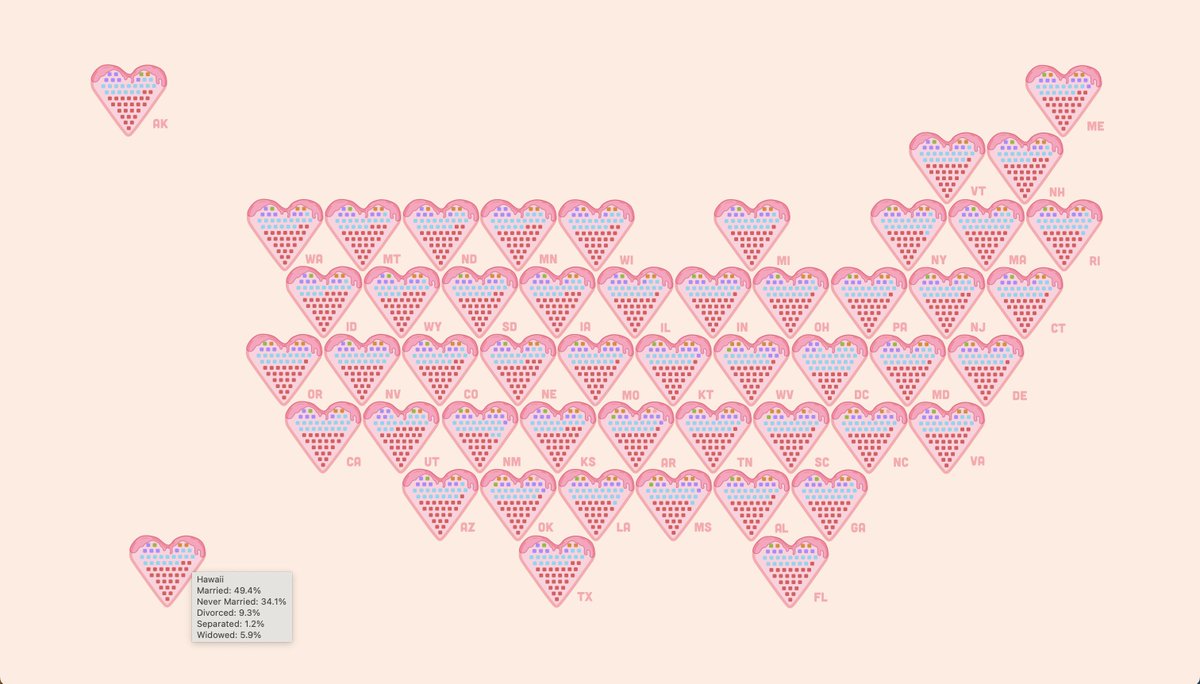
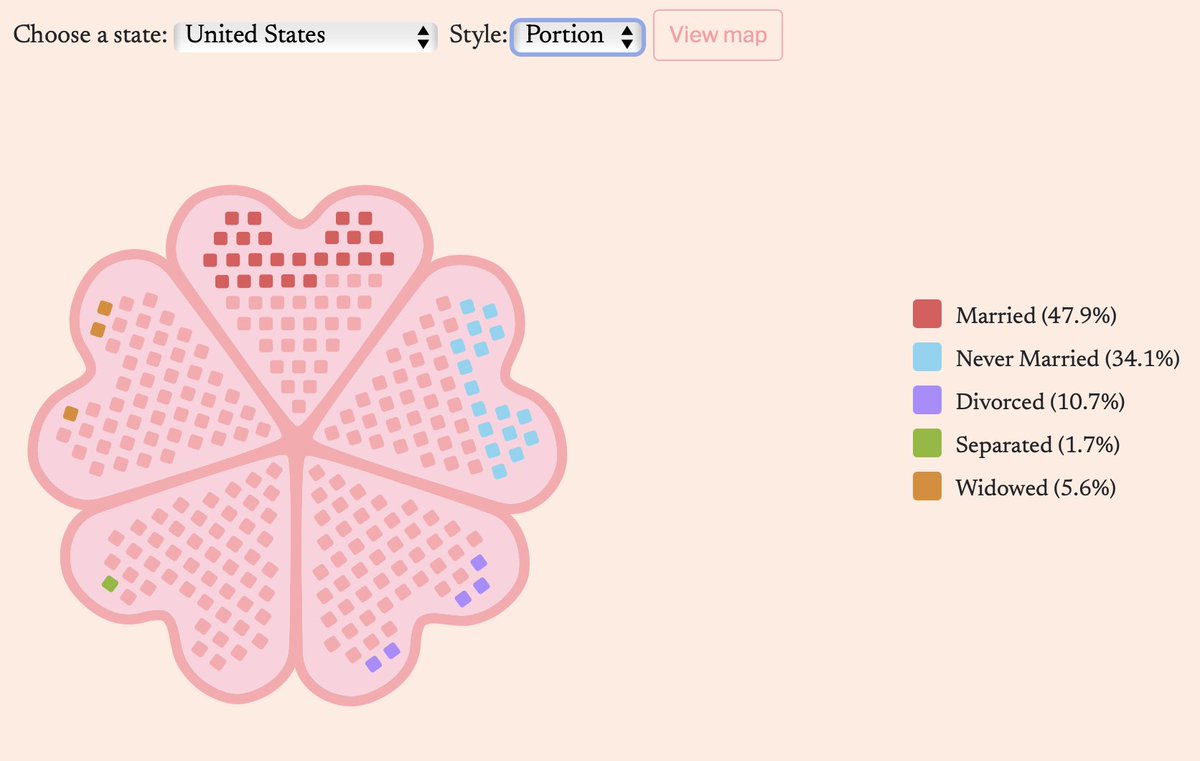
I made something for #ValentinesDay that explores the #US marital trends in the last decade. No matter what your relationship status is, love takes many forms.🩷 I had fun customizing a heart waffle (herzwaffeln) chart! Other charts made with @Datawrapper. modernlove.netlify.app/

1
1
7
467
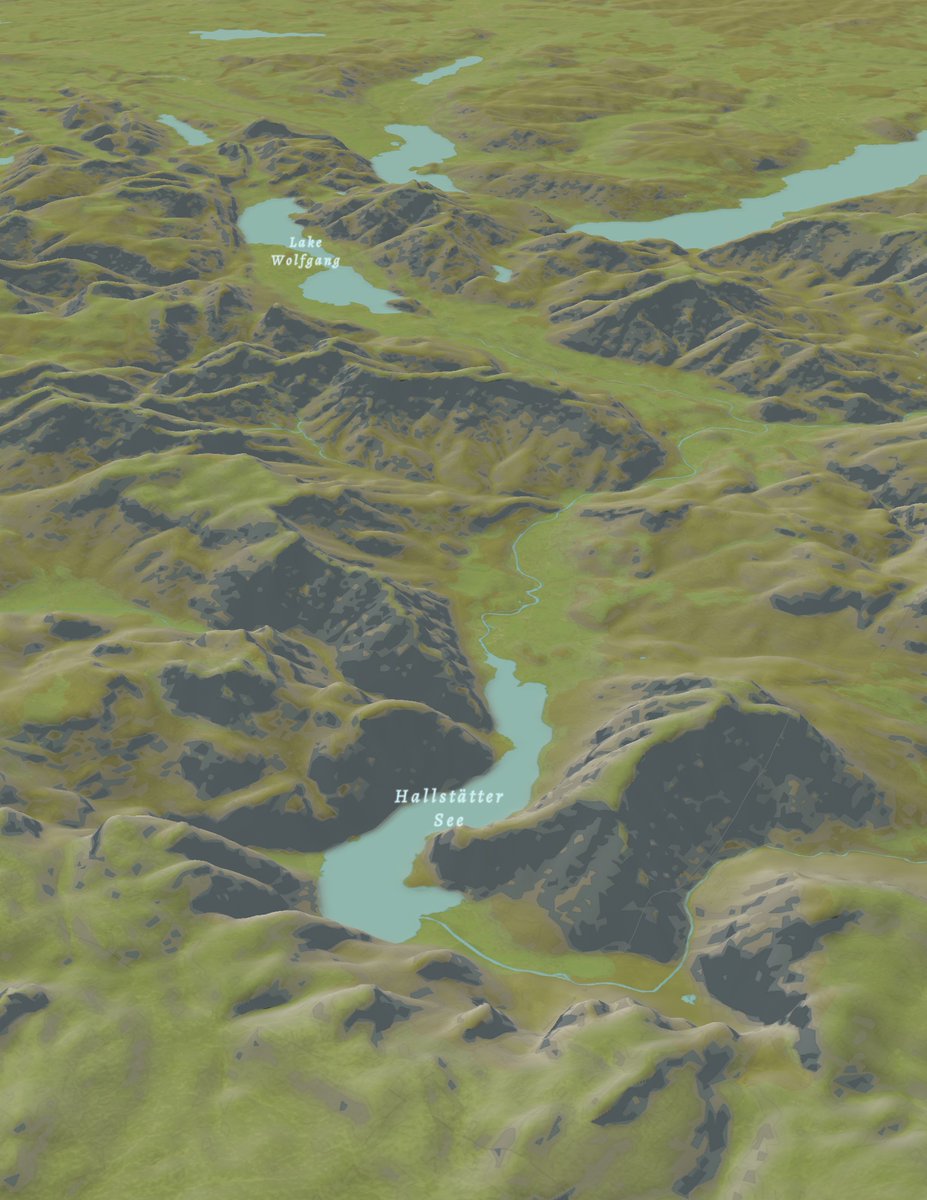
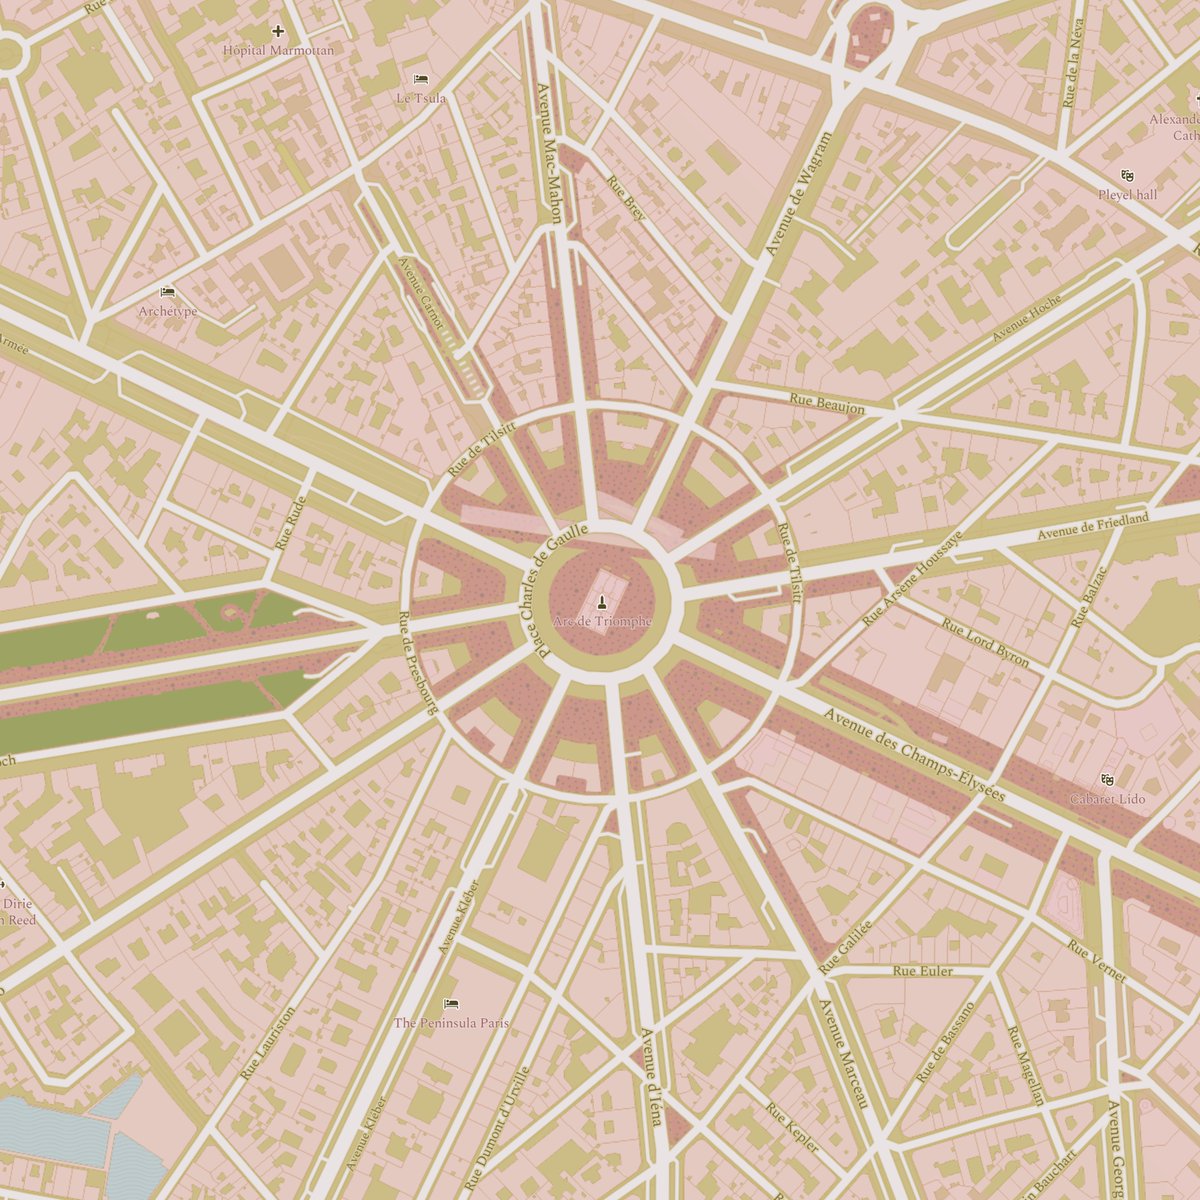
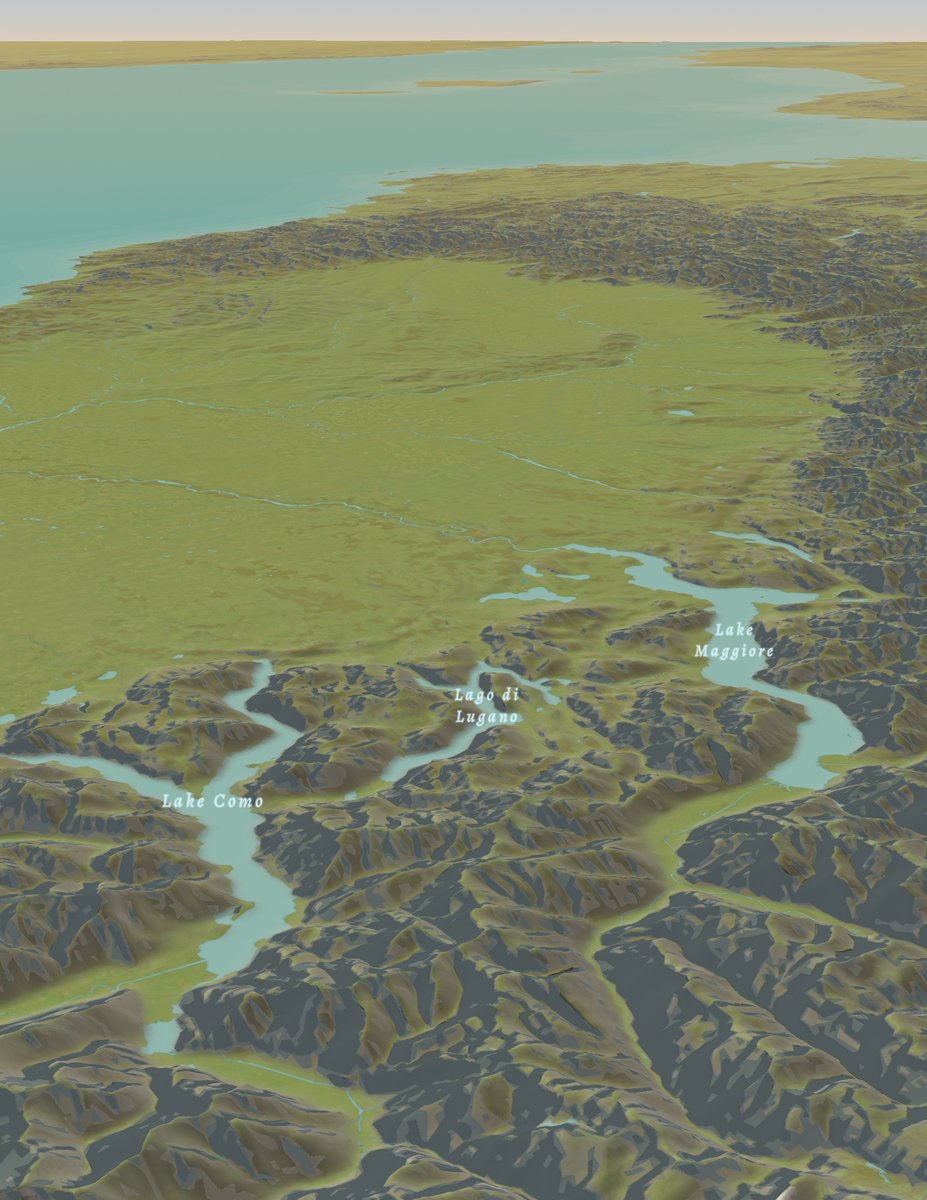
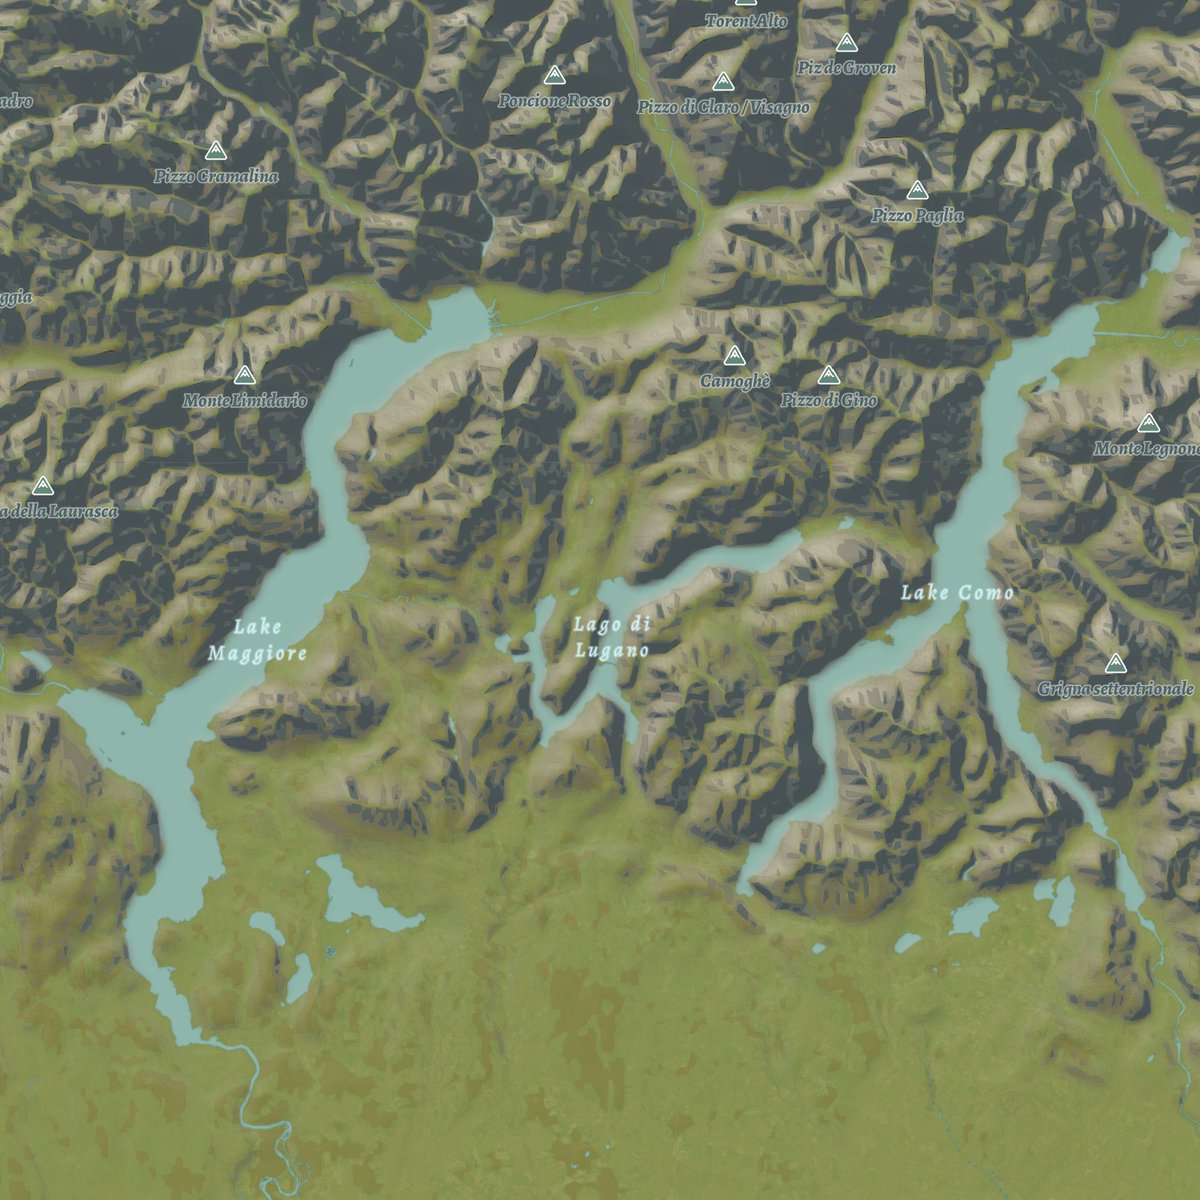
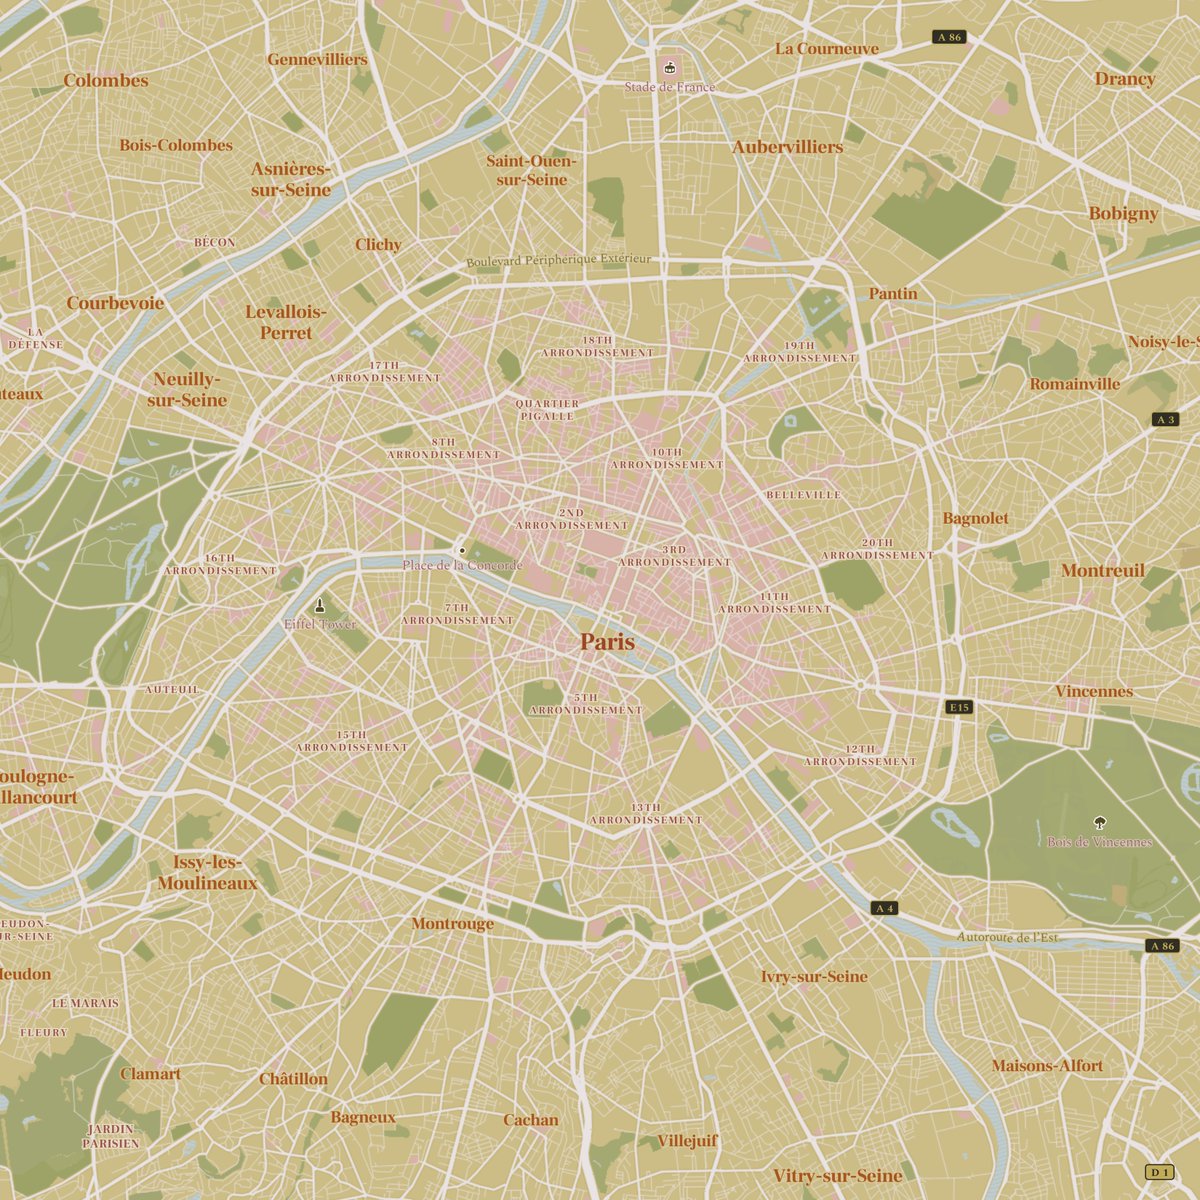
This time I was going for a more natural style. It's not the smoothest terrain and hillshade since I used the default #Mapbox DEM but I'm quite liking it! #maps #cartography
2
81
3,548
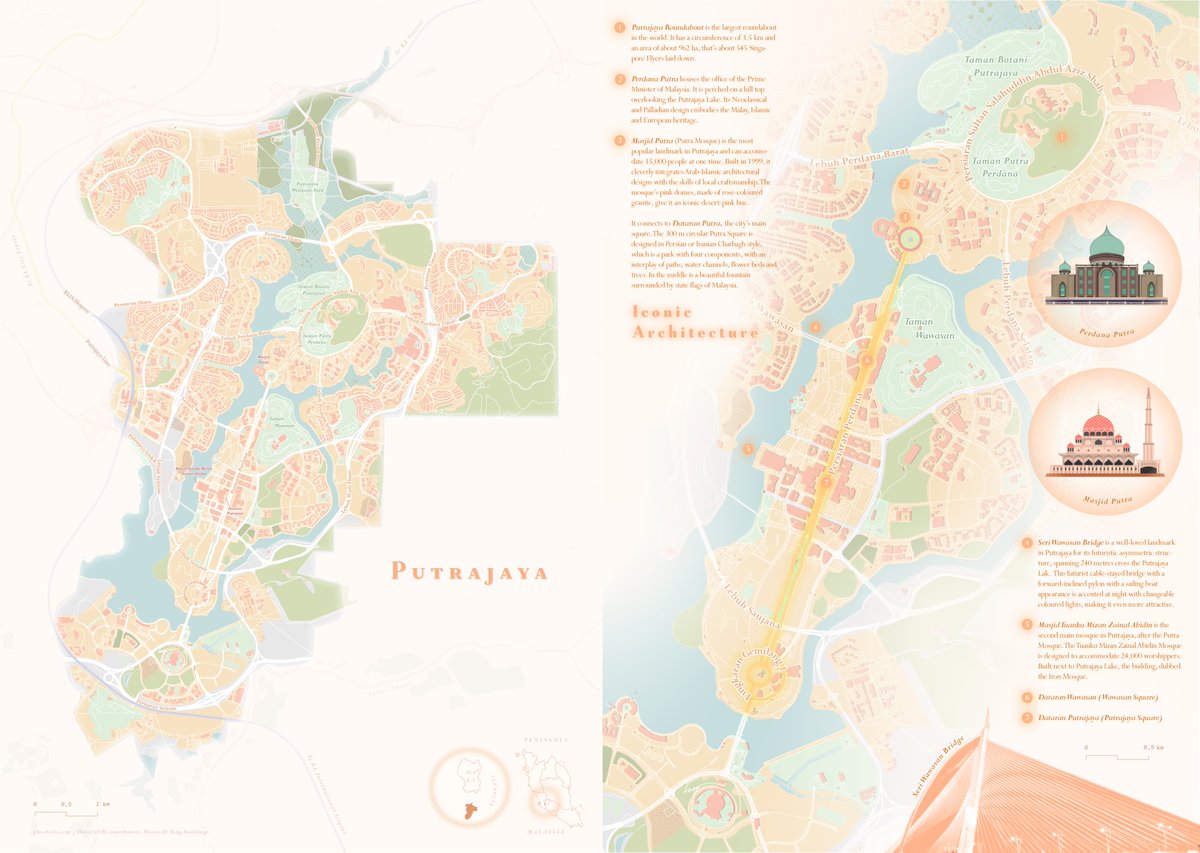
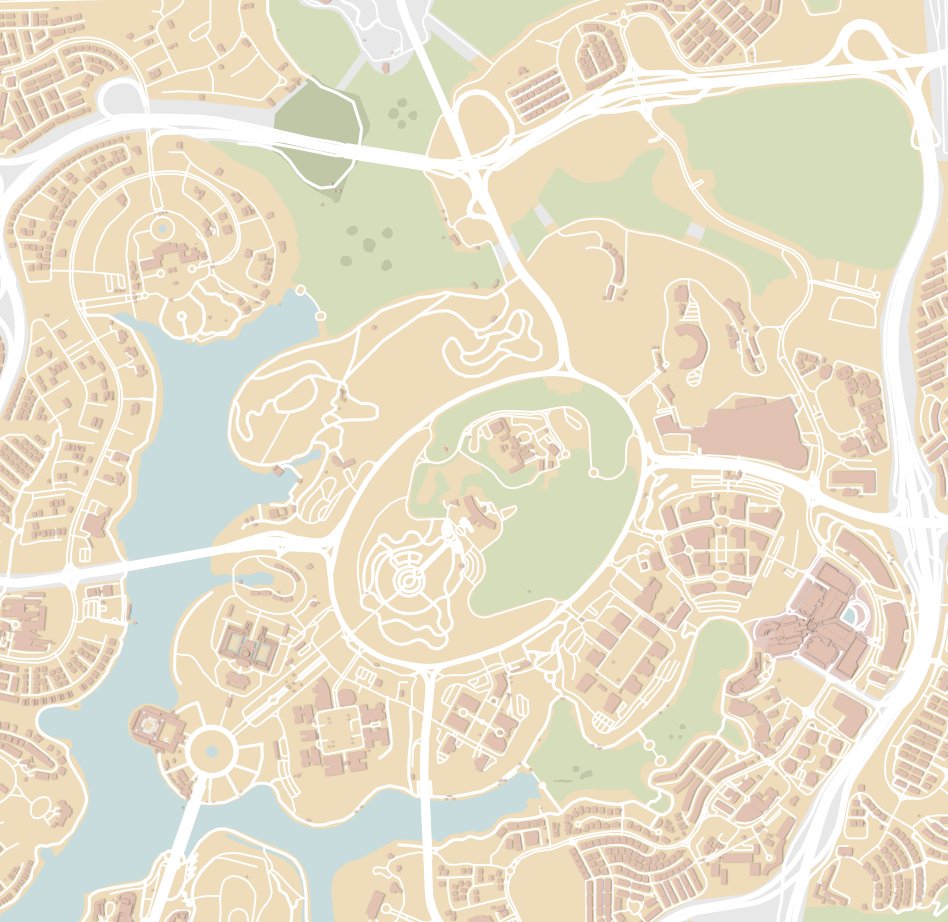
2nd #map for my #PastelMapSeries is #Putrajaya, the 3rd federal territory of #Malaysia. The last time I visited this city was last year, I was quite in awe of it's beauty and how much potential MY has in urban planning (unlike KL lol). I'm glad to be back for a bit tho! :)
10
109
6,822
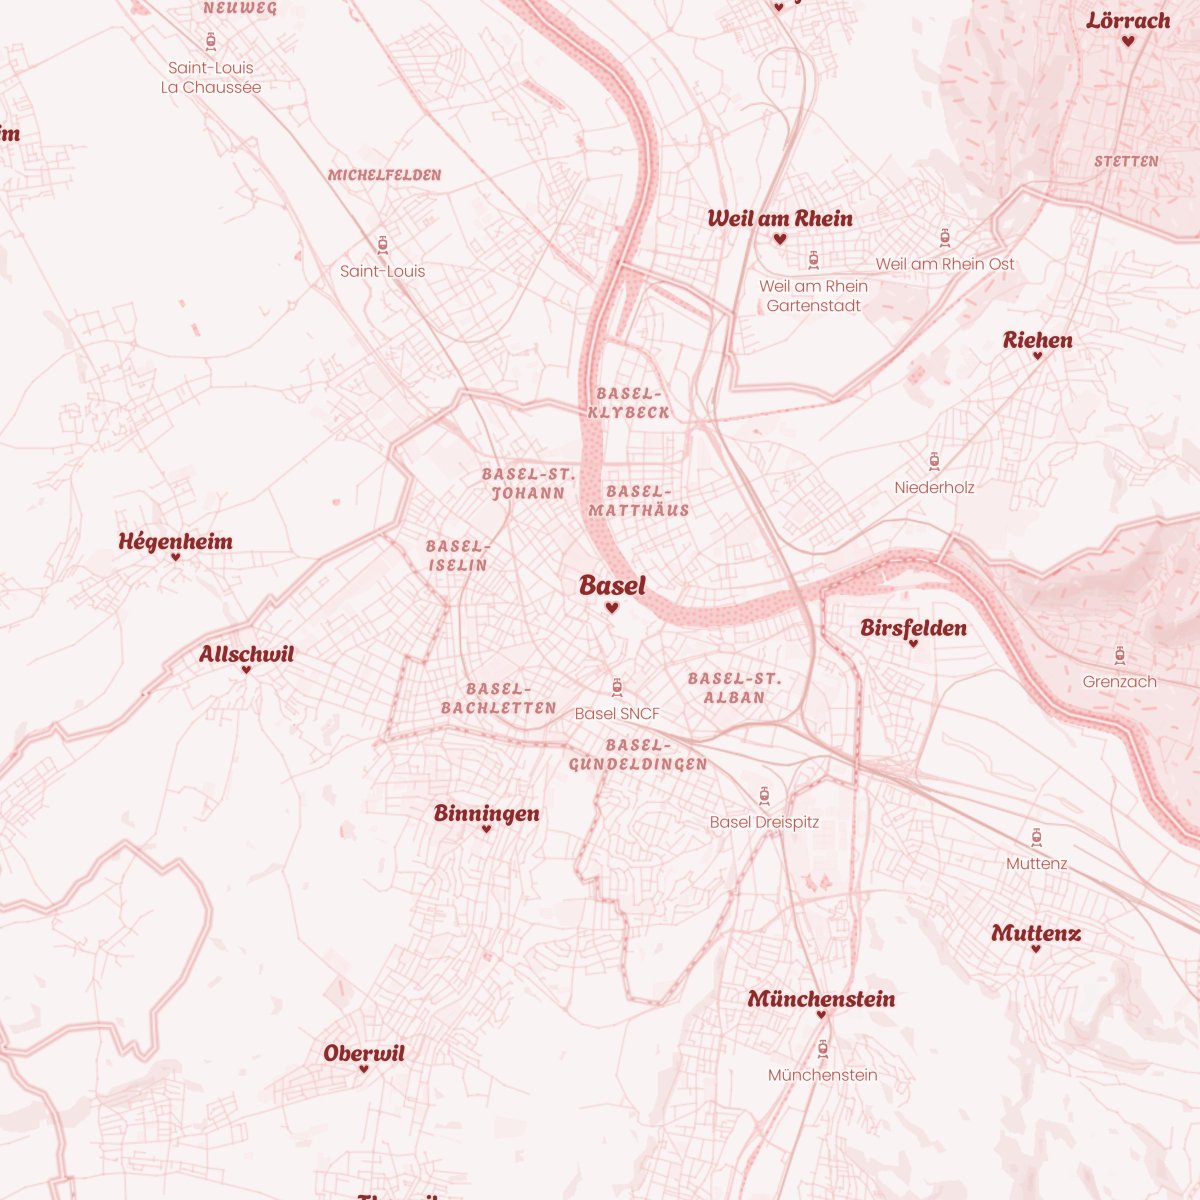
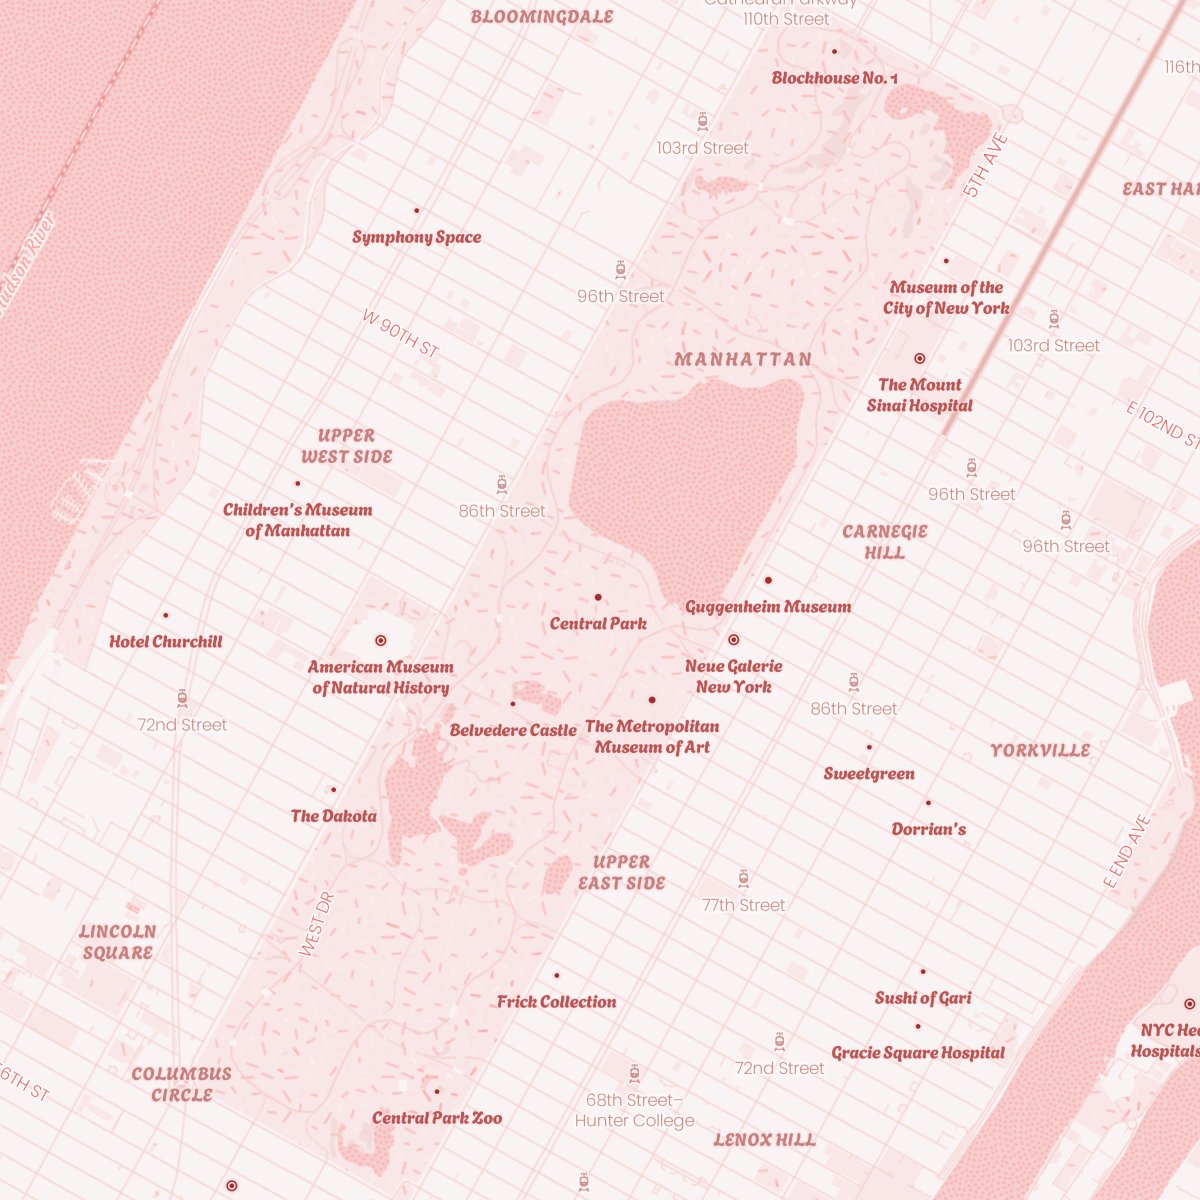
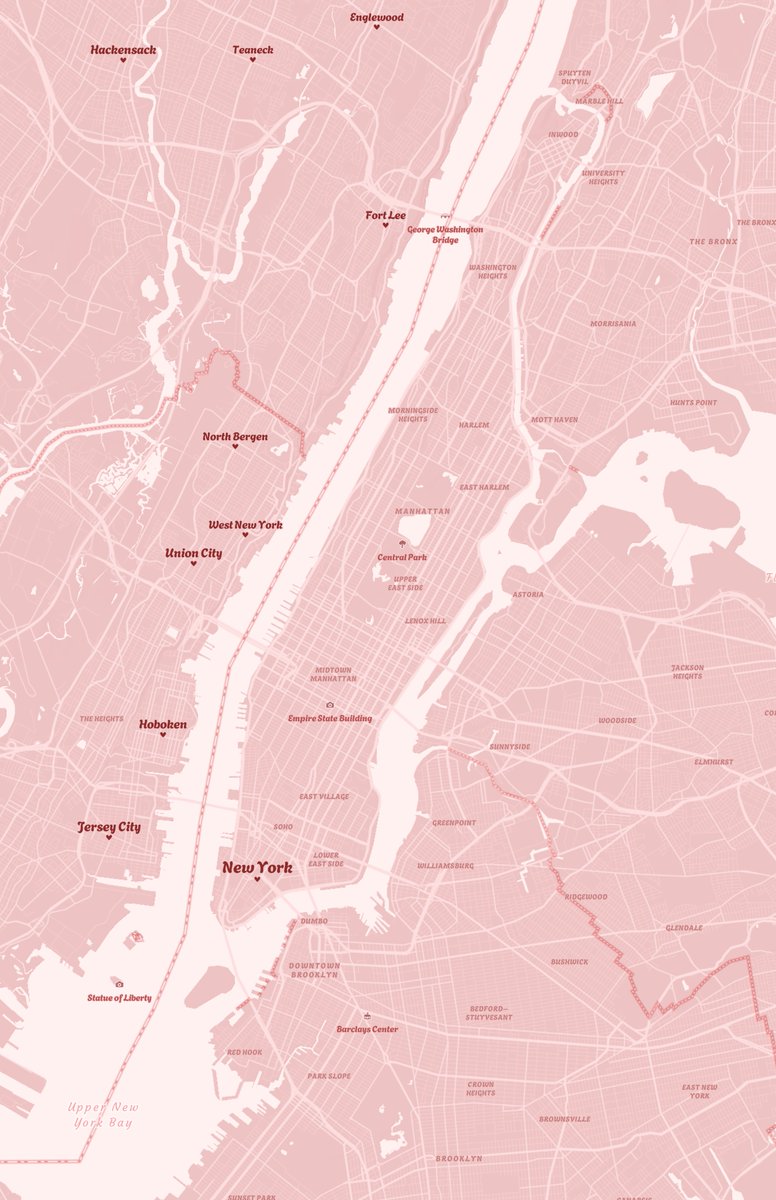
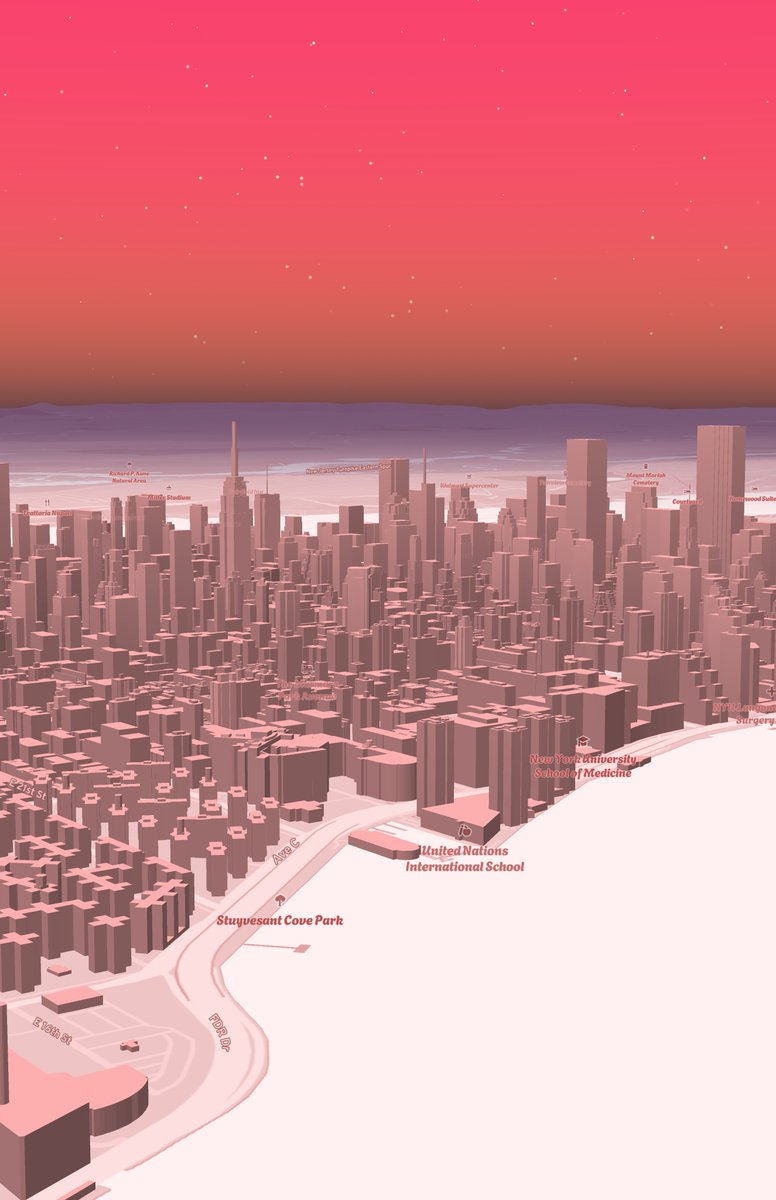
Had an cute idea today and did it: Valentine's Day themed basemap 🥰 #mapbox #cartography #maps #NYC #ValentinesDay
3
70
5,180
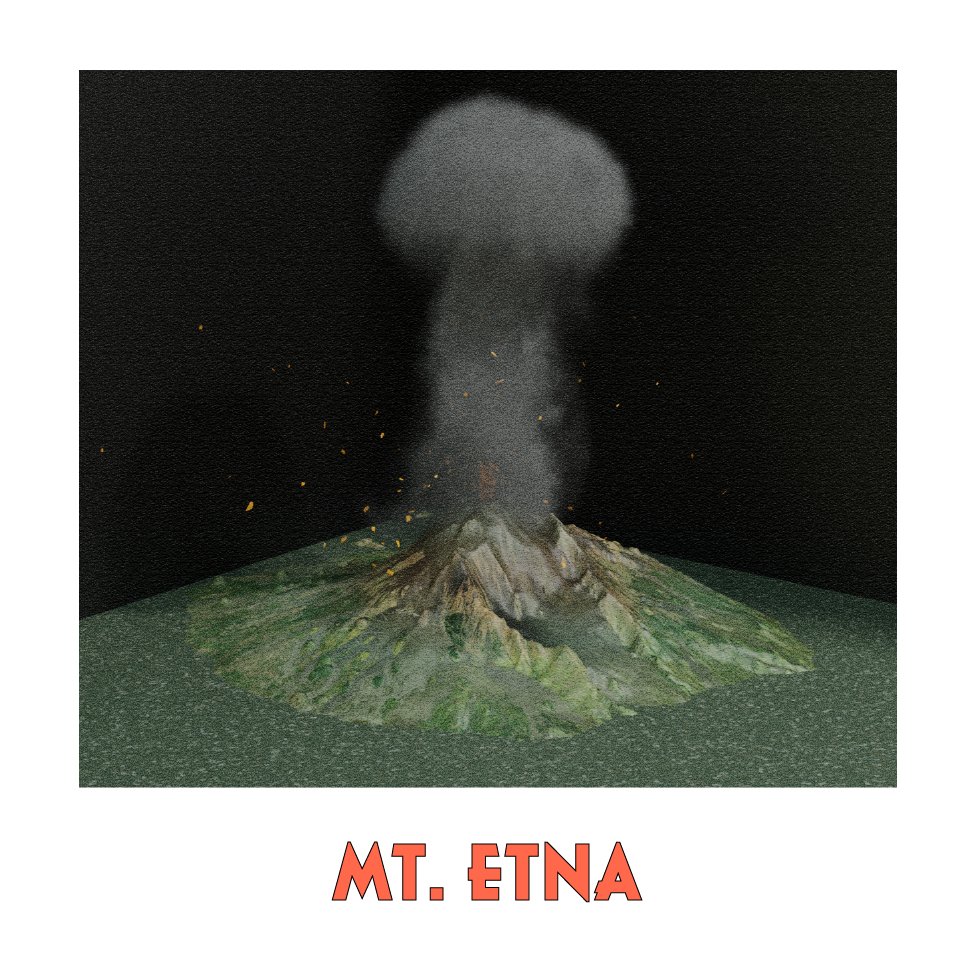
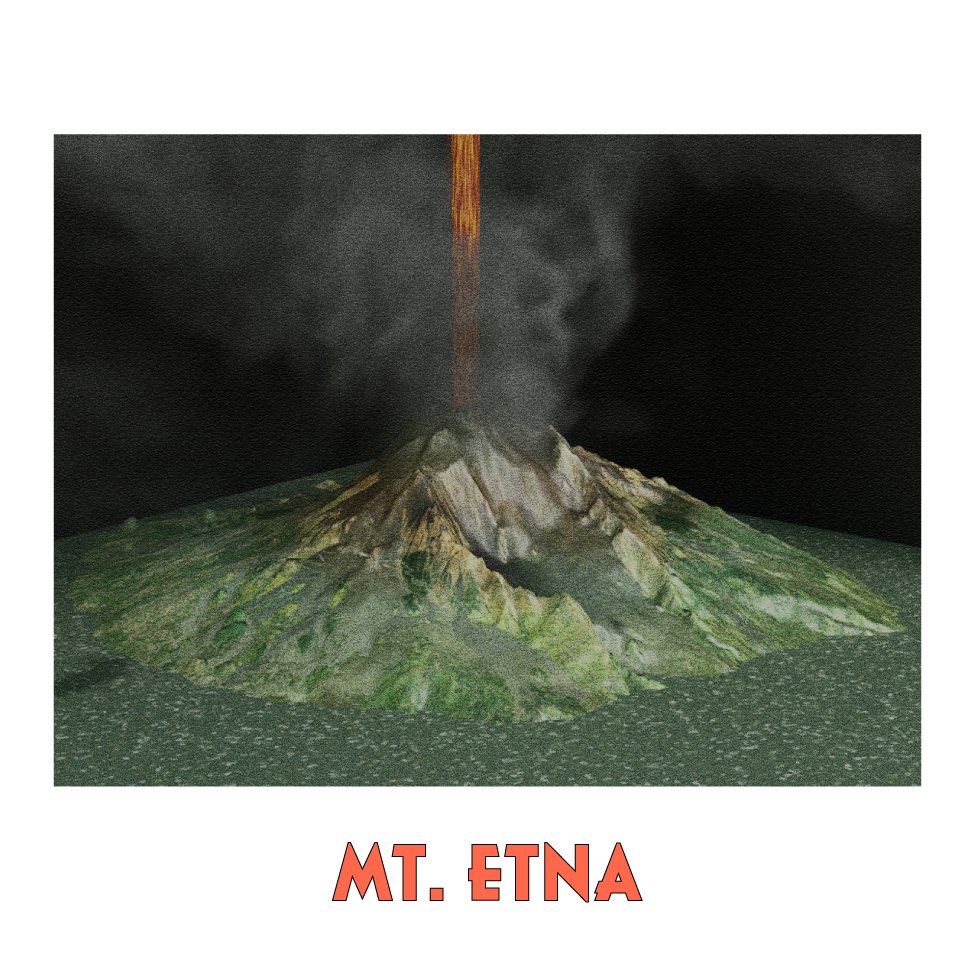
Day 25: Heat. 🌋 I recently visited my first #volcano, Mt. Etna. Although I didn't see the main active crater, the geologist in me was nerding out! Is this a map? Idk but it was made with Copernicus DEM and ESRI imagery using qGIS, #Blender, Illustrator. #30daymapchallenge #3d
1
1
23
1,407
Elevation of the Moon with only circular shapes, even the typography :) Day 24 of
#30daymapchallenge #moon #cartography #maps
2
15
146
8,660
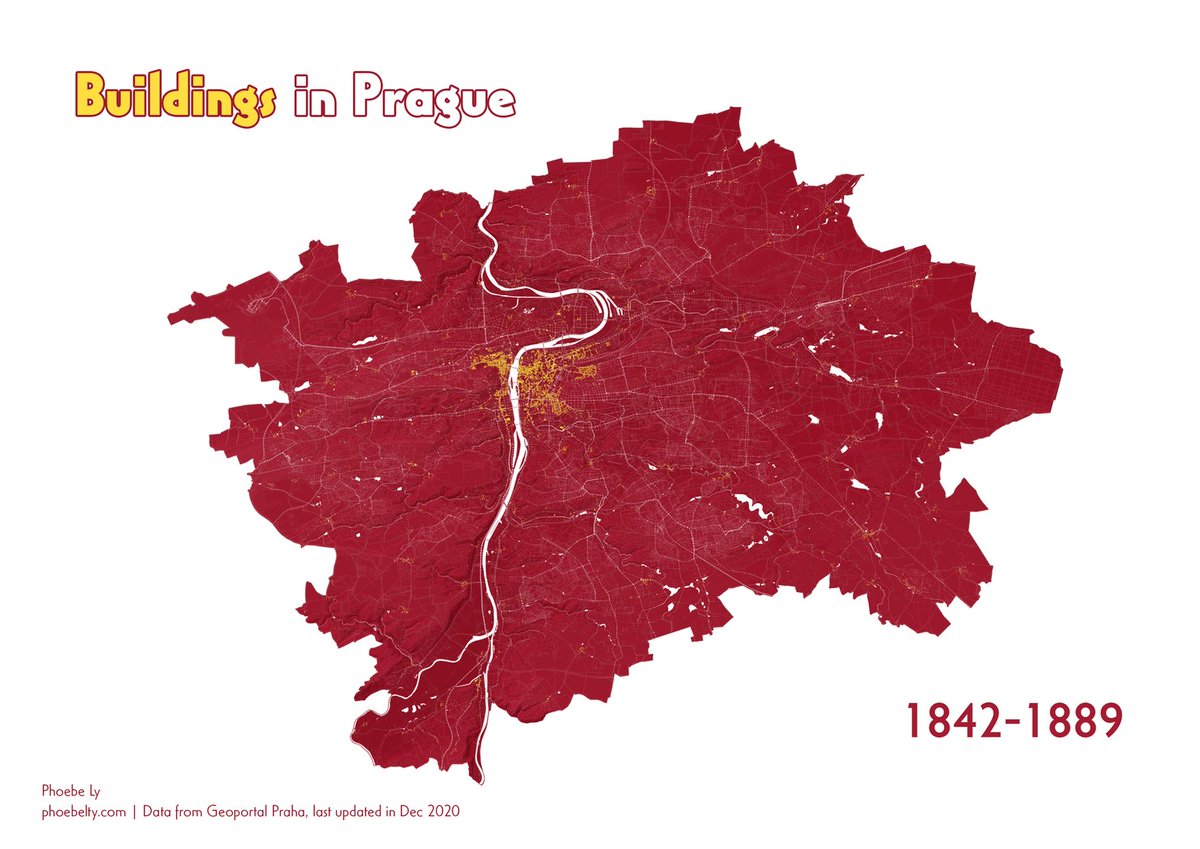
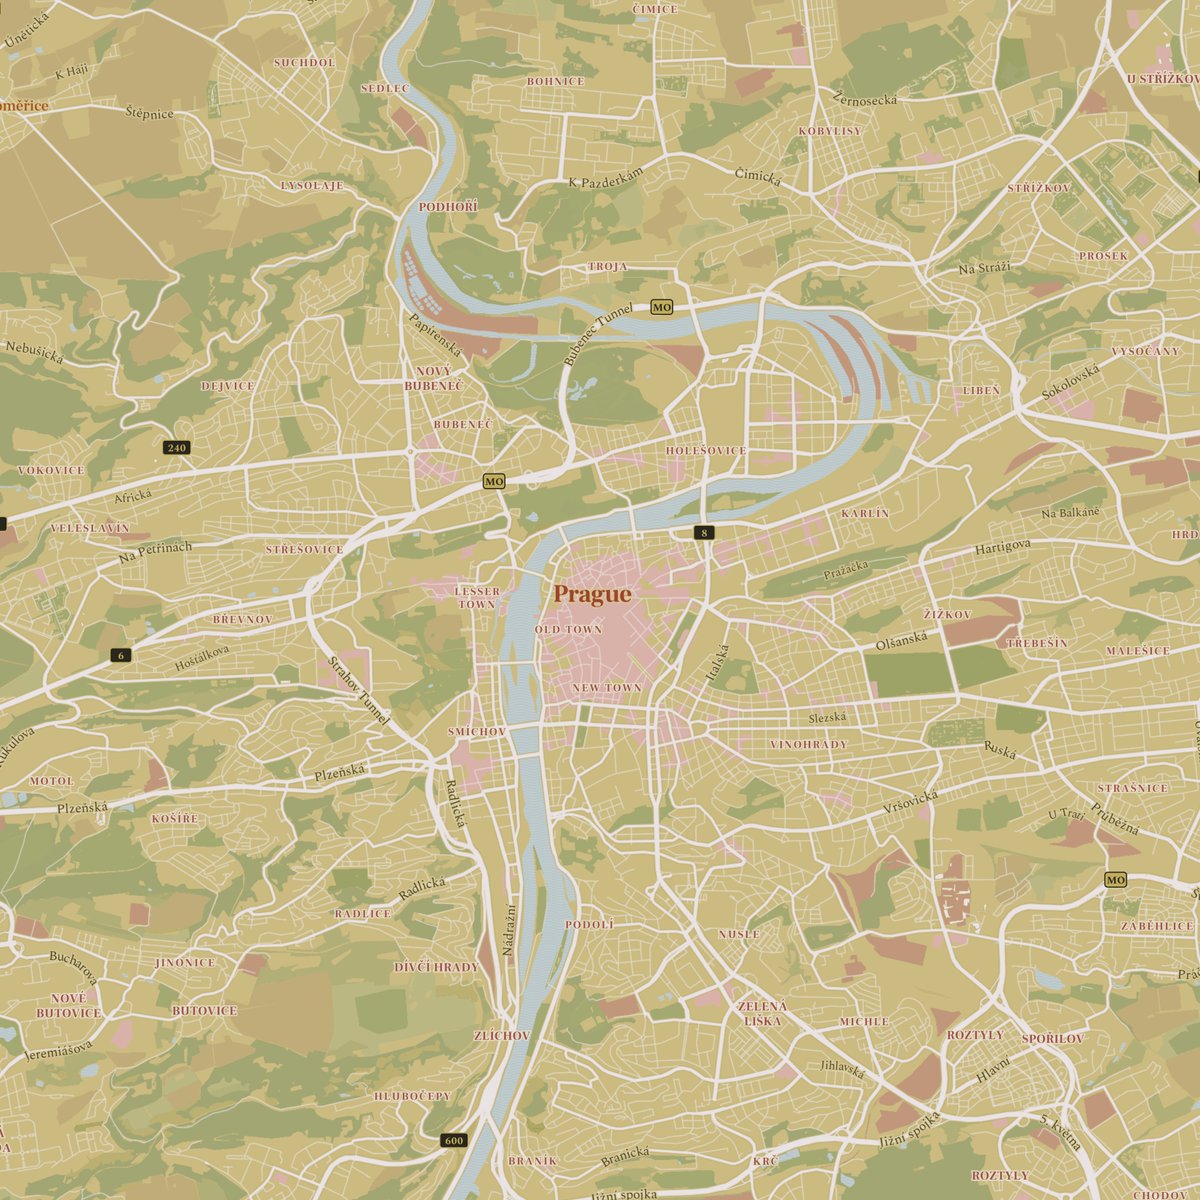
I made my first map gif for Day 22: 2 colors! #30DayMapChallenge Red and yellow for #prague ❤️💛. Data is from geoportalpraha.cz. I LOVE their platform - so well designed so much open data. #maps #cartography
1
4
35
1,738