New Data Vis Dispatch! This week you'll find charts and maps covering early spring in Korea, the war in Ukraine, anti-LGBTQ bills in the U.S., and much more. 📊👇
blog.datawrapper.de/data-vis…
🎉 You can now draw arrows in Datawrapper locator maps! Choose between line arrows (to show routes) and flow arrows (to show magnitude too), and style them however you like.
Learn more: datawrapper.de/blog/arrows-i…
ALT Flow map of Hong Kong's microchip exports in 2025. The thickest arrow by far points to India ($5.2 billion), followed by Malaysia ($1.1 billion), Korea, the Philippines and Europe, with much smaller flows to China, the US and other destinations.
ALT Map of the migration route of Pingo, a Whimbrel fitted with a satellite transmitter in 2012. In fall, Pingo flew from Alaska across Canada and non-stop over the Atlantic to Brazil; in spring, it returned north over Central America and the US with several stopovers.
ALT Flow map of commuters leaving Cologne for work. The thickest arrows point to Bonn (17,041 commuters) and Dusseldorf (16,038), with smaller flows to six nearby towns and long-distance arrows toward Berlin and Frankfurt.
ALT Map of a two-week South Korea trip in April, starting and ending in Seoul. The route loops from Seoul to Sokcho, down the coast to Gyeongju and Busan, then by plane to Jeju Island, by ferry to Jindo for the Miracle Sea Road Festival, and back to Seoul by train
🇨🇴 How do you visualize an election?
A scroll-driven story: Colombia's map morphs step by step into 1,189 bubbles, one per municipality. Scroll through it and compare every presidential race since 1974 👇
johnguerra.co/viz/resultados…#Colombia#DataViz
The Sonoran and Mojave Deserts are incredibly diverse, serving as habitat for migratory birds and wildlife.
USGS researchers and our partners combined satellite data, decadal plant growth cycles, and extensive ground verifications to map nearly 148 million acres at a sharp 30-meter resolution.
The resulting framework classifies 152 different vegetation and land cover types across both the United States and Mexico. Hosted as an interactive online tool by @uarizona, this map can be rapidly updated with new field observations to detect environmental shifts over time.
This non-biased science provides foundational data to regional public land managers, helping them understand habitat distribution and plan for long-term resource stability.
Download the report and see the full map here: iris.fws.gov/APPS/ServCat/Re…
📸: High-resolution Transboundary Vegetation Community Maps of the Sonoran and Mojave Desert Ecoregion to Support Critical Landscape Conservation Planning and Habitat Management Needs.
@uarizona@wildlandsnetwrk@sonoranjv
Charles Lacouture, Trilobe Synoptique (1890).
Created before the modern RGB color model, the diagram attempts to map all colors through combinations of red, yellow, and blue, reflecting 19th CE theories of pigment mixing and color harmony.
Chromolithograph on paper.
The 2026 World Cup is just around the corner, and the latest Data Vis Dispatch brings you a batch of visualizations to mark the event 🌎⚽️🏆. Find these and much more on the Datawrapper blog. 👇
datawrapper.de/blog/data-vis…
ALT A collection of heat maps illustrating frequent areas of field usage at all World Cups between 1966 and 2022. The change is evident in the shift from frequent passing from one end of the pitch to the other in 1966 to players now frequently using the middle of the field. Published by The Athletic.
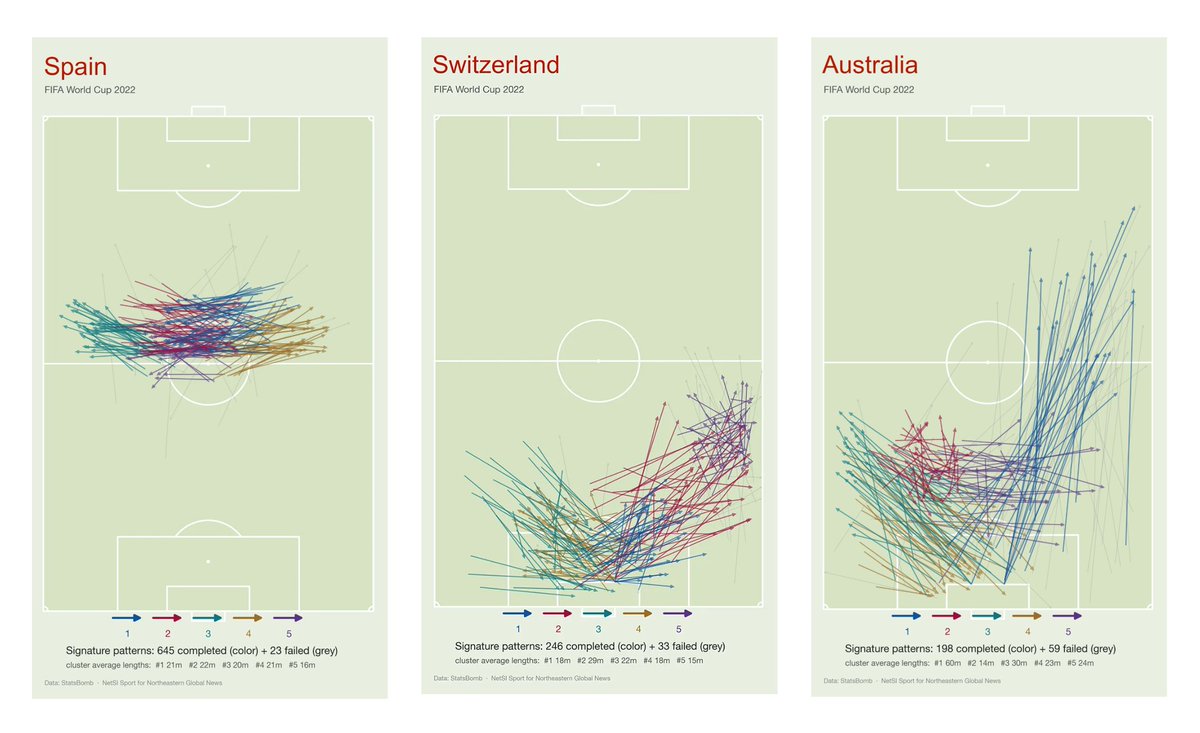
ALT A chart showing the top five most distinctive passing patterns for Spain, Switzerland and Australia during the 2022 World Cup. While Spain recorded the highest number of signature passes, Australia recorded the longest average pass length and had the highest amount of failed passes. Published by Northeastern Global News.
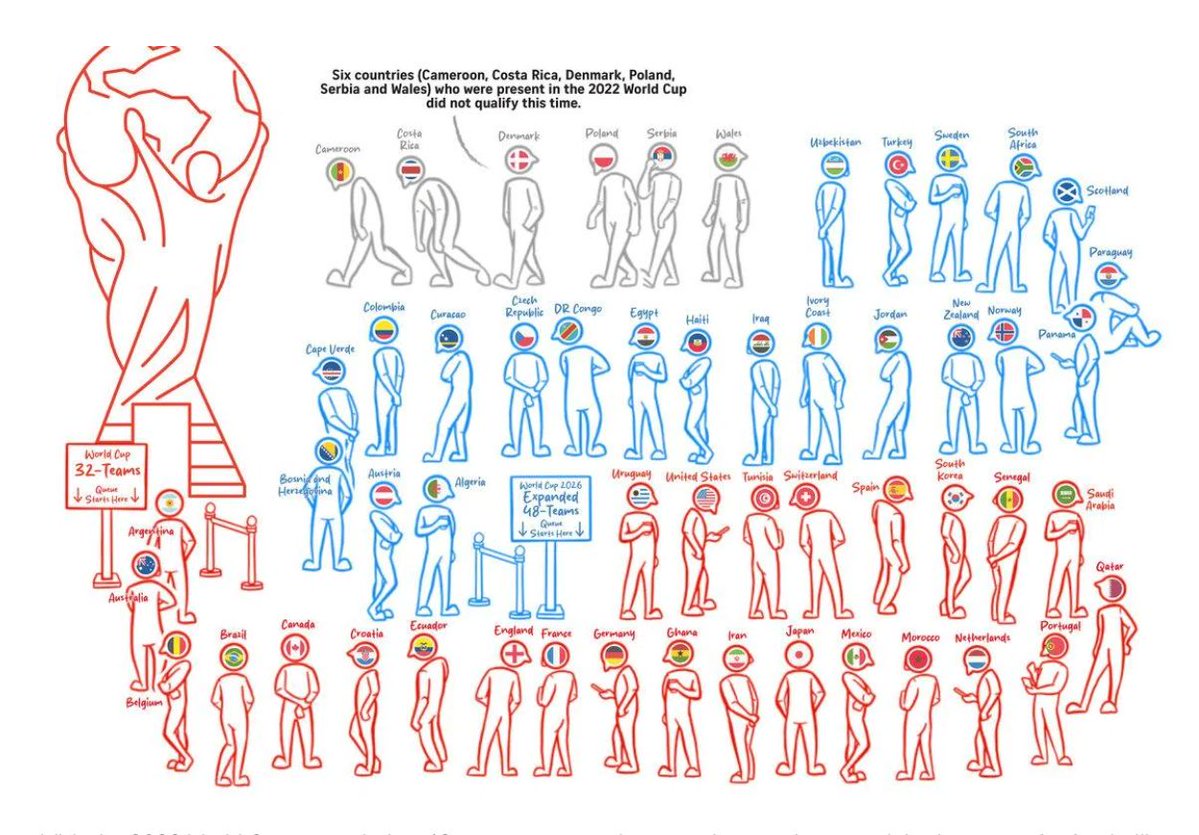
ALT An infographic visualizing the expansion of the 2026 World Cup tournament to include a record of 48 teams. As a result of the expansion, some countries that participated in the 2022 World Cup did not qualify this time. Published by The Straits Times.
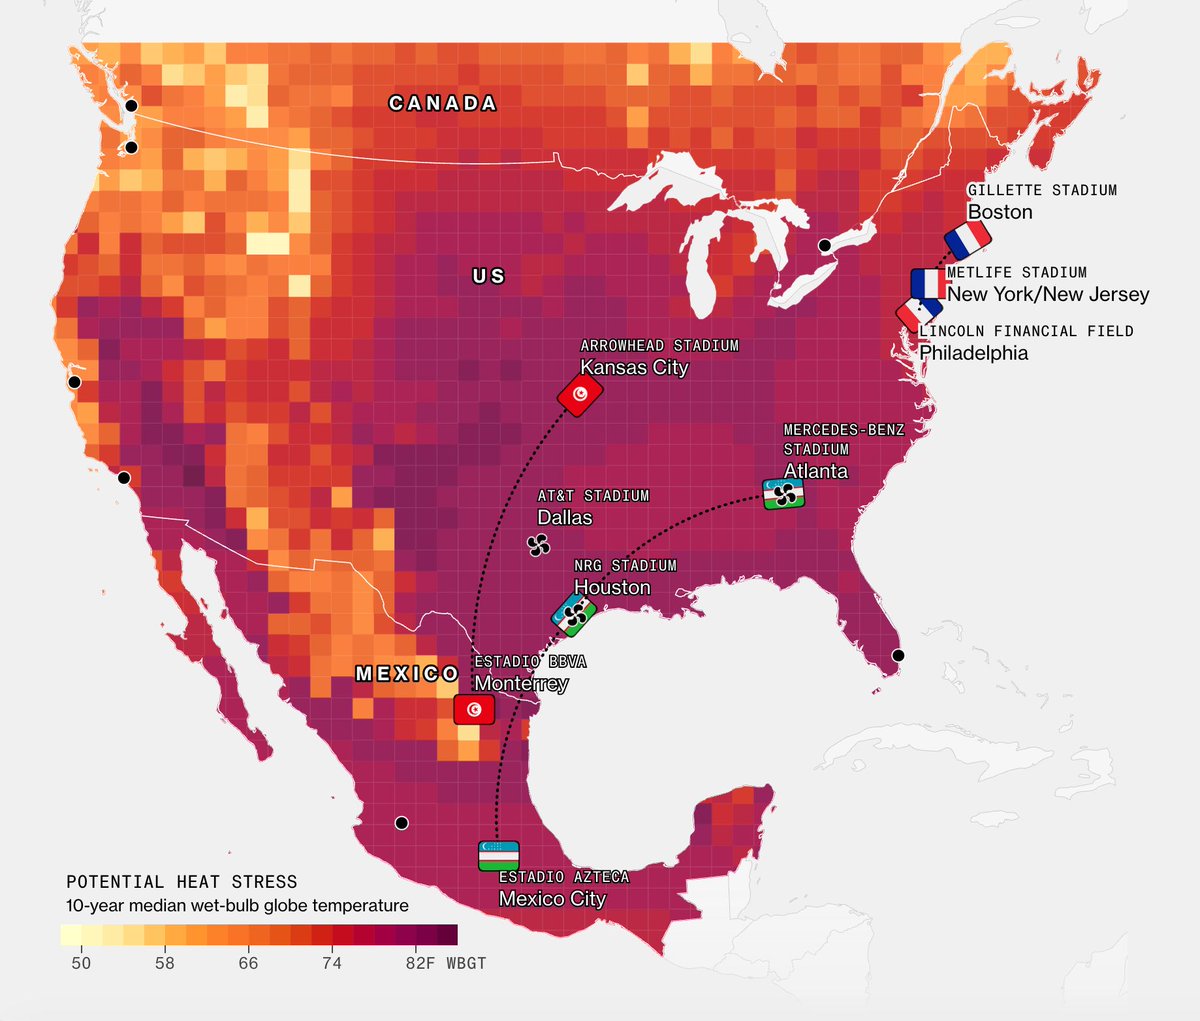
ALT A heat map illustrating the locations of the World Cup games that will potentially be affected by heat stress. Although Uzbekistan will be playing in some of the hottest cities in the U.S., air-conditioned stadiums are expected to keep temperatures indoors cooler. Published by Bloomberg.
🌎 What does it take to make massive imagery datasets web-ready? Join geospatial expert and YouTube creator Matt Forrest (forrest.nyc) for Modern GeoTiling Techniques for Web Maps.
🗓 June 18, 12 PM ET
🗺️ Free virtual event — sign up:
buff.ly/Oqc3ksw
🎉 We've updated our population cartogram with the latest (2023) data from @OurWorldInData! A lot has changed since the 2018 one, which used 2016 data.
Create your own at app.datawrapper.de/create/ma… > Choropleth map, then search for "population squares."
Maurice Prendergast's color world.
Across beaches, gardens, promenades, and parks, Prendergast returns to the same chromatic vocabulary: ochres, creams, blues, greens, and bursts of orange.
Four palette readings from Meditations in Color.
Tobias Mayer’s triangular color chart (1758).
Created by an astronomer and cartographer, it was an early attempt to represent color through geometry than symbolism or pigment alone.
Later reproduced by Georg Christoph Lichtenberg in Opera Inedita (1775).
📍Las desapariciones en México tienen historia.
No comenzaron ayer y tampoco han terminado.
Por eso construimos una línea del tiempo interactiva 🧭 que conecta hechos, contextos y momentos clave para entender cómo esta violencia se ha expandido en el país.
Detrás de cada fecha hay personas desaparecidas, familias que buscan 🔎 y años de exigencia ante la falta de respuestas.
Explórala aquí ⬇️
imdhd.org/redlupa/especiales…
George Hurst, Colour (1900).
Hurst was a Scottish chemist, dye expert, and color theorist.
Looking back, many of these diagrams feel unexpectedly modern. Looking forward, they helped establish some of the foundations on which 20th CE color theory would be built.
1 of 2 👇
Meet the #Outlier2026 speakers presenting on "Data Sonification". Join us June 24 to 26—register today: buff.ly/9c7RcCl
Everything I Know about Visuals I Learned from Sound by Robert Simmon
¿Y si pudiésemos ver cada edificio de Madrid a lo largo de la historia?
Ya he conectado cerca de 900 licencias de obra del Archivo de Villa con su ubicación en un mapa interactivo.
Pronto en alvaroruizcuevas.com.
¿Cuál fue el resultado de la elección Colombiana del fin de semana? @duto_guerra@guerravis presenta un análisis muy completo a través de 3 interactivos que revelan los detalles de la elección en muchas de sus dimensiones. Enlace 👇
This week's Data Vis Dispatch covers topics including melting glaciers in the Swiss Alps 🗻🧊, rising cancer survival rates in Hong Kong 📈, and a boom in the autism therapy industry. Discover these and much more on the Datawrapper blog. 👇
datawrapper.de/blog/data-vis…
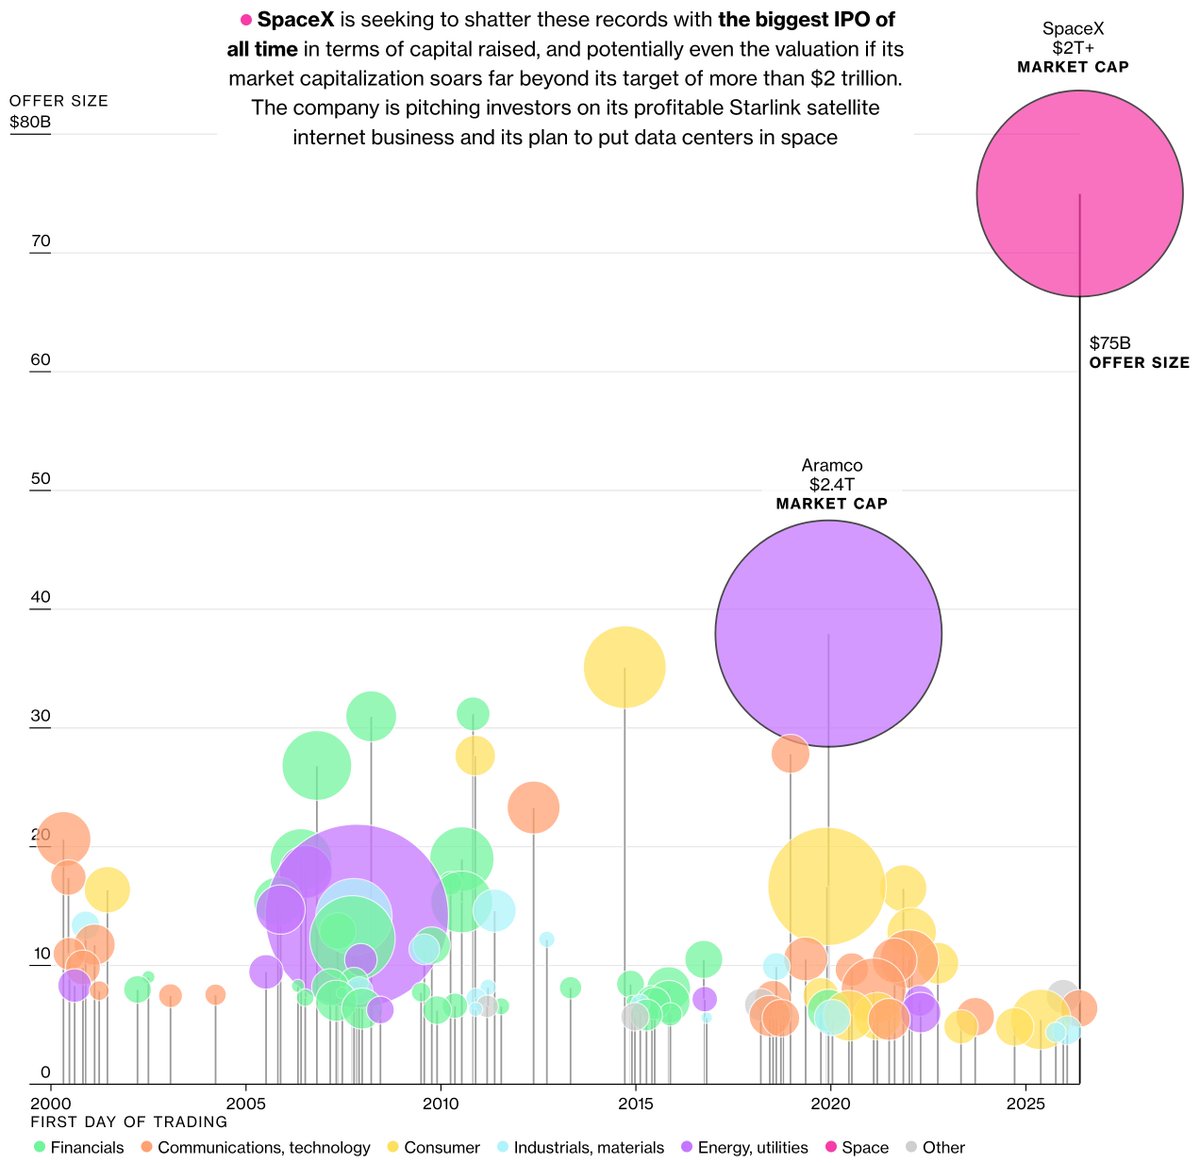
ALT A chart comparing SpaceX’s upcoming IPO against the top 100 listings globally since 2000. The company is seeking to raise as much as $75 billion at a valuation of more than $2 trillion. Published by Bloomberg.
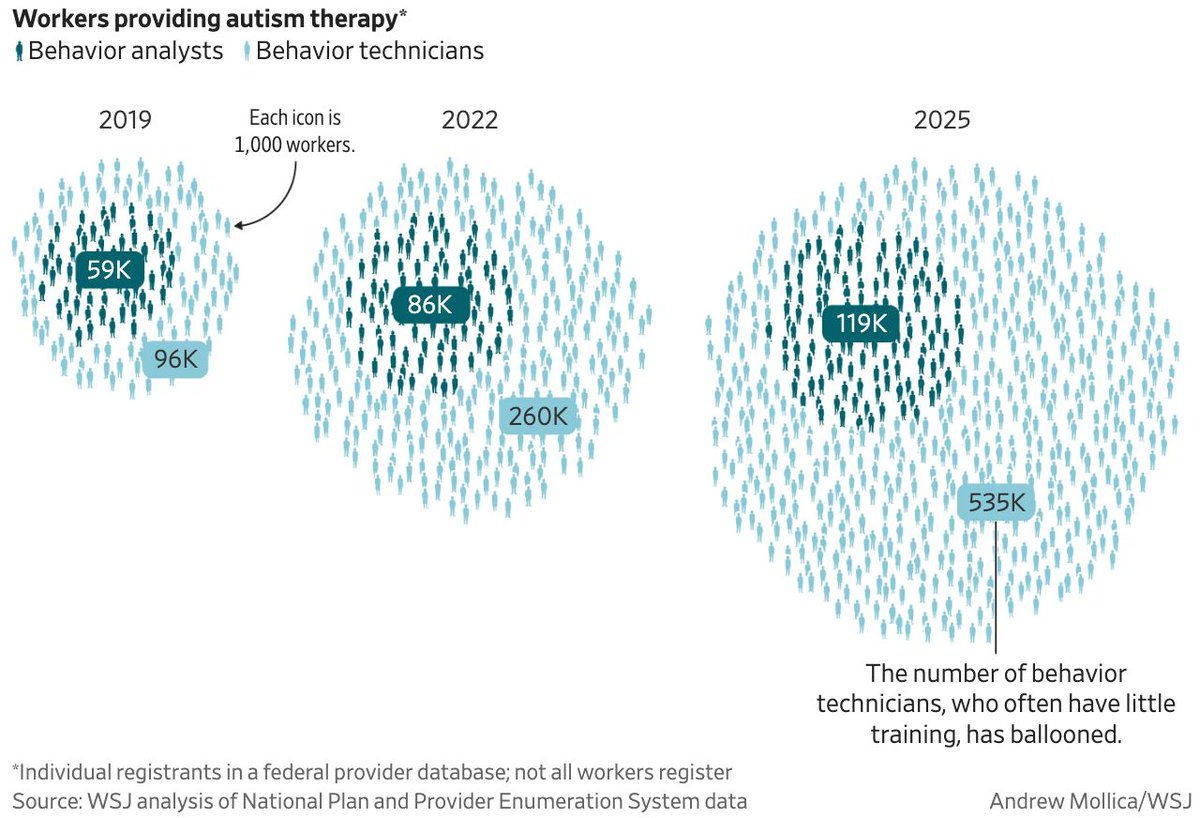
ALT A visualization showcasing the increase in workers providing autism therapy. While the number of behaviour analysts has increased from 59,000 in 2019 to 119,000 in 2025, the number of behaviour technicians, who require less training, has grown significantly, from 96,000 to 535,000. Published by the Wall Street Journal.
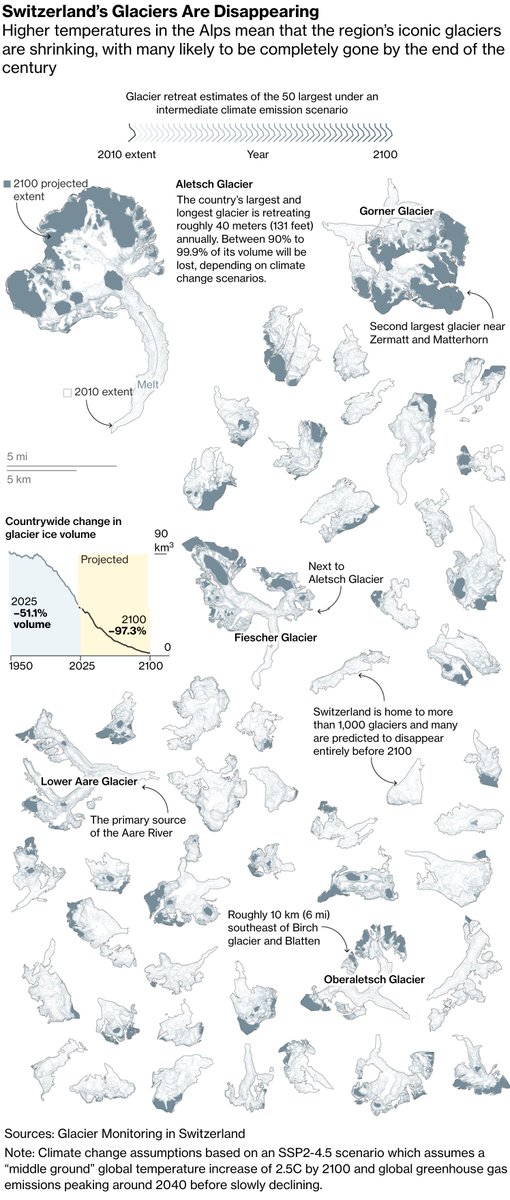
ALT A visualization portraying the melting of glaciers in the Swiss Alps. Higher temperatures are causing the region’s glaciers too shrink, with many likely to be completely gone by the end of the century. Published by Bloomberg.
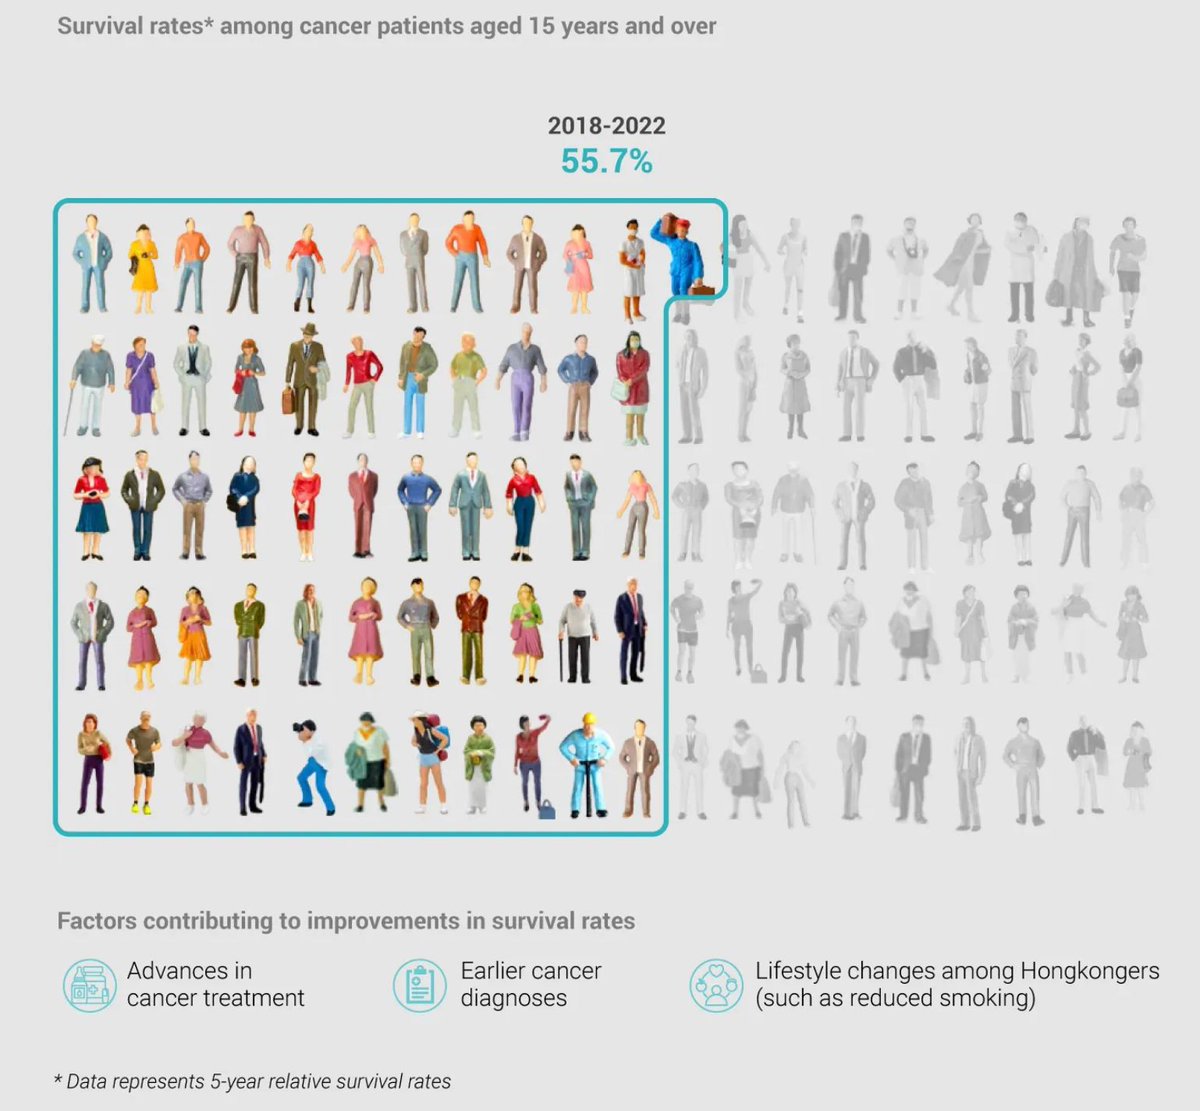
ALT A visualization showing the increase of cancer survival rates in Hong Kong. In 2010 to 2013 the survival rate among cancer patients aged 15 years and over was 49.1% and in 2018 to 2022 55.7%. Published by South China Morning Post.
Muchas comunidades de LATAM no existen en los mapas de respuesta ante desastres.Eso cambia del 23 jun al 31 jul.
🗺️Súmate al Mapatón Regional 2026 y ayúdanos a actualizar los datos que la región necesita frente a la crisis climática. 🌎 Regístrate: bit.ly/MARE2026
Flowing Data nos presenta una publicación con las técnicas más usadas para mentir con gráficas, cómo detectarlas, cómo evitarlas y como pelear contra ellas. Todo esto de forma interactiva y con ejemplos muy claros.
Gran herramienta para mejorar la creación de #dataviz
Enlace 👇