Sr. Hurricane Specialist at @NWSNHC | Ph.D M.S. via @UAlbanyDAES & B.S. via @UNCAweather | All kinds of weather 🌤❄️⛈🌪| Thoughts are my own |
- Tweets 12,633
- Following 1,354
- Followers 33,843
- Likes 16,888
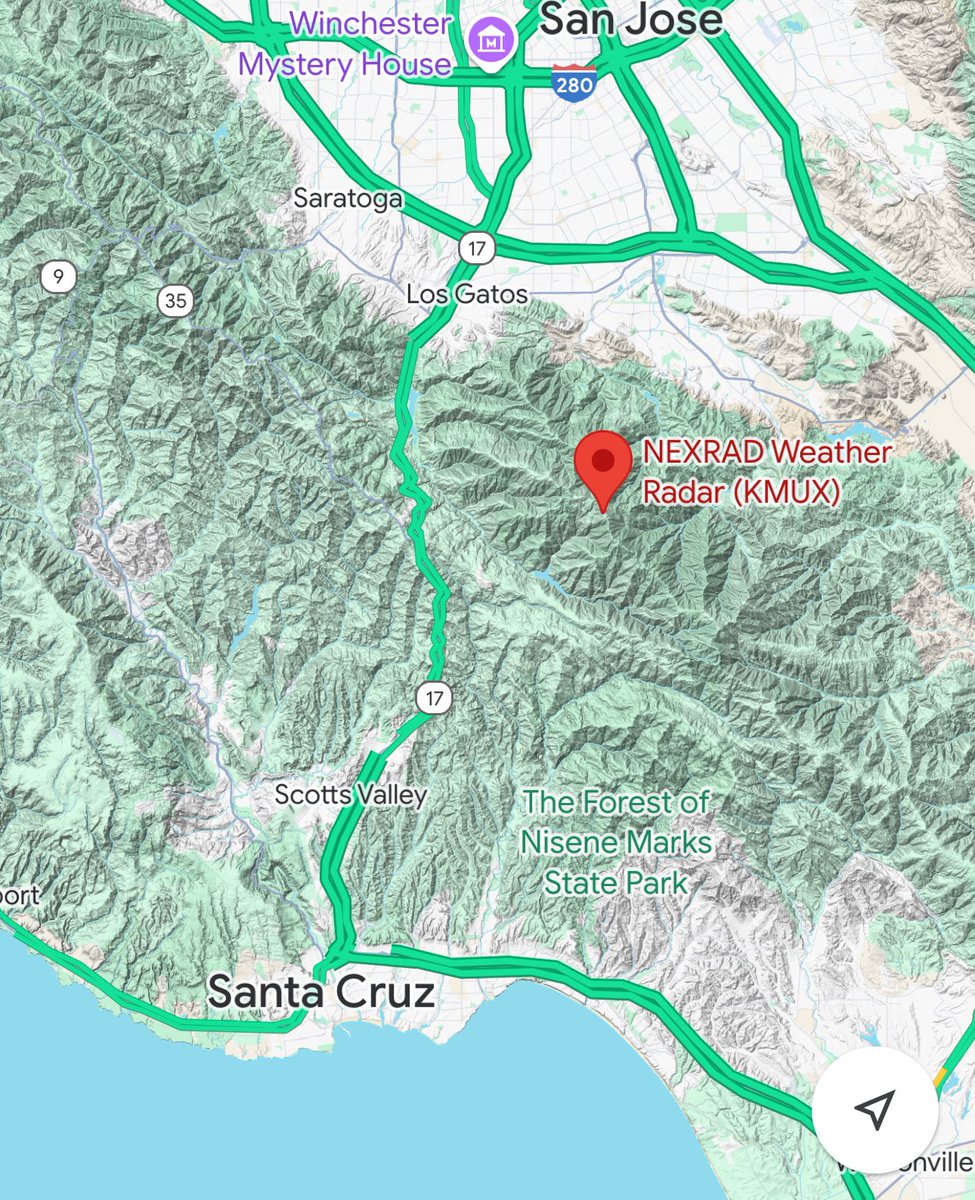


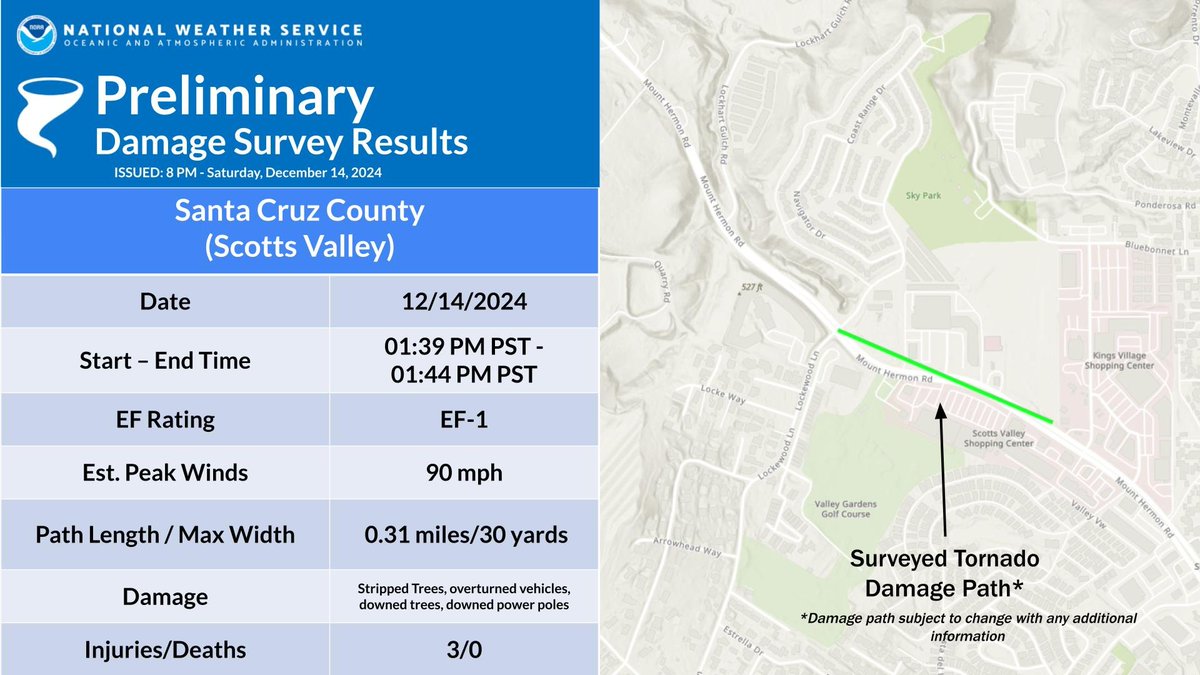
ALT EF1 tornadic damage observed in Scotts Valley December 14, 2024. Started at 1:39 PM and ended 1:44 PM. Length .31 miles. 3 injuries.


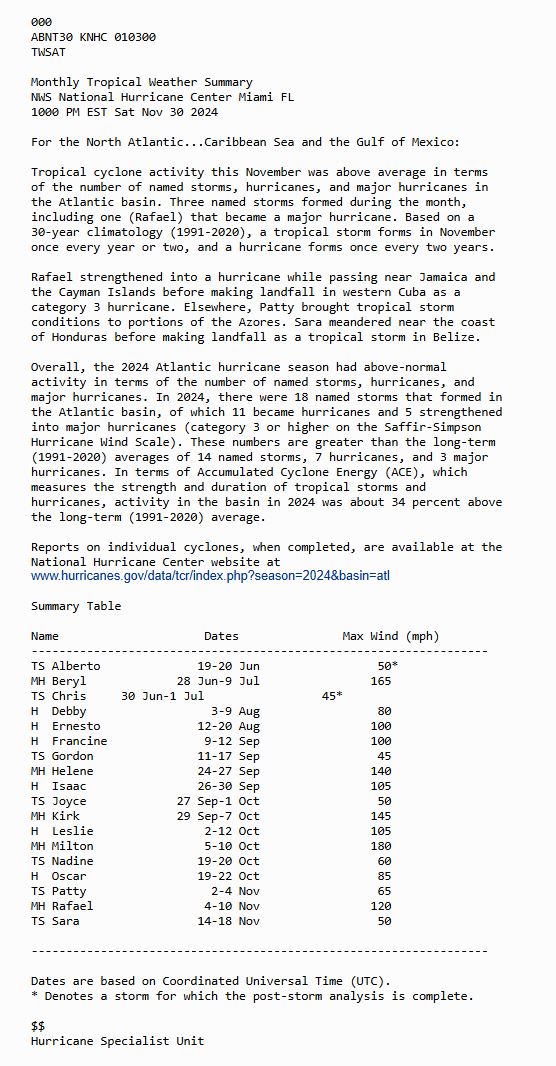
ALT Monthly Tropical Weather Summary issued by NHC on November 30
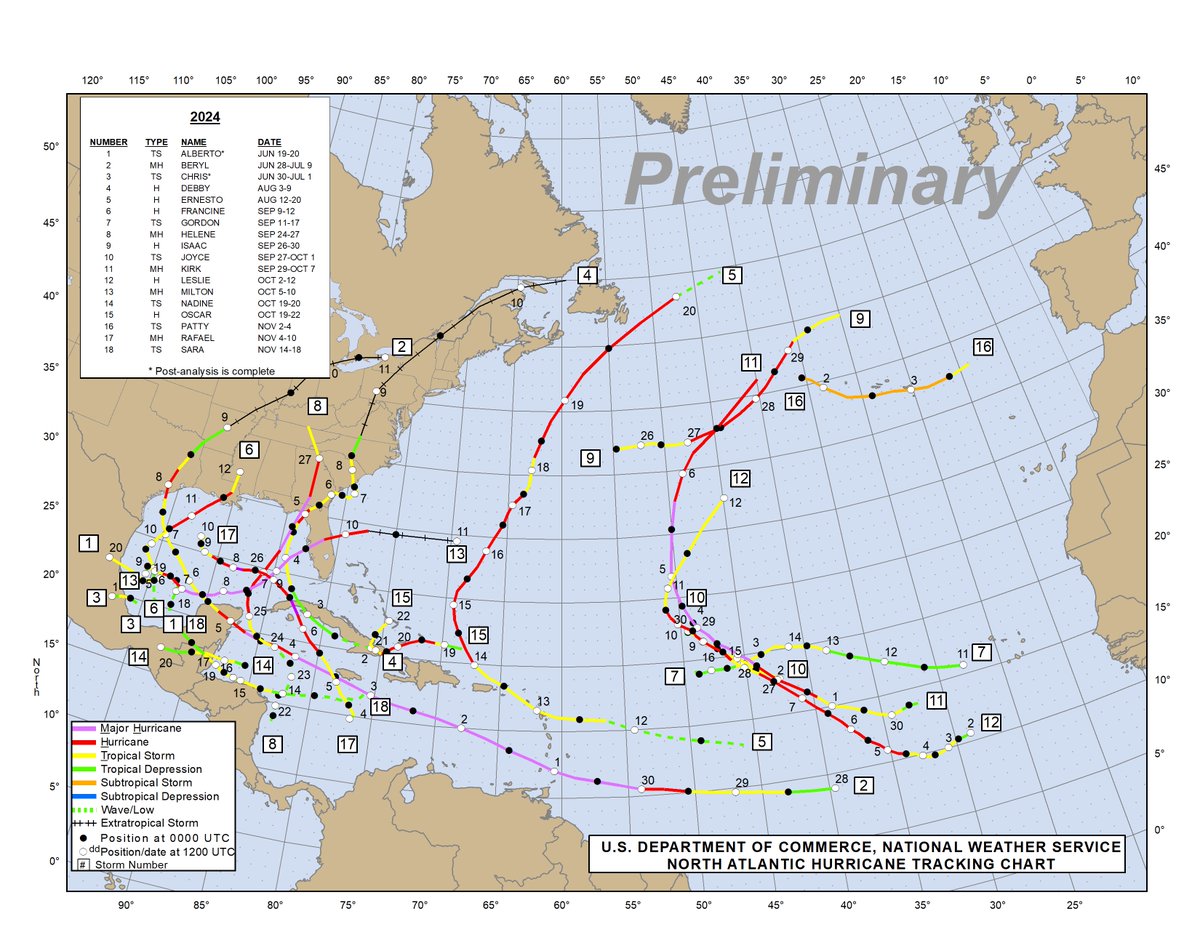
ALT Track map of tropical cyclones that occurred in the Atlantic basin in 2024.
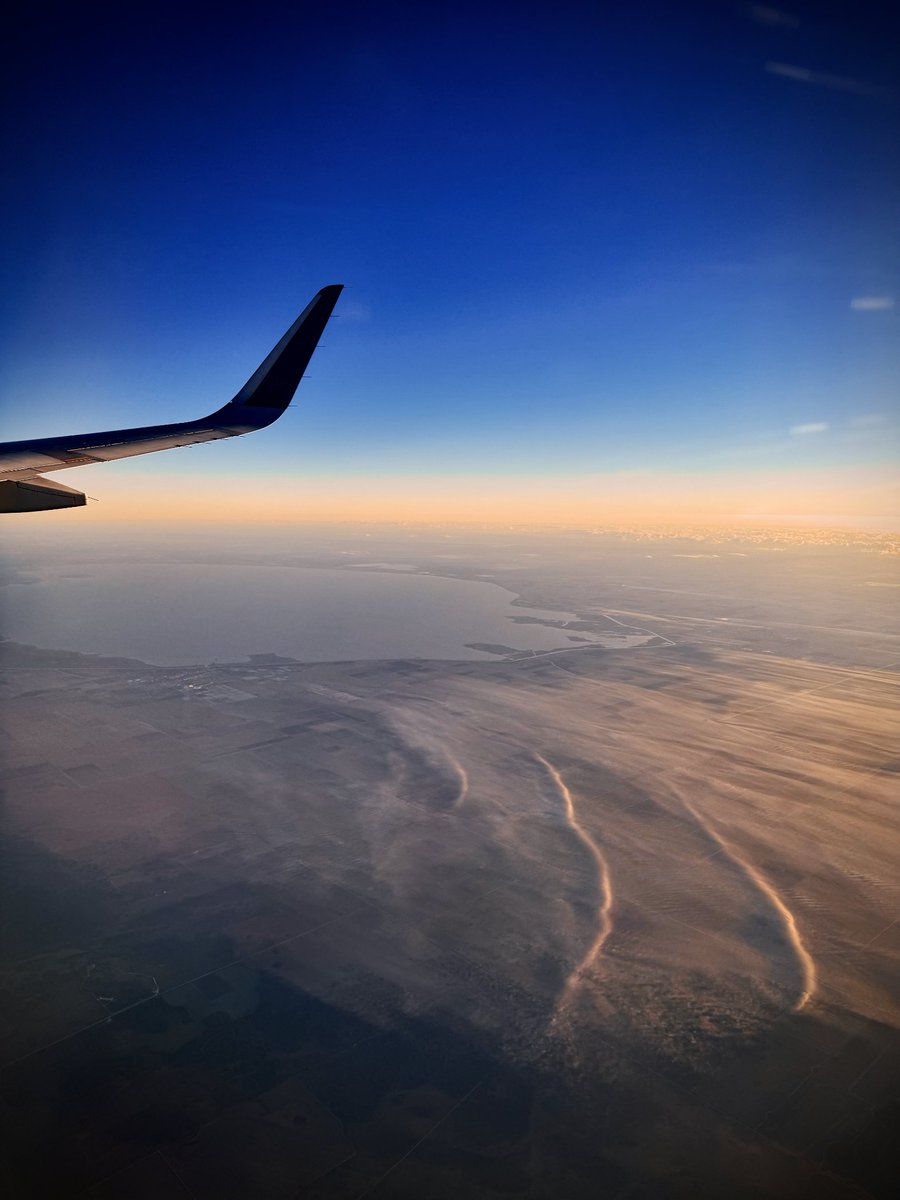
ALT View of Lake Okeechobee from a plane at sunrise, with shallow low level clouds or fog with waves embedded in them.
ALT A headshot of me from 2023

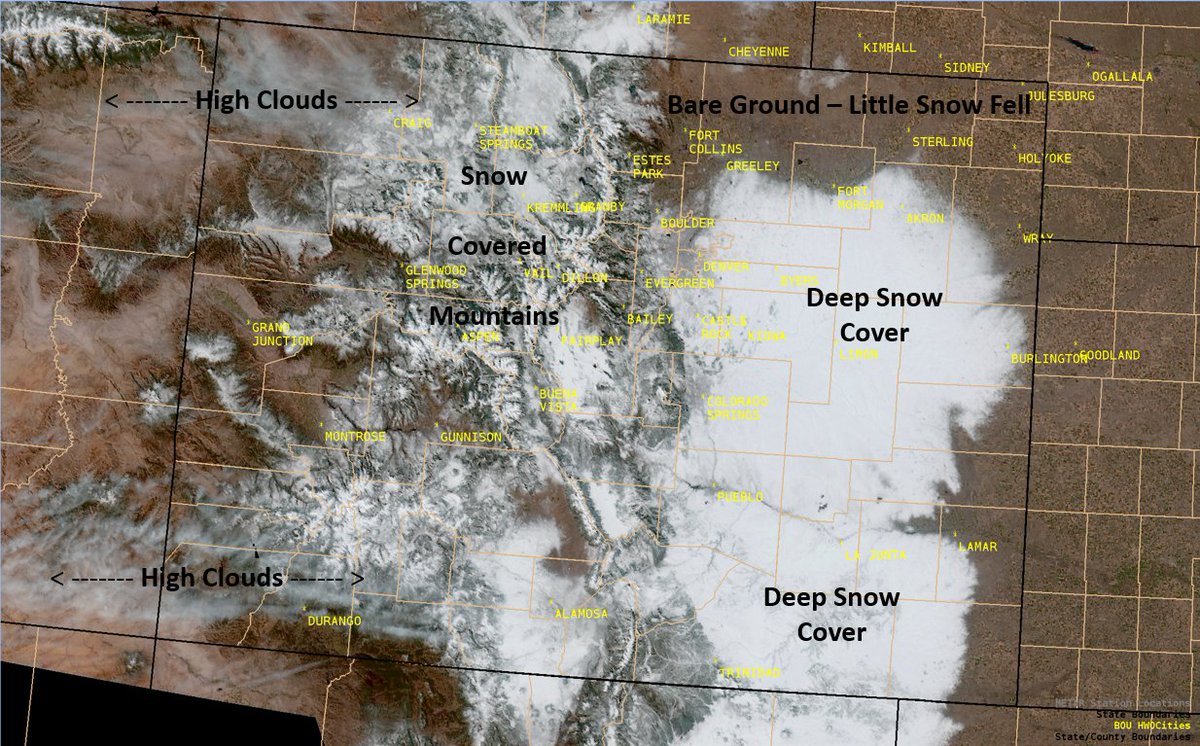
ALT Satellite view of Colorado's recent snow cover, with deep snow noted over much of eastern Colorado, along with snow covered mountains in Central and Western Colorado.


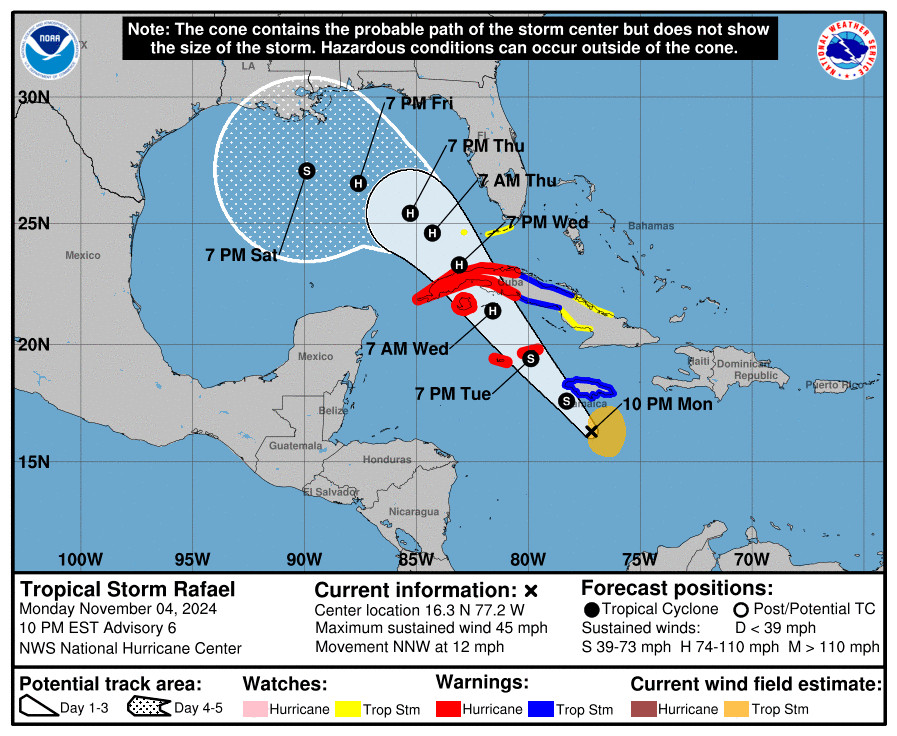
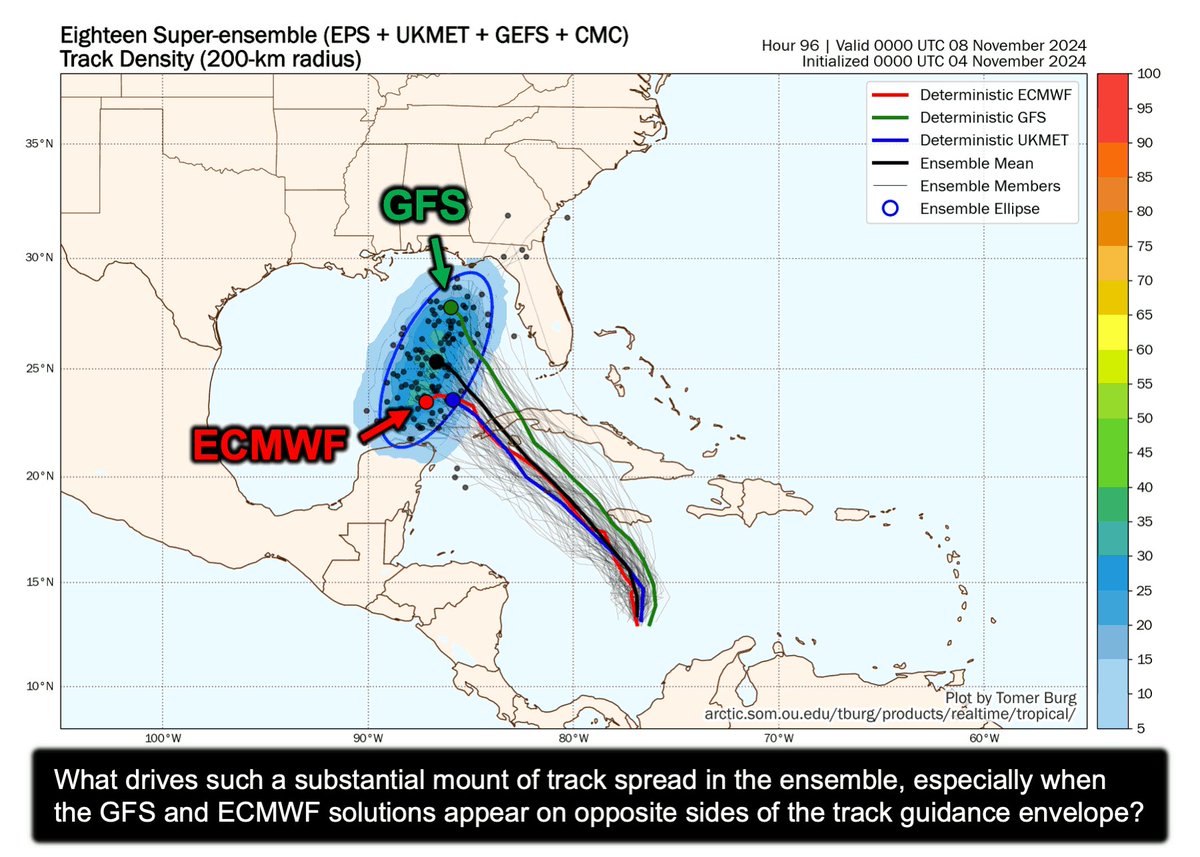
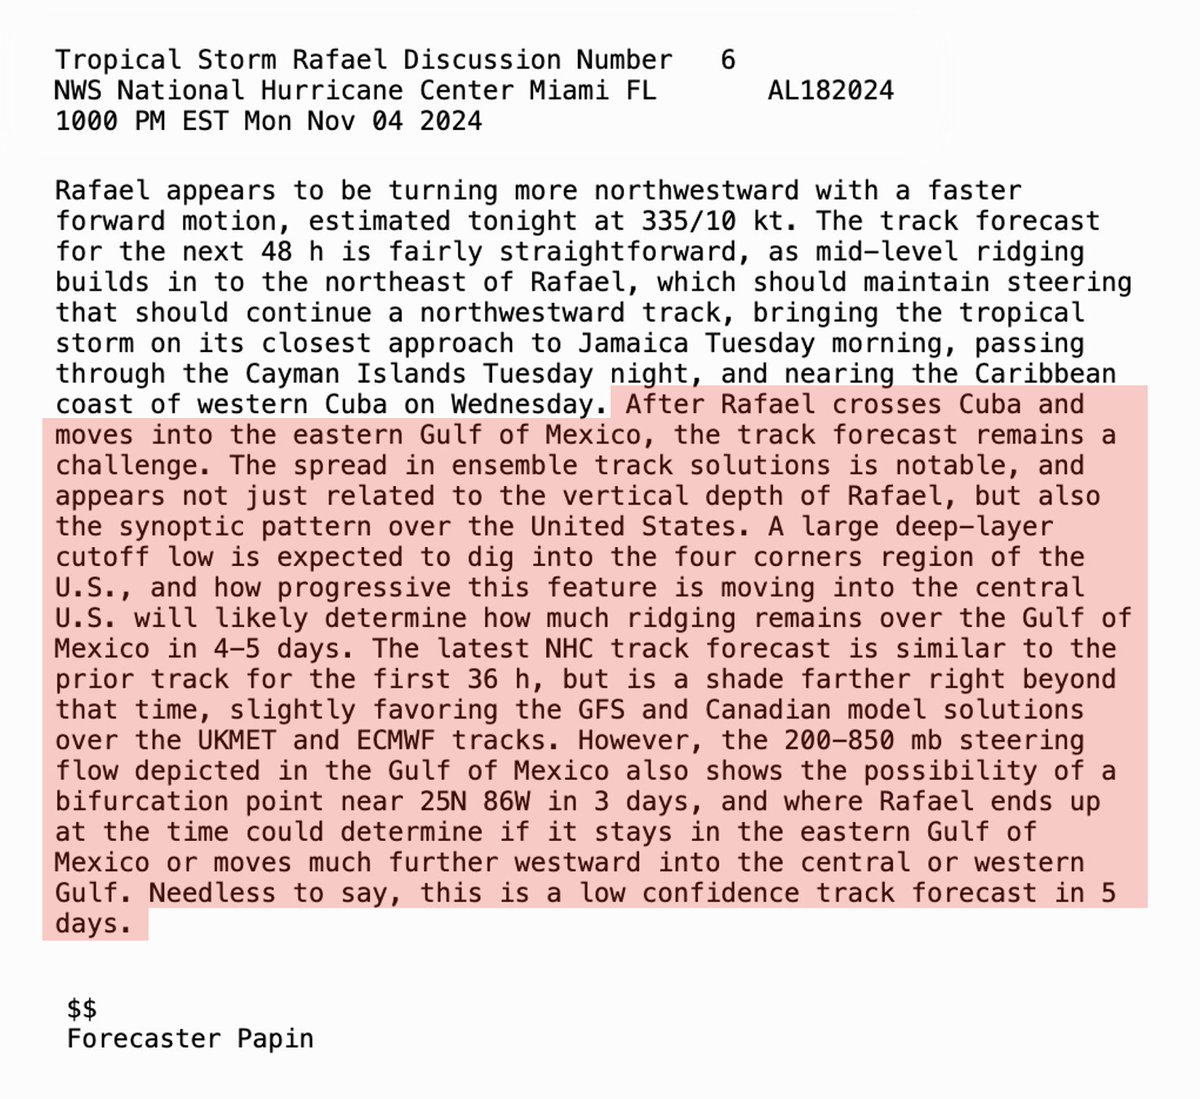
ALT NHC Forecast Cone 10pm EST 4 November
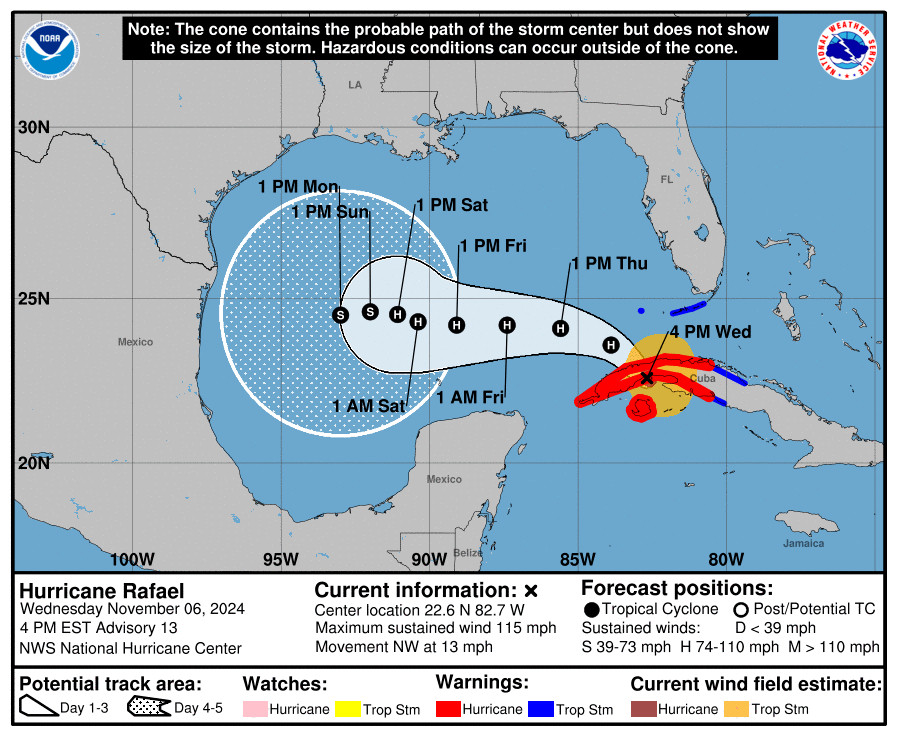
ALT NHC Cone for Rafael for 4pm EST 6 November