
The fastest business intelligence tool for humans and agents. Agentic AI, BI-as-code experience that allows teams to go from raw data to interactive dashboards.
Joined April 2020
- Tweets 866
- Following 253
- Followers 1,988
- Likes 406
297 Photos and videos


In this video, @JonWalls walks through how Rill enables a fully agentic BI workflow using tools like @cursor_ai, local development environments, and modern CI/CD practices — all while delivering instant, production-ready insights.
3
4
454
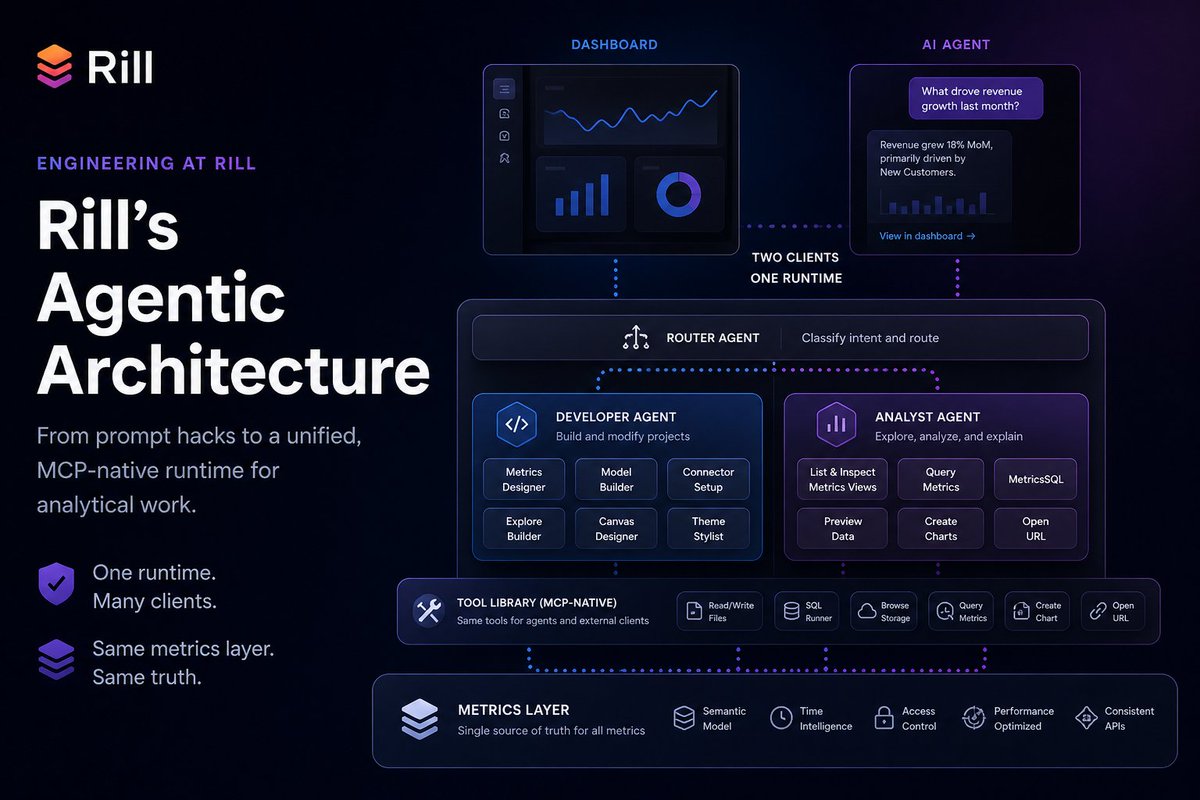
Rill is not building a parallel “AI answer engine” next to the dashboard. AI agents and humans operate on the same foundation. This post is a summary of how Rill’s AI system evolved from a handful of one-shot prompts into a cohesive, MCP-native runtime for analytical work.
The design choices had a huge payoff: One place to fix bugs, one place to add capabilities, and one consistent interface for humans, dashboards, agents, and external clients.
Read the full blog to learn more:
rilldata.com/blog/rill-agent…
3
201
Rill Data retweeted

May 6
Excited to speak at the @ClickHouseDB Gurugram meetup this saturday.
My talk: What Do Agents Need from Databases? Speed, Scale, and Semantics.
I’ll share how fast analytics, governed metrics, and semantic context become critical as AI agents start answering business questions directly — and how we’re thinking about this at @RillData with @ClickHouseDB.
RSVP: meetup.com/clickhouse-delhi-…
#ClickHouse #AgenticAI #RealTimeAnalytics #DataEngineering #RillData

1
1
237
Rill Data retweeted

May 5
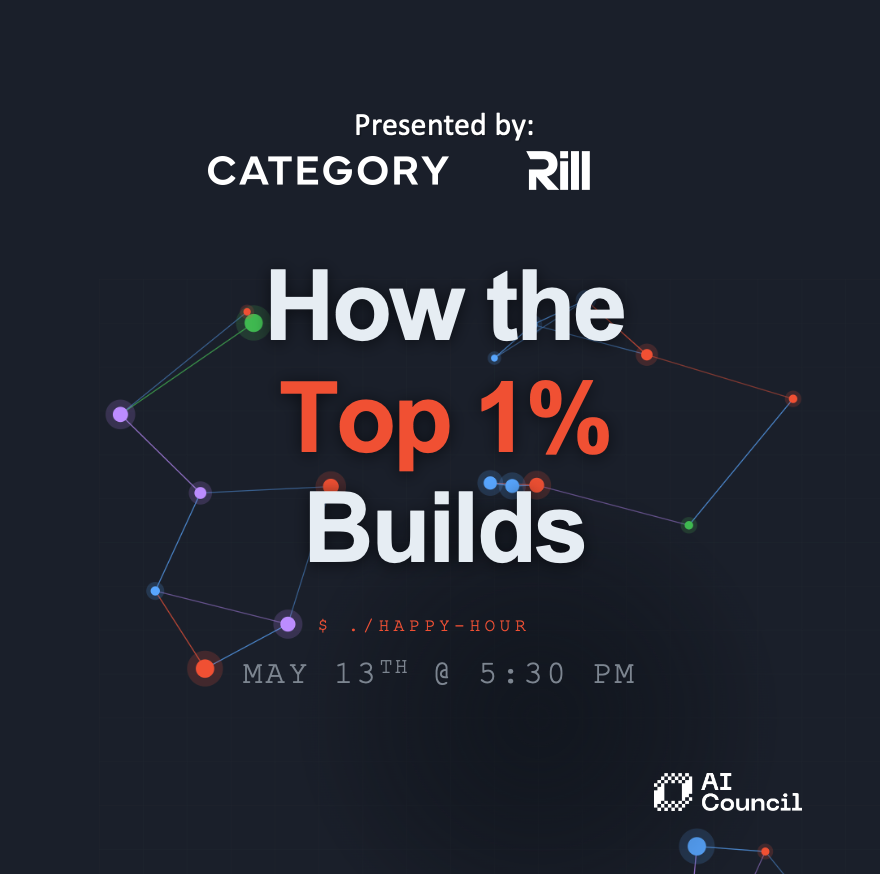
AI Council 2026 Party Update!
@Category_VC and @RillData are handing the mic to @wesmckinn (creator of the Python pandas and co-creator of Apache Arrow), @LinghuaJ (co-founder of @cocoindex_io), and @jacopotagliabue (co-founder of @Bauplan_labs) to talk about how agents are redefining what’s possible at the infrastructure layer.
Come enjoy drinks and eats while listening to these (truly) top 1% builders.
🗓️ Wednesday, May 13
🕠 5:30PM - 7:30PM PDT
📍Just two blocks from the SF Marriott Marquis.
See you there! RSVP: luma.com/61g18sqg
5
7
795
ICYMI - @sspaeti's latest blog looks at how BI evolved, how dashboards are actually used today, and what survives when AI enters the picture — starting with the foundation that was never really about dashboards in the first place, and ending with the problem nobody of who maintains it all.
1
1
5
476
At Rill, we believe that a BI-as-Code, versioned dashboards, and a governed interface aren't opposite to the AI future, but a necessary foundation that makes working with it easier, not only for AI systems but also for humans in the loop.
Read the full article:
rilldata.com/blog/ai-reveals…
1
109
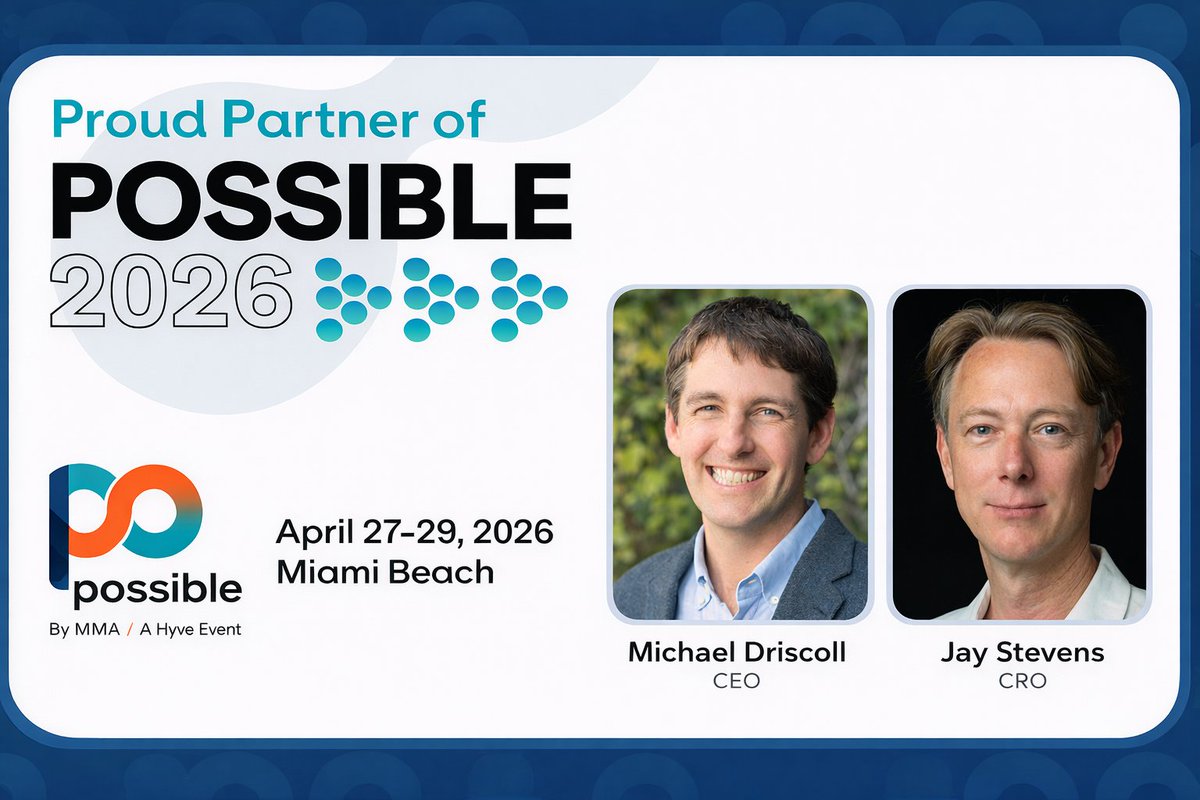
What a great week at @PossibleEvent. We met with folks managing massive data stacks at scale. With Rill, our customers can talk to their data using AI agents and get trusted, verifiable business insights in minutes. If you missed us in Miami, you can catch us at @mauvegas_.
rilldata.com/events/mau-2026


2
97
Rill Data retweeted

Apr 29
The world’s top developers are unlocking stunning gains in productivity with parallel agentic coding sessions, custom harnesses, and constant experimentation with frontier models.
This is more than an evolution in technique; it’s is a new breed of software engineering.
If you’re in SF on May 13, come join us for a fireside chat with Wes McKinney (@wesmckinn), creator of Python Pandas & Apache Arrow, and a pioneer of agent-enabled software development, alongside other founders at the @Category_VC offices, right after #aicouncil sessions conclude.

Apr 29

Excited to co-host an evening with @medriscoll on May 13th in our SF office featuring @wesmckinn (Principal Architect at Posit, creator of Python pandas project) and @LinghuaJ (Founder & CEO of @cocoindex_io).
Whether you are in town for AI Council or an SF resident, come hear what top builders are shipping today and how agents are reshaping AI and Data infra.
Spots are limited. Sign up here: luma.com/61g18sqg
@Category_VC @villi @_shriyanshk
1
1
1
566
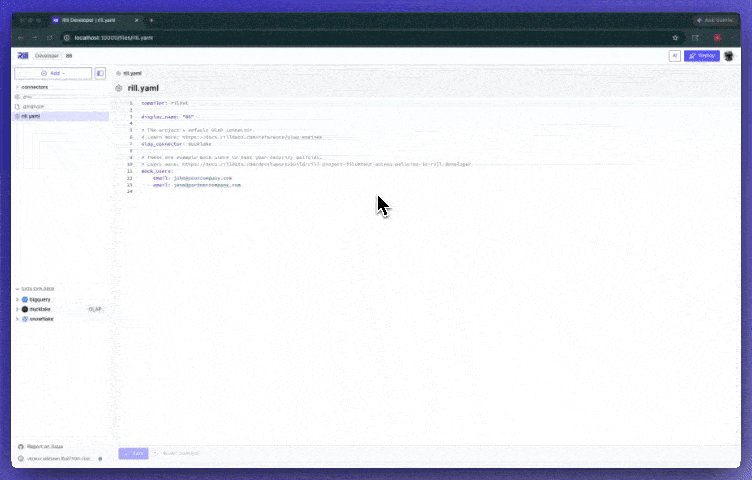
Check out the latest version of Rill (0.86). It's packed with two new live connectors for #BigQuery and #DuckLake.
Rill now ships a DuckLake live connector, letting you attach a DuckLake catalog and query it directly as an OLAP source for metrics views and dashboards.
docs.rilldata.com/notes/0.86
2
4
757
If you’re at #POSSIBLE in Miami, come say hi to @medriscoll and the Rill team 👋 (North Tropez Lawn #646). The future of analytics isn’t better dashboards. It’s interactive, real-time answers on top of governed metrics. Let's meet up and geek out about the technology side of #adtech!


2
164
Traditional BI tools often treat heavy queries as something to be avoided, relying on caching to keep dashboards responsive. "But when you're using something like @ClickHouseDB, there's no need to avoid hitting the dashboard hundreds or thousands of times." - said @medriscoll
1
2
185
Together Rill & ClickHouse point toward a new model for analytics, built for a world where every business process generates events.
For Rill's customers, that translates into instant slicing & dicing, alongside fast conversational agents that operate directly on live data.
clickhouse.com/blog/rill
137
Modern BI is evolving fast — and the combination of Rill Data @antigravity shows exactly where it’s headed. In this walkthrough, we explore how developers and data teams can use AI agents to build, modify, and scale analytics workflows entirely in code.
rilldata.com/blog/video-buil…
2
229
.@medriscoll remembers walking down 24th Street in SF, and @l2k turned to him and said: "AI is all that matters. Like, it's all that matters, man."
In this episode, he traces the full arc: from an unpaid internship at OpenAI to what he thinks comes next.
rilldata.com/blog/how-the-we…
2
238

Rill Data retweeted

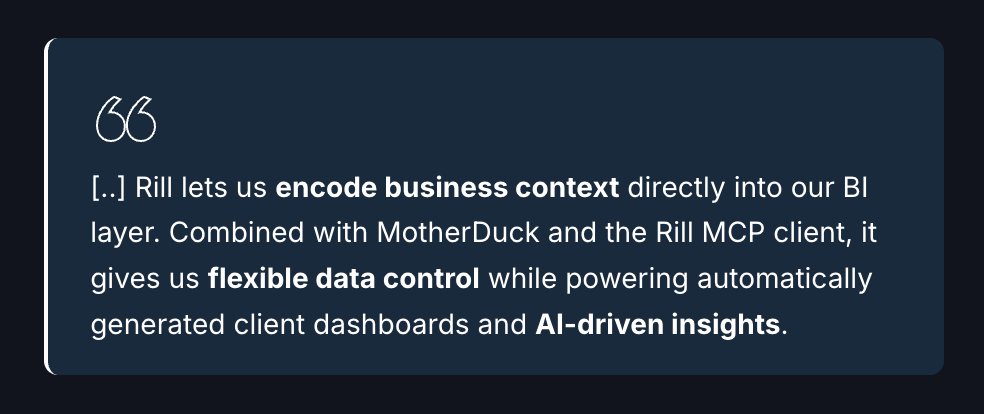
8/ Check out the full breakdown of how Rill is rethinking the semantic layer for the age of AI here: dataengineeringweekly.com/i/… #SQL #Analytics #DataScience
1
214
Rill Data retweeted

Apr 15
We've heard it all. BI and dashboards are dead. But every time, only to rediscover its power and resurrection whenever we need grounded data analysis in any enterprise and startup space.
Benn Stancil was writing about it in 2021, drawing parallels to the Salesforce "End of Software" declaration in 2000. We compare the parallels with today, as it's very interesting, as it's almost the same statement today with AI, that no more software developers are needed.
But is BI dead today? It depends on what you mean by it. If you mean ad-hoc creation of a visualization, probably yes. But if you mean a well-crafted operational dashboard, where you can see your whole company performing in a split second by looking at a single, highly dense dashboard with individual charts and visualizations tailored to convey information about each sub-area in the best possible way. Probably not.
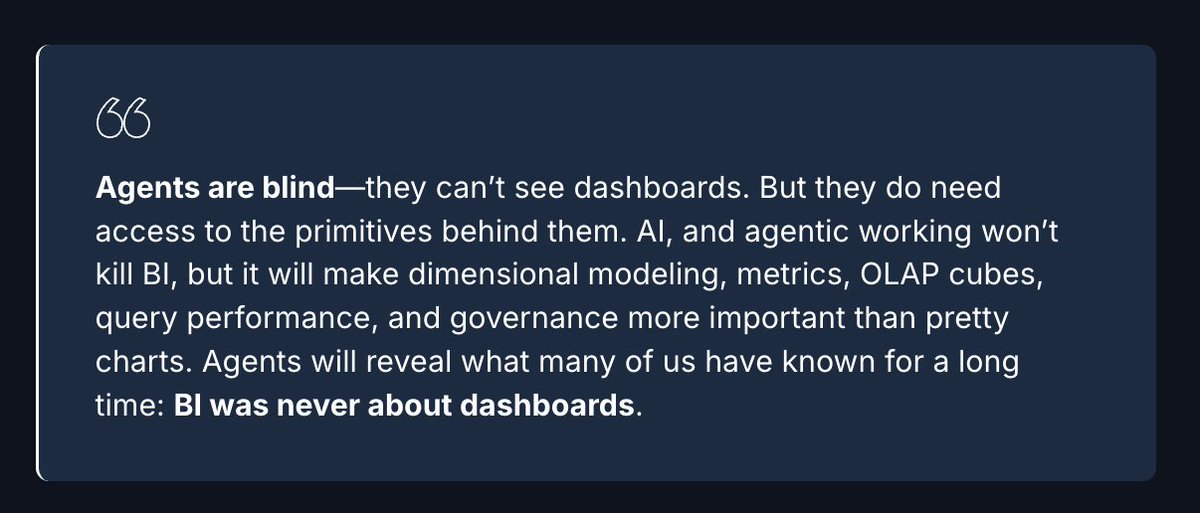
However, BI was never just about dashboards. Many need the extracts BI provides from your large SAP system, linked to the right customers in the CRM, enhancing decision-making even further. It's the primitives behind the dashboards that matter more: speed, metrics, and the semantics behind them. The hard work of aligning the business, verifying the numbers are correct, and joining and aggregating at the right granularity.
Data projects need governance and implementation of best practices. Otherwise, we are back to the same old way of using local Excel files, where everyone is doing their own thing with no alignment, governance, or broader verification.
But most importantly, who is maintaining it all with the explosion of dashboard creation? What's the solution? In this new article, we look at how BI evolved, how dashboards are actually used today, and what remains relevant.
There's a good approach that we know works well, which involves the same old ingredient that we use in the software domain: artifacts can be versioned, recoverable, and declared. BI needs trustworthy metrics, semantics, AND ownership.
This can be achieved with some version of BI-as-Code, and with that, we can also generate safer visualizations. After all, the hard part was never generating visualizations; it was having metrics and a strong backend. Having a unified data interface that has an agent with access to source, ETL, and dashboard.
And Amdahl's Law still applies: 50x faster generation of BI charts, but if the tools it depends on were designed for human speed with slow query APIs, no CLI support, and unversioned metrics, the overall gain collapses to 2-3x.
So, the future with AI reveals why BI still matters, and it's most likely not the dashboards themself. Read more in the full article at rilldata.com/blog/ai-reveals….
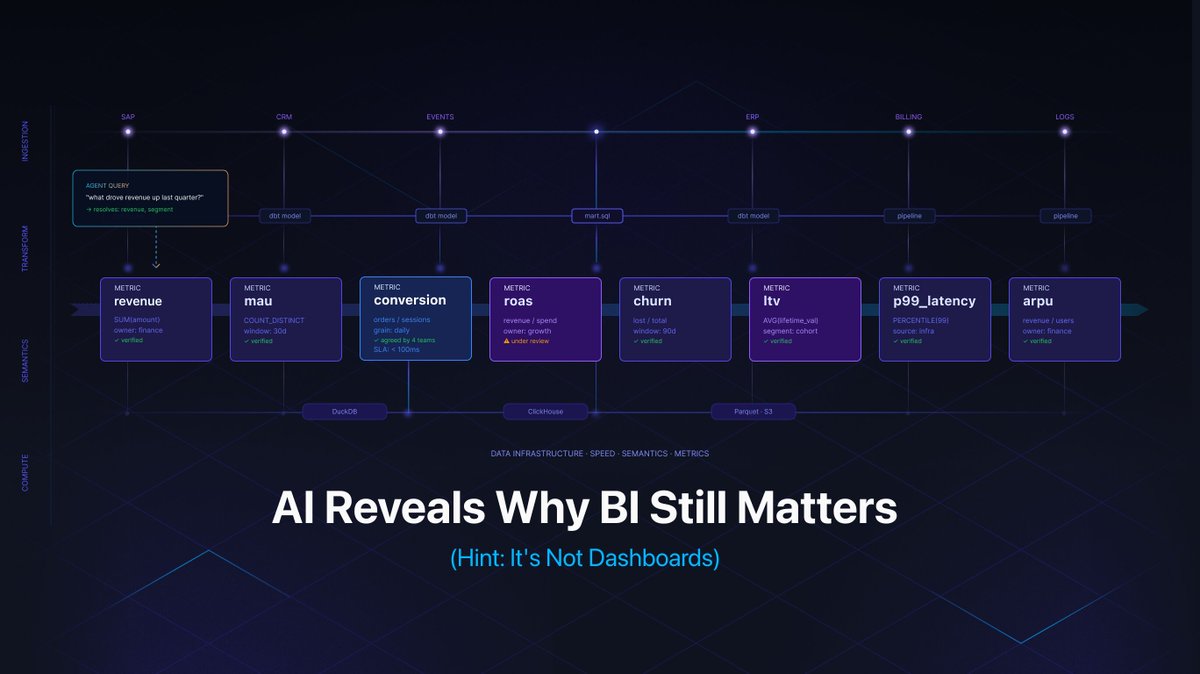
ALT AI Reveals Why BI Still Matters (Hint: It’s Not Dashboards)
1
4
13
1,781
Rill users are data engineers, analytics engineers, BI developers, and platform teams — all building data pipelines, defining metrics, and delivering interactive dashboards with Rill.
In Rill 0.85, we improved the first mile experience to make getting started with Rill smooth!
docs.rilldata.com/developers…
2
227
Rill Data retweeted
Apr 11
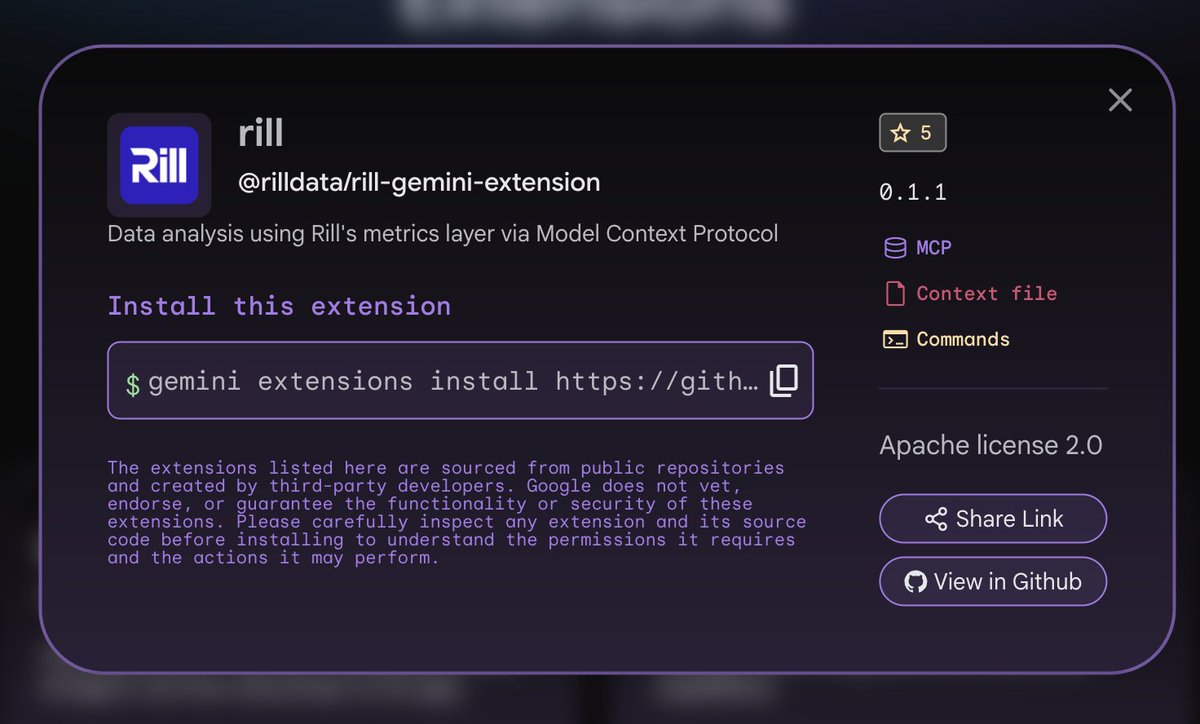
Introducing Metrics SQL @RillData : query your semantic layer with plain SQL.
Define metrics once. Every dashboard, agent, and API gets the same governed answer.
No new DSL. Works with Claude ChatGPT via MCP.
rilldata.com/blog/introducin…
#SQL #DataEngineering #SemanticLayer #AIAgents
1
4
349
How easy is it to answer a question like “why is this campaign underperforming?” Rill can get that answer in seconds where other tools might take hours or days to get to that root cause analysis.
We’ll be at POSSIBLE in 2 weeks. Leading ad tech platforms use Rill’s agentic analytics platform and we’d love to show you the platform in action.
Use the link below to book a personal demo.
rilldata.com/events/possible…
2
101