
Family, Flying, Ice Hockey, Photography, Nature, Cooking, & Coffee. Lucky enough to work for @tableau | 3x Tableau Conference speaker | 2x ESRI UC speaker
Joined March 2011
- Tweets 345
- Following 606
- Followers 90
- Likes 353
77 Photos and videos


Pinned Tweet

25 Apr 2020
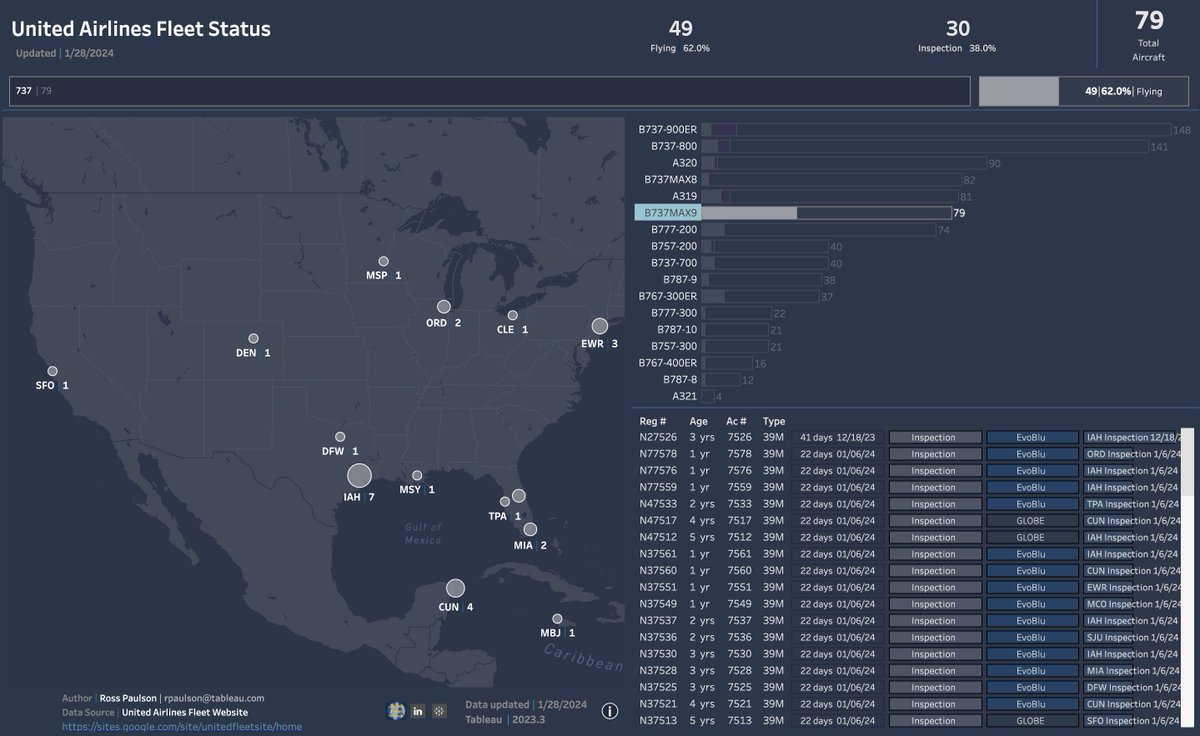
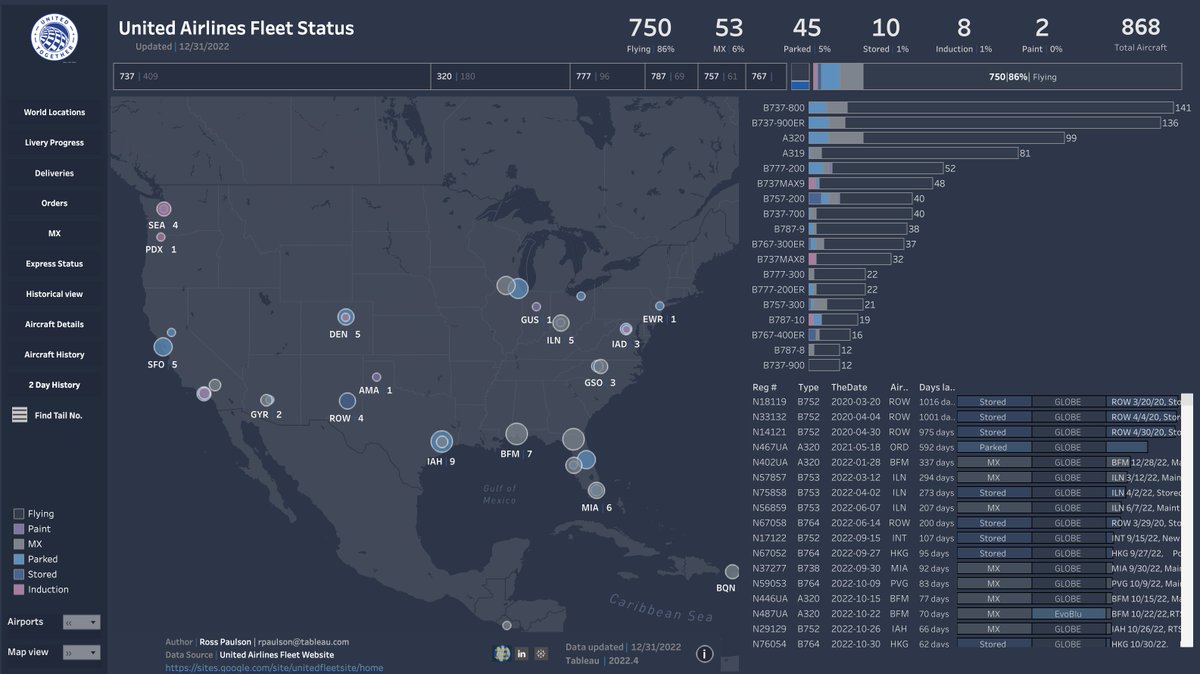
I created a Map/visualization based on the mainline stored aircraft. You can click on the the locations or type of aircraft and see where they are stored. Based off @UnitedFleetWebs "Status" data. public.tableau.com/profile/r…
4
Ross Paulson retweeted

28 Sep 2023
To do:
Make maps
Make maps
Make maps
Make maps
Make maps
Make maps
Make maps
Make maps
Make maps
Make maps
Make maps
Make maps
Make maps
Make maps
Make maps
Make maps
Make maps
Make maps
Make maps
Make maps
Make maps
Make maps
Make maps
17
34
340
23,901
Ross Paulson retweeted

10 Jul 2023
Check it out! If you missed my #Data23 session, I'm doing an abbreviated version of my presentation on mapmaking in @TableauPublic at the next @HealthTUG!
And by "abbreviated," I mean tighter, fewer mistakes, only 1 or 2 tangents, less rambling...🙃
10 Jul 2023

#DataFam! We're excited to announce our July 26 meeting at 1 PM CDT/2 PM EDT! We've got a great mix of content for you--SciCom with Young Song, Epic EHR data mart implementation with Elaine Sundby, & mapmaking with our own @professorkao! (He's doing an encore of his TC talk!) 1/2
3
5
50
3,287
Ross Paulson retweeted

27 Mar 2023
Nice new post from Jim Walseth and @rossp165 on the @tableau Intersects calculation! Fun stuff! 🗺
How to Use the Intersects() Calculation in Tableau tableau.com/blog/how-use-int…
6
22
2,561
10 Aug 2022
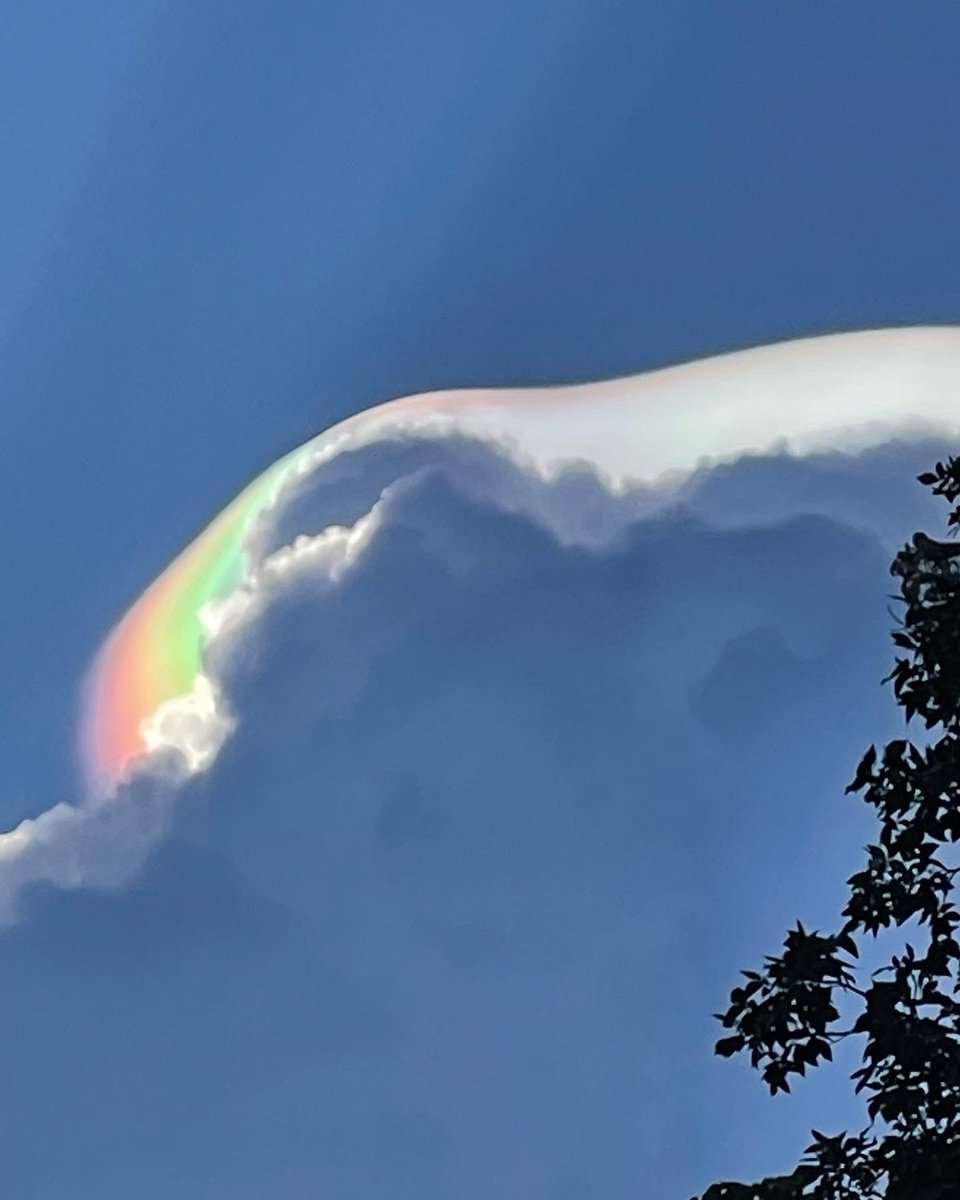
What a view of a 52,000 foot tall storm west of Leesburg, VA. Ice crystals! @dougkammerer @ChuckBell4 @nbcwashington
1
24 Mar 2021
Great blog post from the amazing @FlerlageKev Alternative Map Projections in Tableau. flerlagetwins.com/2021/03/al…
1
5
6 Mar 2021
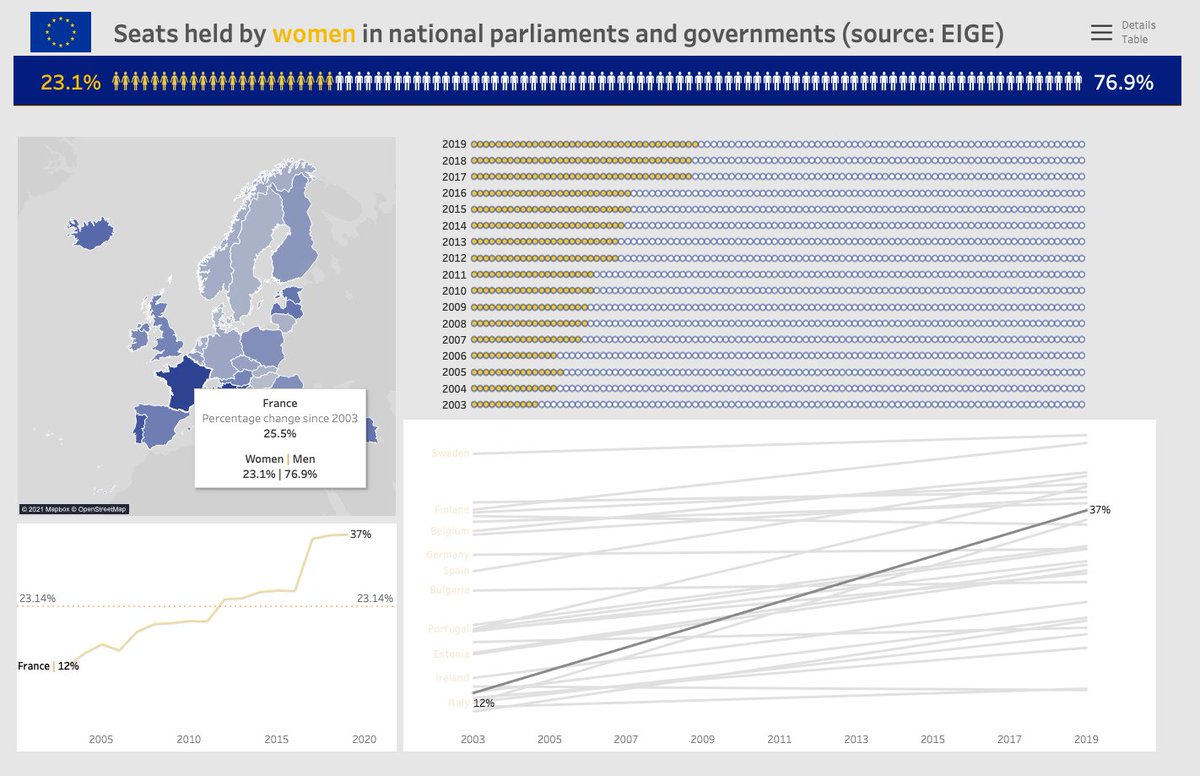
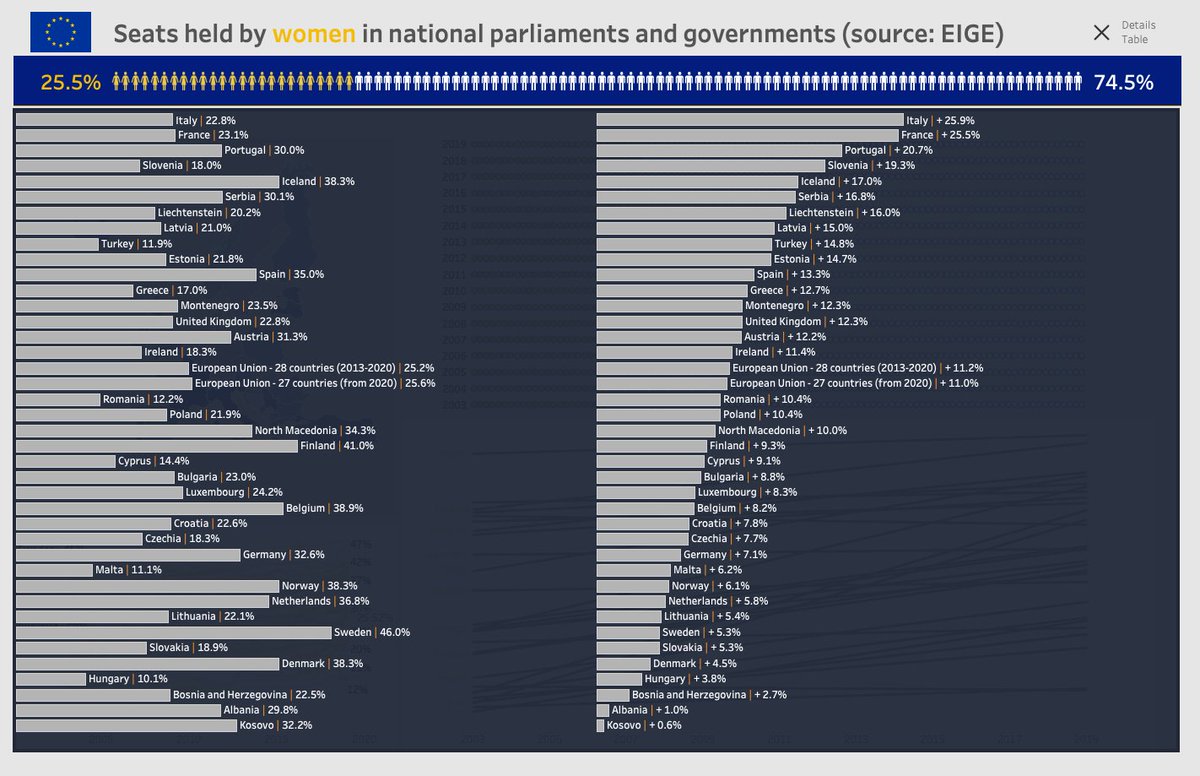
Seats held by women in national parliaments and governments (source: EIGE) Week 9 of #MakeoverMonday
public.tableau.com/profile/r…
#tableau #tableauPublic
1
2
16 Feb 2021
Another #MakeoverMonday Week 7. What's the point of Valentine's Day? When asked...
public.tableau.com/profile/r…
1
5
9 Feb 2021
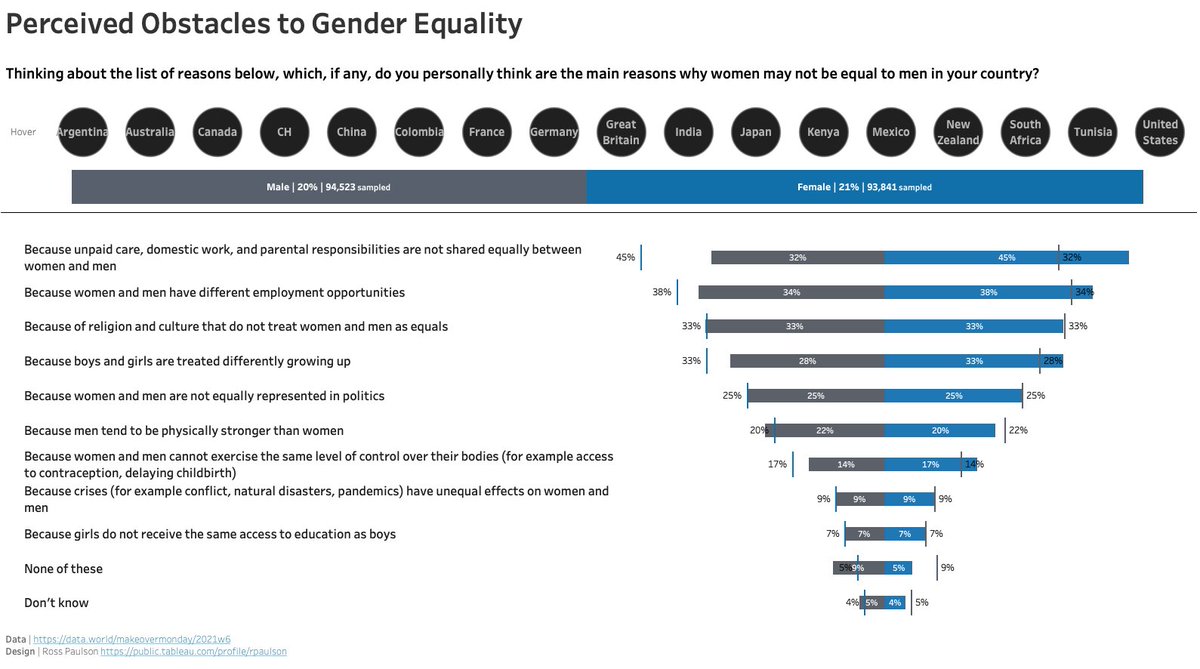
#MakeoverMonday #week6 Perceived Obstacles to Gender Equality. #Viz5 #gender #Equality #TableauPublic #Tableau
public.tableau.com/profile/r…
1
1
4
1 Feb 2021
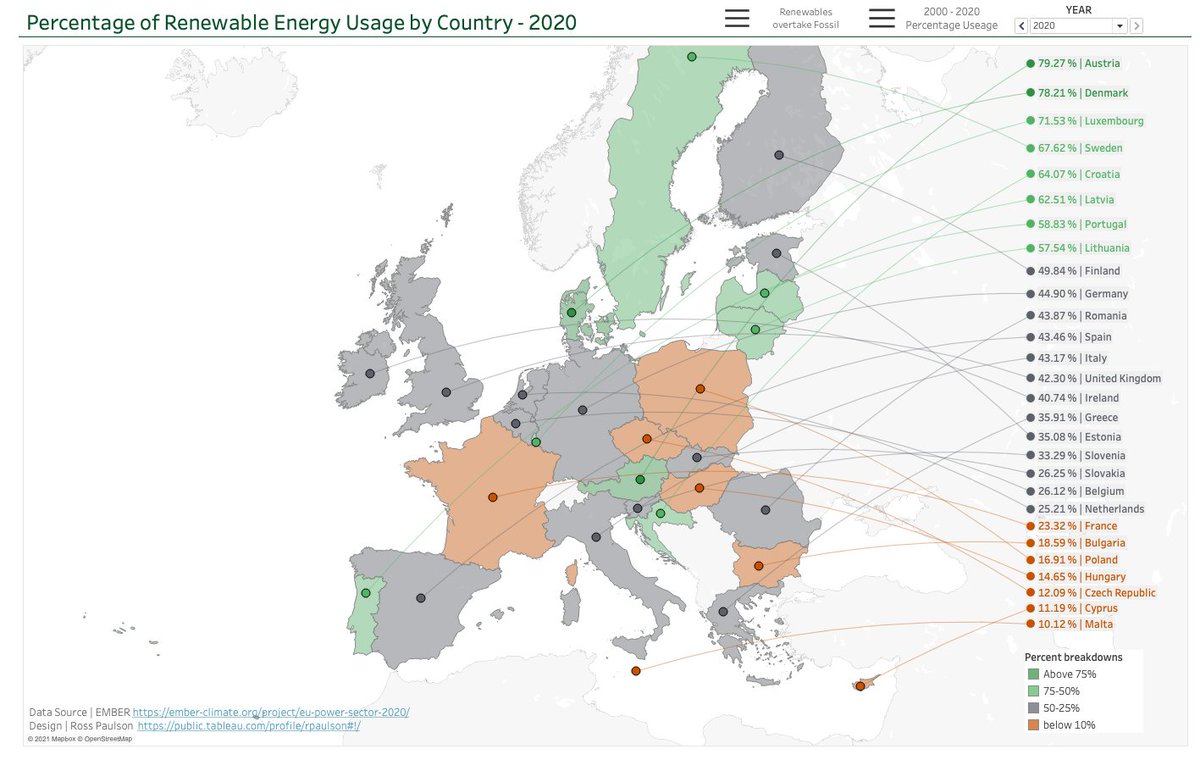
Countries in Green rely on more than 75% of their energy from renewable sources! 2020 was the first year Europe used more renewable energy than fossil fuel. #MakeoverMonday #week5 #tableau #Tableaupublic
public.tableau.com/profile/r…
2
1
2
1 Feb 2021
Countries in dark green... Countries in light green are above 50%, still not bad!
1
26 Jan 2021
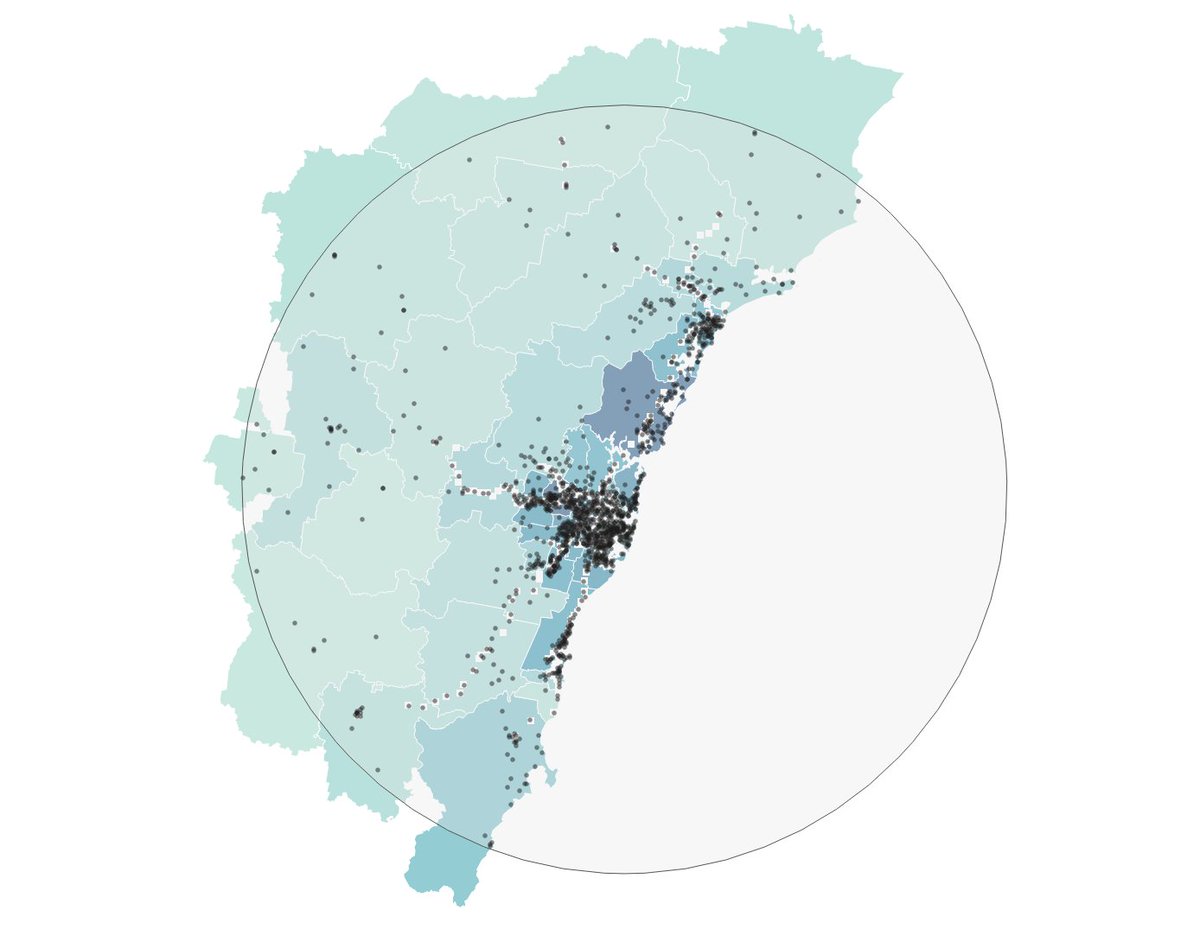
Week 4 of #MakeoverMonday Indian Mines. I spent some time building the map background in #mapbox. Learned to filter and adding shapefiles in Mapbox. #datafam
public.tableau.com/profile/r…
1
5
17 Jan 2021
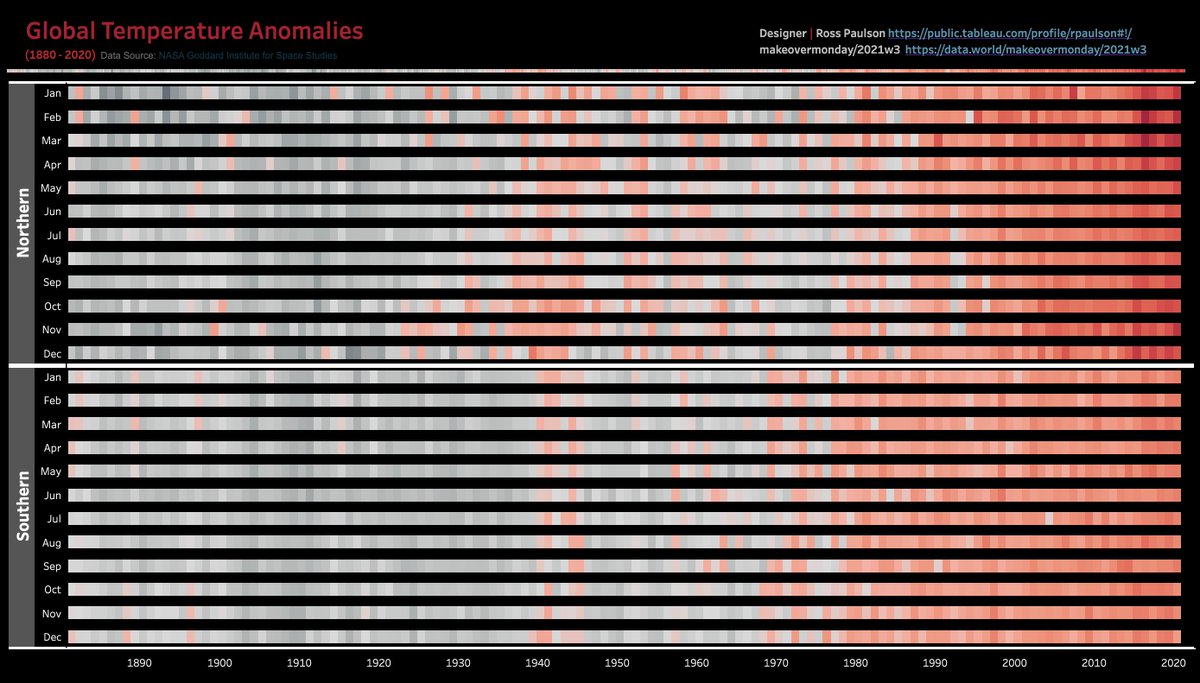
What's going on with Global temperatures?
#Week3 of #MakeoverMonday Published on my #TableauPublic page. public.tableau.com/profile/r…
Data: data.world/makeovermonday/20…
1
6
14 Jan 2021
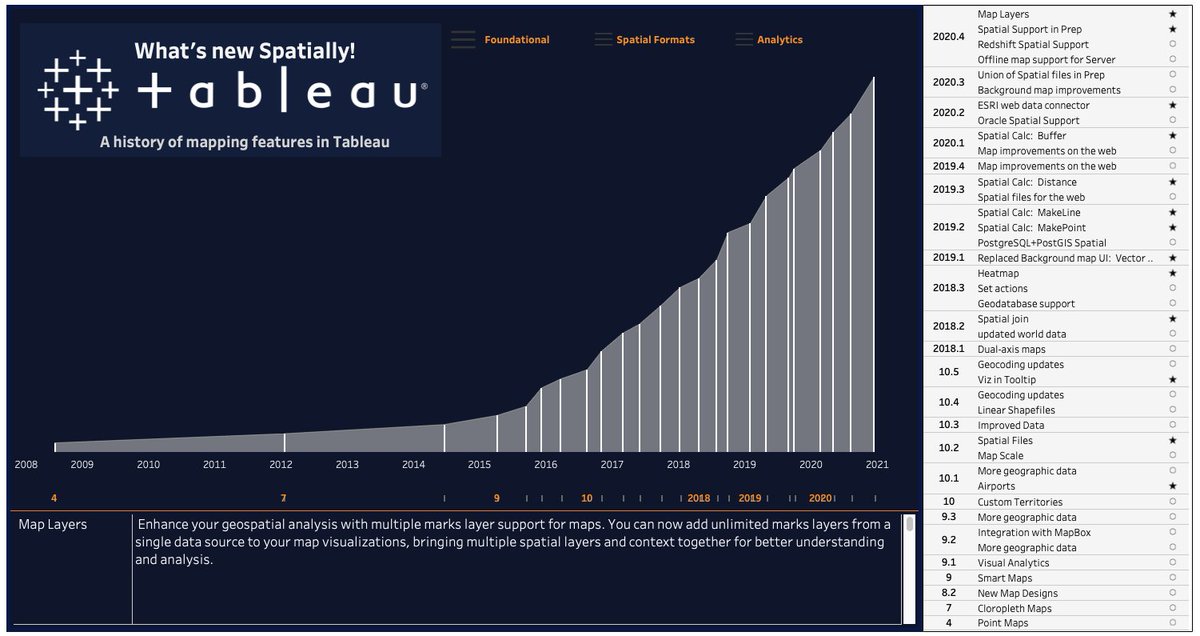
If you need a quick reference for #mapping / #geospatial features in #Tableau (and when they were created), I created a visualization in #TableauPublic.
public.tableau.com/profile/r…. .
1
4 Nov 2020
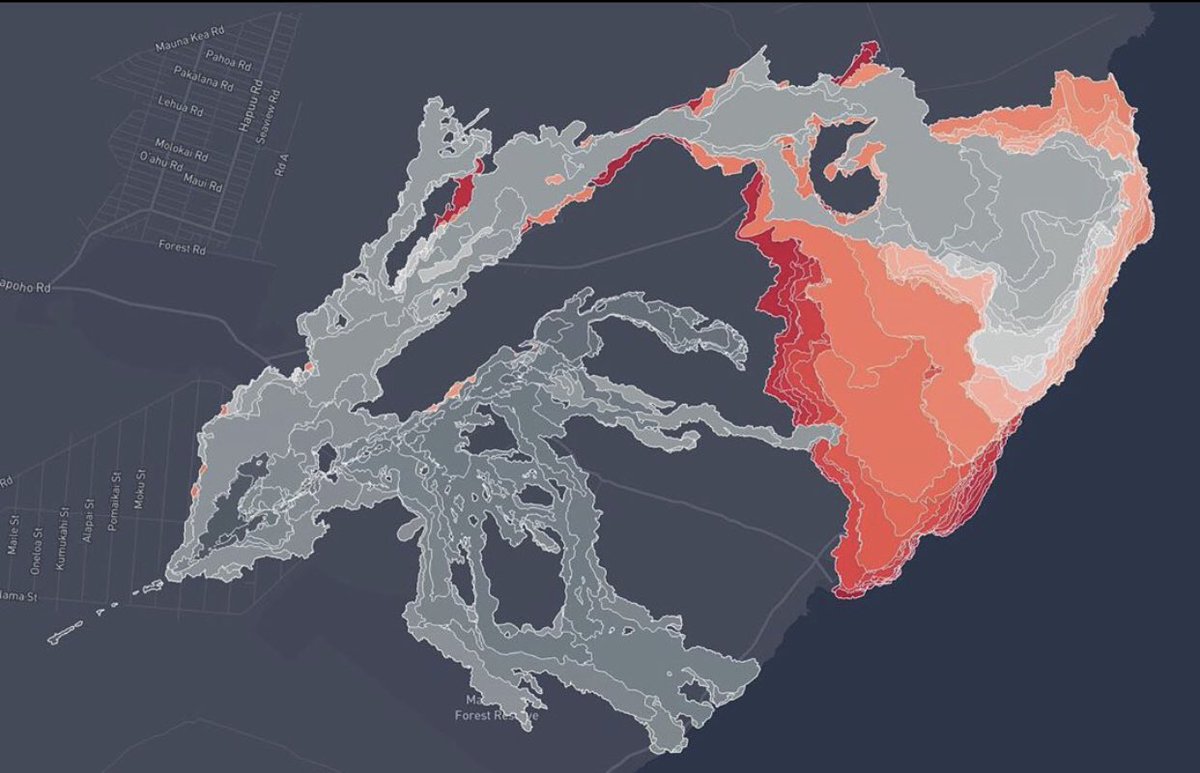
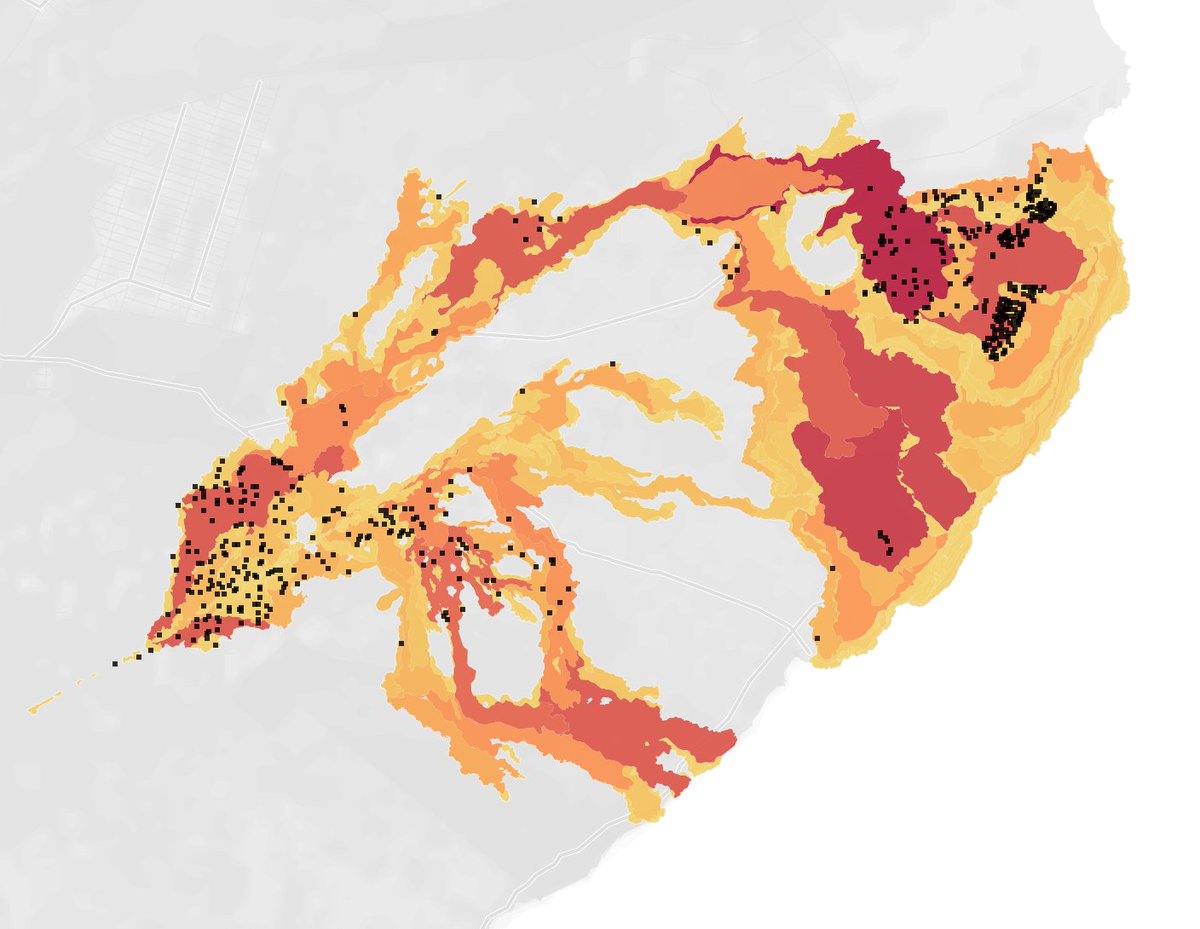
#30DayMapChallenge | day 3 polygons. 2018 #kilauea eruption event, #shapefile from @usgsvolcanoes mapped in @tableau
Date Range: 5.3.18 to 8.9.18.
1
3
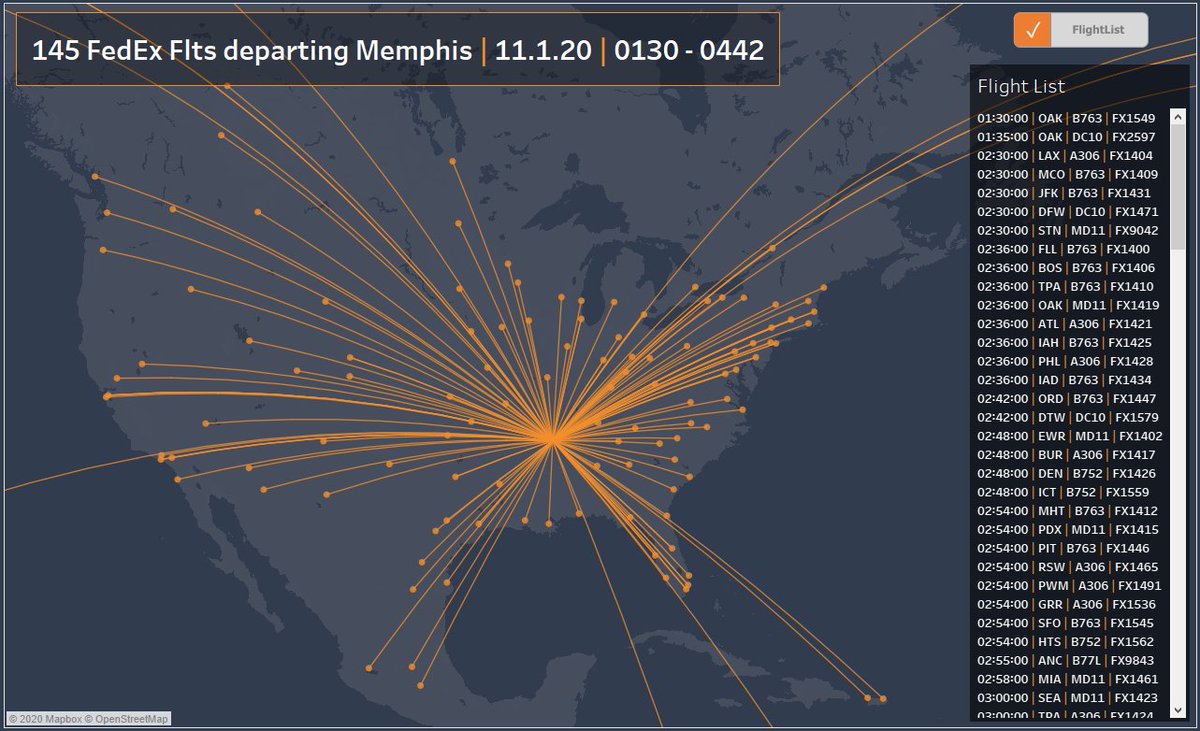
3 Nov 2020
#30DayMapChallenge | Day2 Lines. @FedEx launches 145 aircraft starting at 1am... Created in @tableau and posted on @tableaupublic
public.tableau.com/profile/r…
2
4
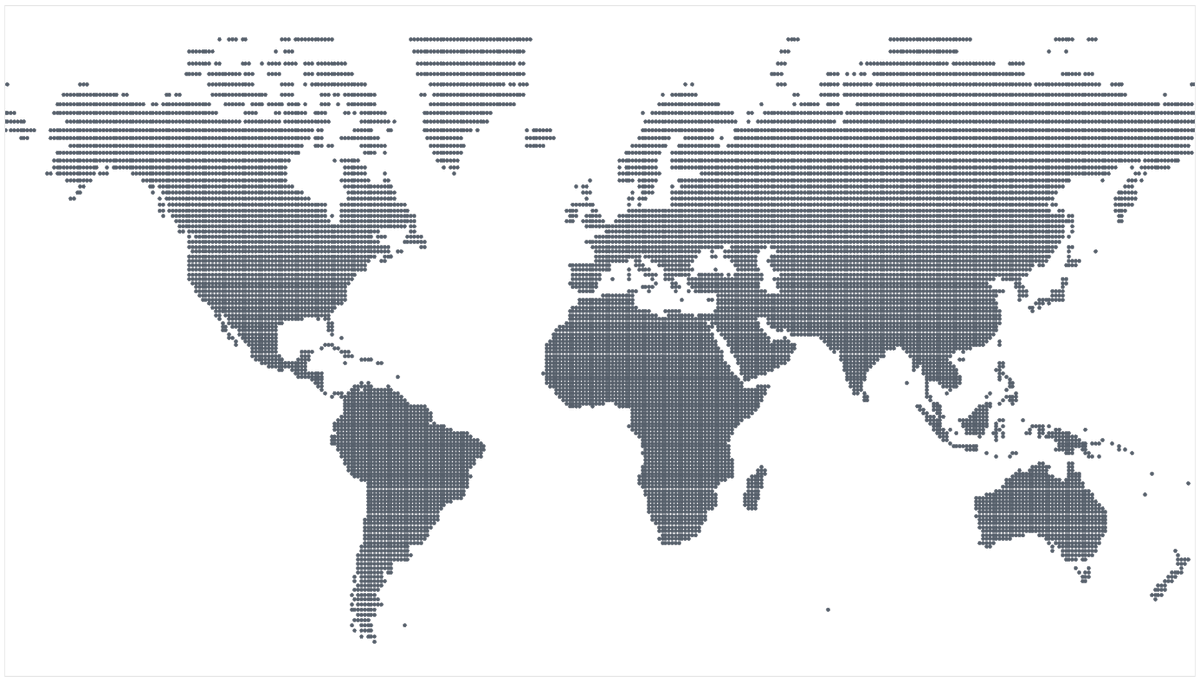
1 Nov 2020
World of Dots | #30daymapchallenge - day 1
It's not just a graphic, these points are geo-rectified where each point represents one degree of Lat/Lon. Find the Viz and download on @tableaupublic
public.tableau.com/profile/r…
1
6
1 Nov 2020
Here’s the HOW: b/c there’s no data out there! Made an xls with ever Lat/Lon. In Tableau, I spatially intersected the L/L grid with a shapefile. This keeps the land & retains country metadata to each dot. The hardest part was making the Lat/Lons. Great for fun graphics.