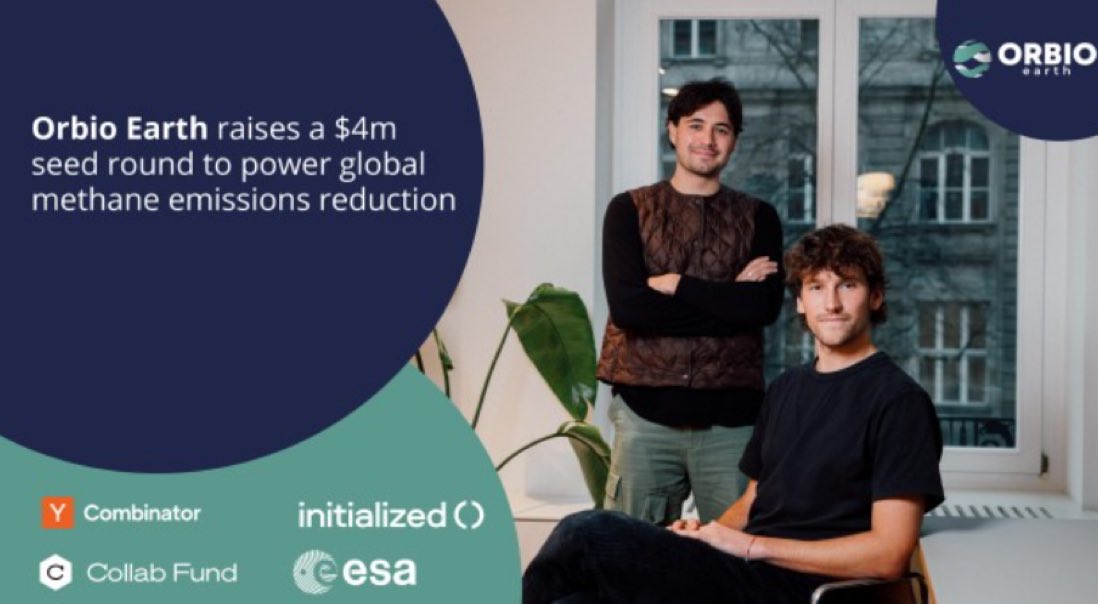
Rapid funding for climate change solutions.
- Tweets 2,728
- Following 1,276
- Followers 250,458
- Likes 6,022


ALT Yearbook-style collage showing “1996” and “2026” around the Internet Archive headquarters building, playfully decorated with a party hat, noisemaker, and doodles, suggesting the passage of time and ongoing civic institutions.
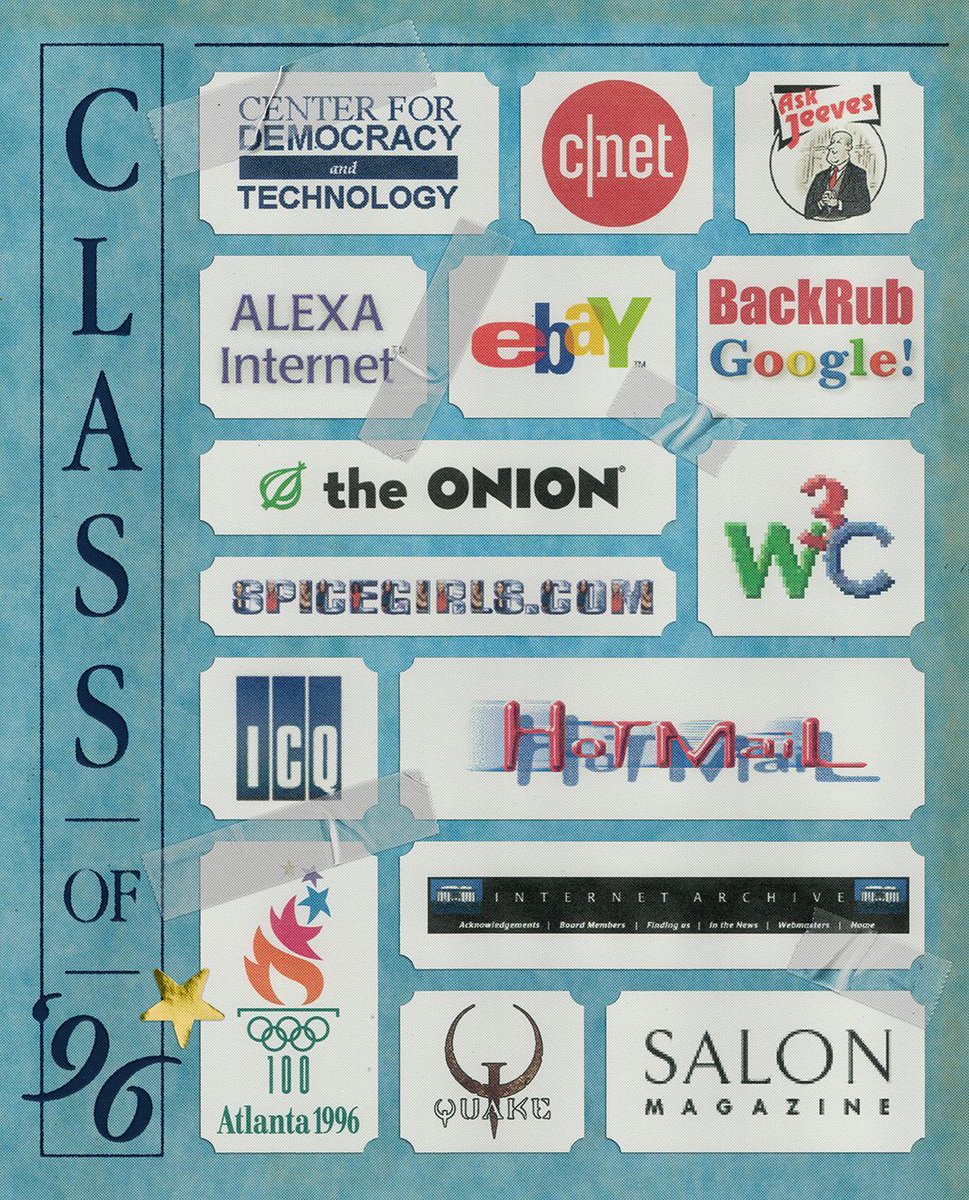
ALT Yearbook-style “Class of ’96” page featuring a grid of early web brands and sites, including Center for Democracy and Technology, CNET, Ask Jeeves, Alexa Internet, eBay, BackRub (Google), The Onion, Spice Girls website, ICQ, HotMail, Internet Archive, Atlanta 1996 Olympics, Quake, and Salon Magazine.


ALT Stacked bar chart of government spending by category (social protection, health, education, economic affairs, public services, other, defense) as a share of GDP for a selection of OECD countries, where it compares spending composition and shows totals of 28% to 57% of GDP with an OECD average of 43%. Data source: OECD (2026). License: CC BY to Our World in Data.