
Ex-bank & HF. Market mechanics | capital flows | structured process | composure in volatility | bubble dynamics. Futures • Cash Equities • ETFs • Options.
Joined June 2025
- Tweets 9,915
- Following 485
- Followers 1,038
- Likes 15,683
Photos and videos
Good morning 𝕏 fam!
Have a great Monday and a profitable week.
9
14
189
Good morning and a Happy Weekend to you all!
I did make a post about options hedging but then remembered it's Saturday so deleted it, closed the charts, had a stern word with myself in the mirror, and put the music on. Zen time.
What are your plans for the weekend?
25
33
1,504
Well, that one escalated quickly in $PL
50ema gave way on the open and the stock closed down 26%, halfway to the buy zone already.
@theaveragegal__ thank you for bringing it to our attention 😉Have a great weekend.
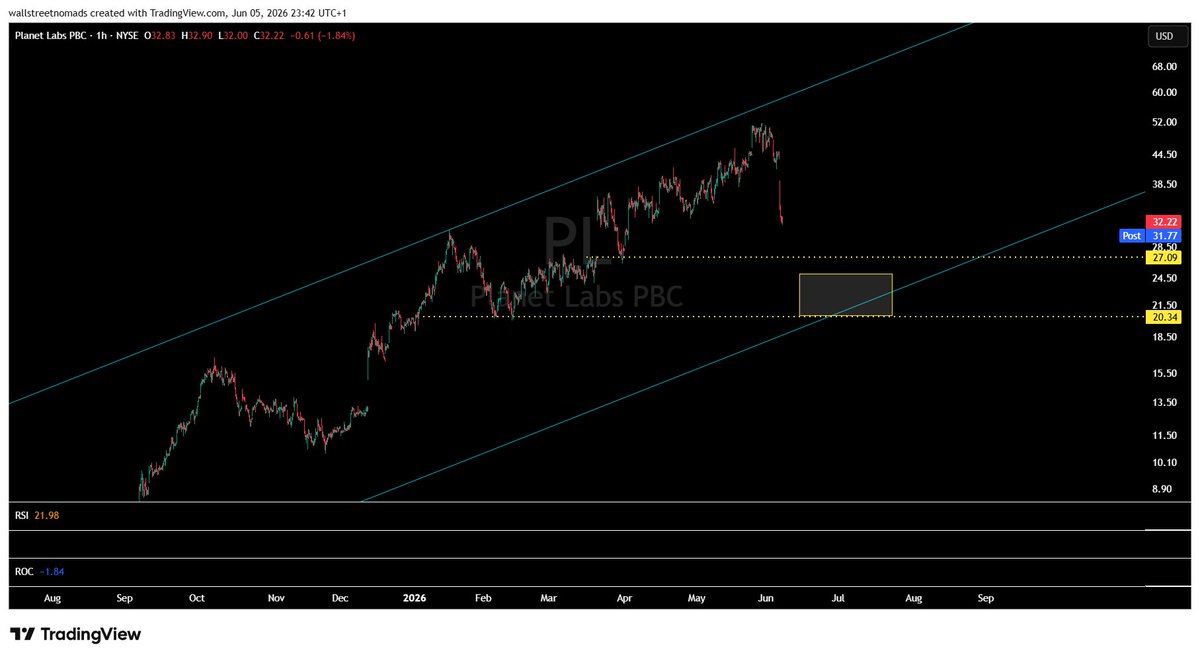

$PL Planet Labs quick technical run down post ER last night.
Price is trading between two trend channels. Last night closed right on the shorter term, steeper uptrend around $43.
Failure to hold the 50ema at $39 and regain the trend in the short term opens the way for a visit to the lower end of the longer term channel in the $22-27 zone.
Regain the channel and the battle continues higher into the summer until one of them gives way.

3
14
738
On Tuesday we said it is time to buy protection.
On Wednesday the market topped.
That is all.
$SPY $QQQ $SMH $VIX
x.com/wallstnomads/status/20…
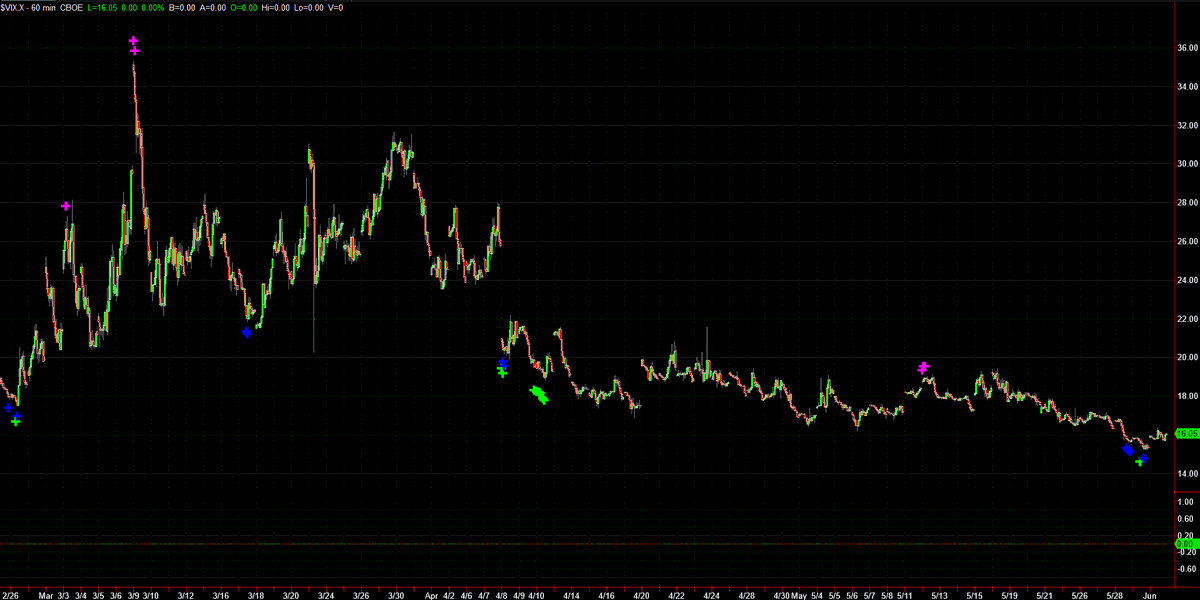
Good morning all.
Just a heads up that we've printed repeated indicators on $VIX hourly over the last few sessions.
Sometimes that leads to just a quick pop, at others it can lead to a significant volatility event.
Time to scoop some cheap protection.
4
11
545
$PL Planet Labs quick technical run down post ER last night.
Price is trading between two trend channels. Last night closed right on the shorter term, steeper uptrend around $43.
Failure to hold the 50ema at $39 and regain the trend in the short term opens the way for a visit to the lower end of the longer term channel in the $22-27 zone.
Regain the channel and the battle continues higher into the summer until one of them gives way.
5
14
2,448
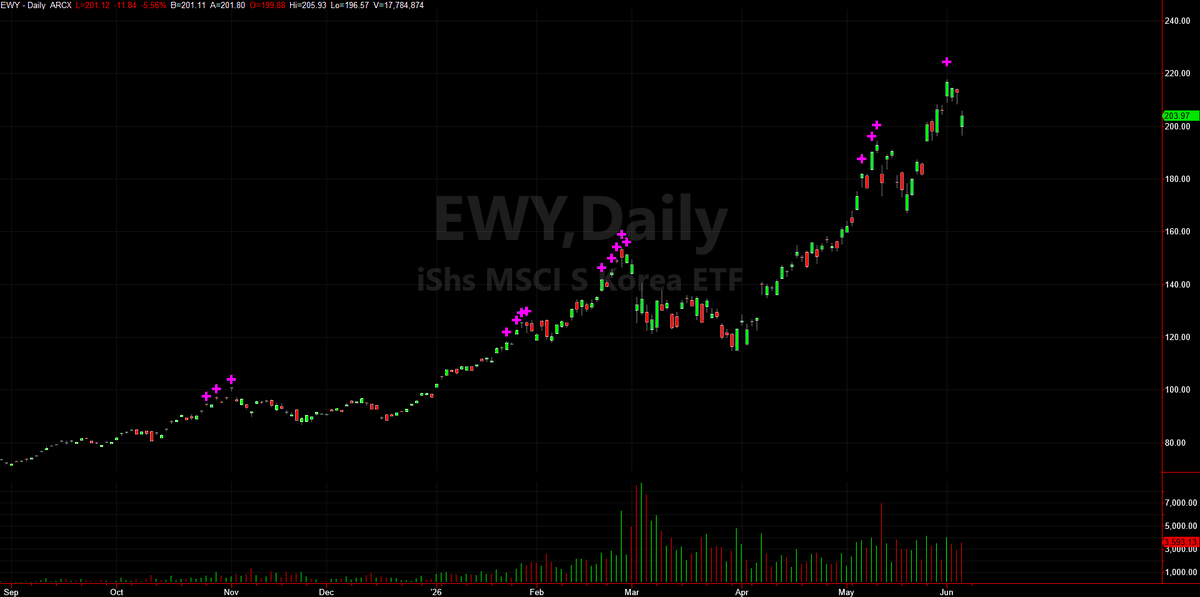
SERIOUS alert for #Korea tonight ladies and gentlemen. Please repost / bookmark if you see what we see.
$EWY may be providing better clues than the $KOSPI at this juncture. If this plays out then this is likely to be a global event.
Chart 1 - daily exhaustion indicator printed on Monday.
4 occurences over the last 12 months with results as follows:
- sideways action for 3 months with max drawdown of 7%
- sideways action for a week before rally resumed
- drawdown of 20-30%
- drawdown of 10-25%
Current indicator has already seen a 10% drawdown from Monday's close to today's lows. Is that it? Maybe.
But here is the interesting overlay....
Chart 2 - Potential 3 day island reversal.
Island reversals were present on the first and third occurences of exhaustion detailed above. Nothing on the one where it ramped higher after a week.
The price action of an island is an exhaustion indicator itself as it demonstrates a crowd willing to pay a gap up price and higher for a short period of time but has no further crowd behind it and thus leads to a gap down a day or so later followed by selling that outweighs the buying.
Call it a point of price equilibrium, if you will.
None of this is visible in the Kospi chart. This is predominantly US investors behavior towards the Korean market. If the ETF is showing this weakness, those who are directly in the Korean market may well be selling into the strength there too.
Too early to tell but longs better be extremely careful here. The magnitude of drawdown on the two prior occasions that these two indicators have overlapped has increased over time.
With the Kospi trading at a record extension of 73% over its 50 week ema. this is the kind of early tell that we expect to see when the bubble finally cracks.
Longs are not only playing with fire, they are doing so while standing next to a gas pump.

4
1
15
917
WOW! Our first 1,000 followers.
Thank you all for your support and encouragement. In the words of Tina Turner, you are all Simply The Best!
Thank you all for your content and daily interaction, such a great forum for sharing different views and trading styles, from people of all corners of the world at all stages of their own personal or professional journeys. FinX is singlehandedly the best financial online community out here by a country mile.
80% of our growth has come in just the last few months, and 50% of it in the last month or so. Which goes to prove - stay focused, avoid politics like the plague, engage and have fun. The world isn't one big chart, enjoy the journey.
Love you all. Oh, and I win the bet with my partners who bet that we would never reach this milestone in the first year, who then doubled down in March when we were still at 300. Anniversary is June 8.
As always, its all about timing. 🤣

44
47
2,349
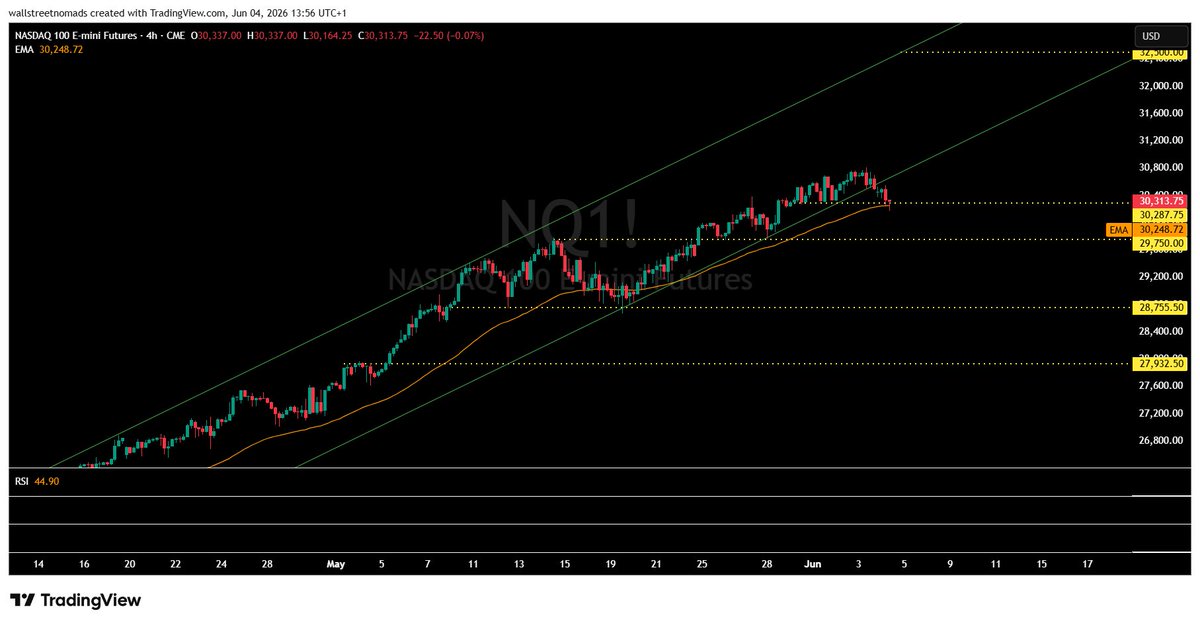
Good morning a very happy Thursday to you all.
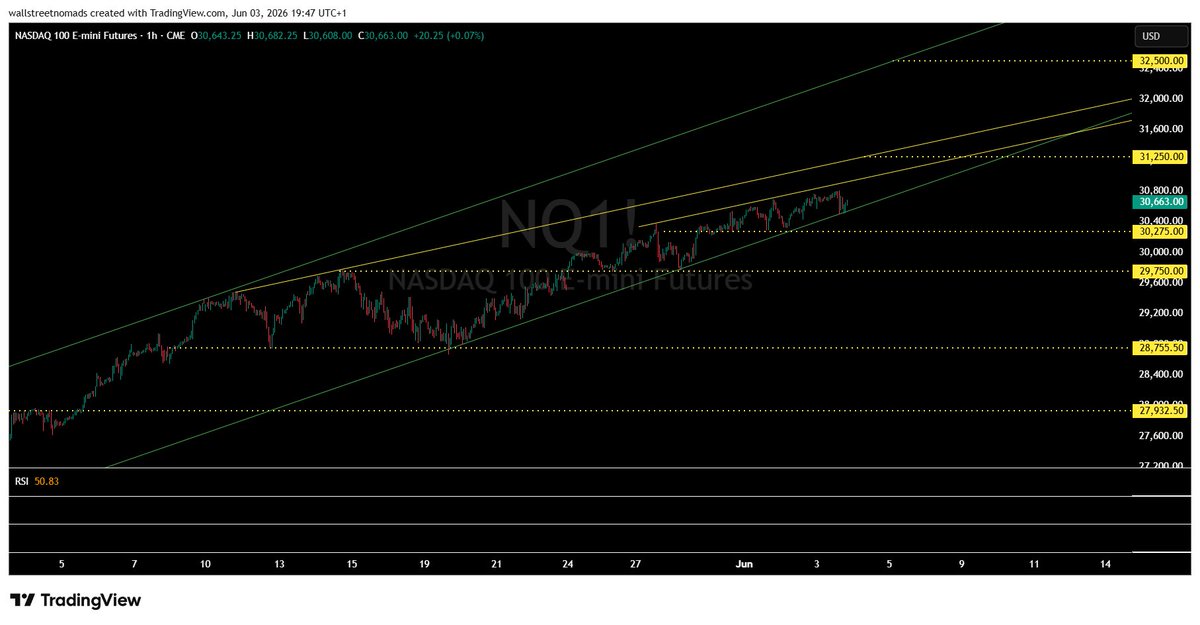
Following on from yesterday's $NQ update (attached for those who missed it), the futures have broken the uptrend and breached the 4hr 27ema which has been in total control for 10 weeks in both direction.
The support level at 30,275 is being assisted by the 4 hour 50ema for the time being so a decisive move to 29,750 is worth waiting for before we add anything to our existing short bias.
Have a great day.
x.com/wallstnomads/status/20…
$NQ as we see it.
Following on from the recent exhaustion indicators on the market indexes, the market advance has indeed seen ongoing distribution, with the Russell in particular seeing steady sideways action since May 22.
In $NQ this has given rise to the futures repeatedly testing the 10 week uptrend creating two minor wedges.
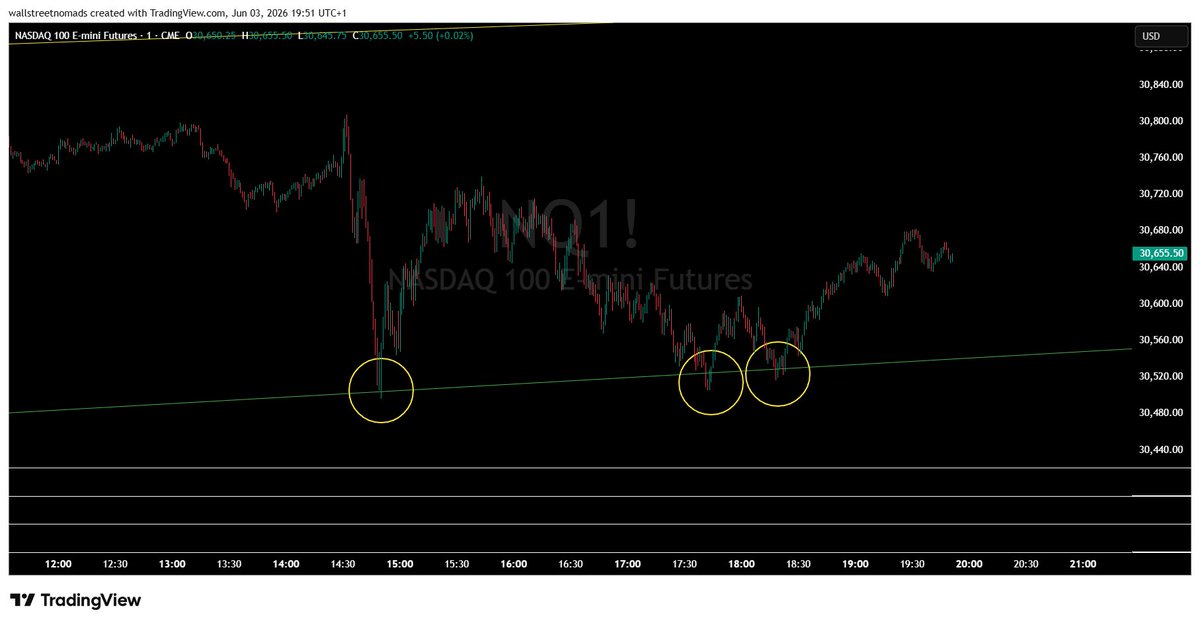
Yet despite the trend channel being tested 3 times just in today's session, it continues to find a bid there (chart 2).
Should we see a decisive break below then we're looking at 30,275 inititally followed by 29,750 and a larger shelf of support at 28,750. The 50 day ema comes in at 28,040.
To the upside, the outer wedge sits at 31,250 and a close above there leaves nothing in the way until the top of the trend channel up at 32,500 with the YTD VWAP 3SD currently running at 32,000.
$NDX $QQQ #NQ_F
9
26
535
Wall Street Nomads retweeted

May 24
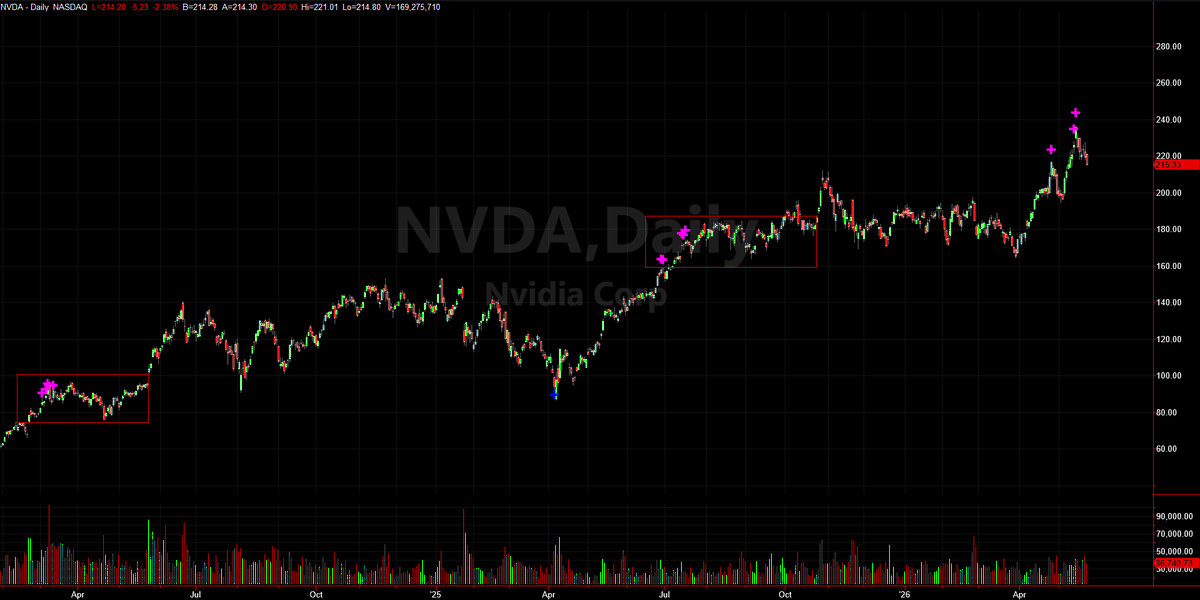
$NVDA could be in for another period of sideways consolidation. Here's why:
1. Weekly dark cloud cover suggesting supply demand equilibrium was met.
2. Weekly RSI divergence indicating that this recent run is weaker than the run into Oct 25 highs
3. The analog of the later stages of that run into Oct highs looks pretty similar in structure albeit on a different scale of time and price.
4. Daily exhaustion indicators have previously led to 4-8 weeks of sideways action.
Up and consolidating repeatedly in lock step form may be the way $5.7 tn stocks behave, we wouldn't know, we've never seen one.
Would make a lot of sense though.
$NDX $QQQ $SMH


4
2
26
696
$NQ as we see it.
Following on from the recent exhaustion indicators on the market indexes, the market advance has indeed seen ongoing distribution, with the Russell in particular seeing steady sideways action since May 22.
In $NQ this has given rise to the futures repeatedly testing the 10 week uptrend creating two minor wedges.
Yet despite the trend channel being tested 3 times just in today's session, it continues to find a bid there (chart 2).
Should we see a decisive break below then we're looking at 30,275 inititally followed by 29,750 and a larger shelf of support at 28,750. The 50 day ema comes in at 28,040.
To the upside, the outer wedge sits at 31,250 and a close above there leaves nothing in the way until the top of the trend channel up at 32,500 with the YTD VWAP 3SD currently running at 32,000.
$NDX $QQQ #NQ_F
1
17
196
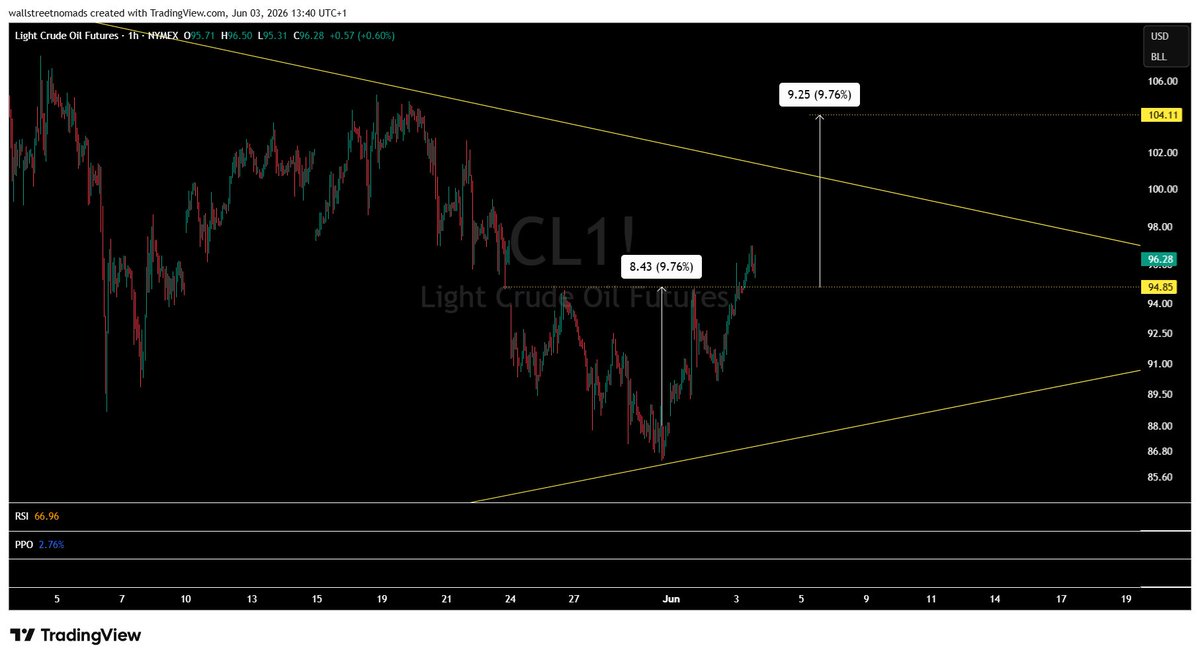
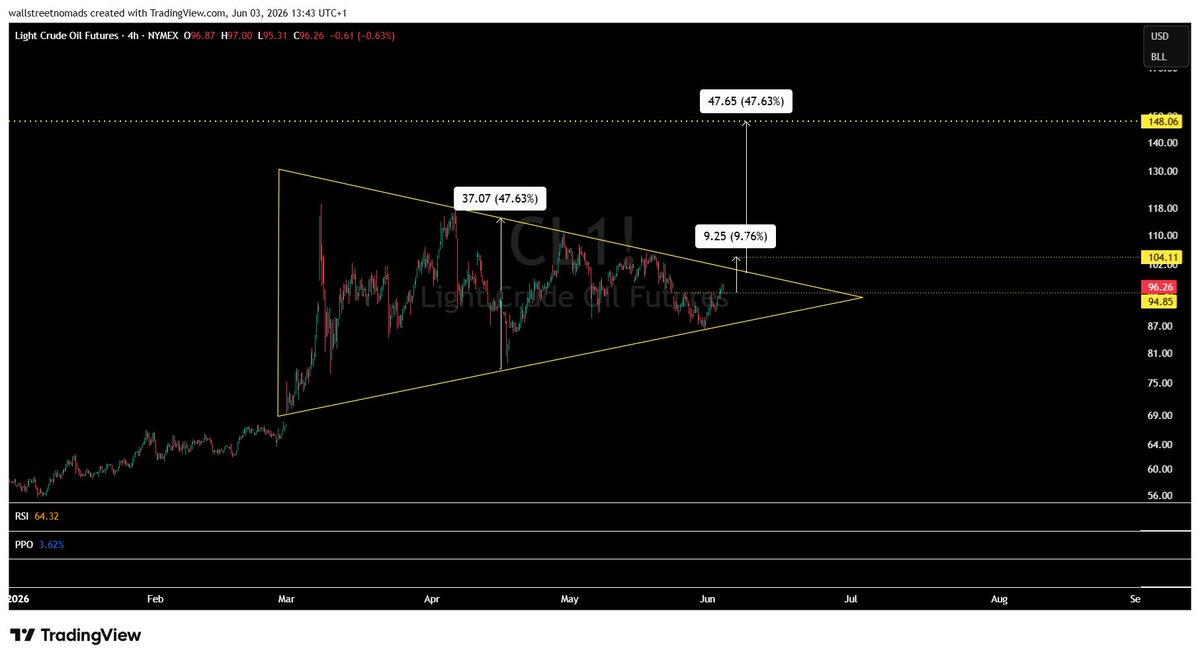
#oil has just broken out of an inverse head and shoulders, which if it plays out has a measured move to $104 in $CL taking it above the 4 month triangle.
If that triangle were to then make a measured move we're looking at $148. Coincidentally that line at $148 on chart 2 was already on there from previous work we've carried out.
Whilst this scenario is far from guaranteed, it is a tail risk that can be easily hedged.
1
16
220
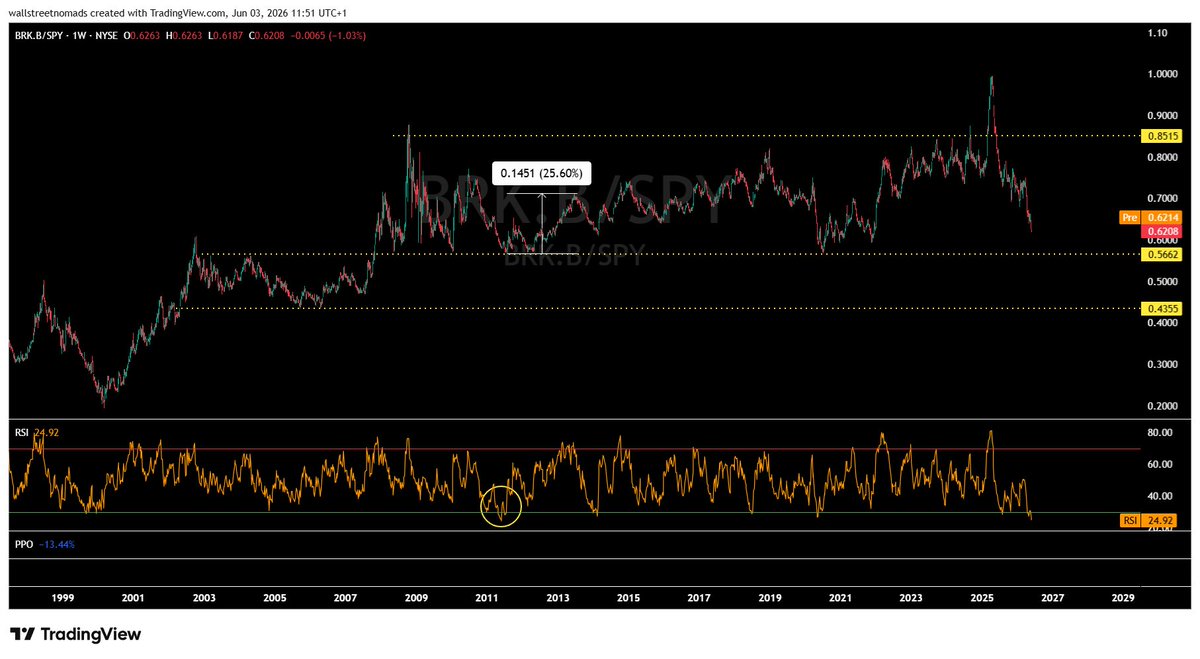
With more recent moves by Berkshire's Greg Abel into $GOOGL earlier in the year and now $TMHC, we turn our attention back to $BRK.B relative to $SPY
The ratio is still 10% off the 20 year range lows, however the level of relative underperformance vs the S&P puts the weekly RSI on the ratio within a whisker of its all time low marked in 2011.
So just how able is Greg Abel? From what we are seeing and hearing, we think this is worth getting a position started and building slowly.
Not a typical trade for us but for long term personal accounts, it seems rude not to.
2
12
234
Good morning all.
A quick look at Asian markets this morning:
TL;DR - Semis bubble firmly intact with chip heavy indices up, Korea over extension at an all time record, China and India quiet.
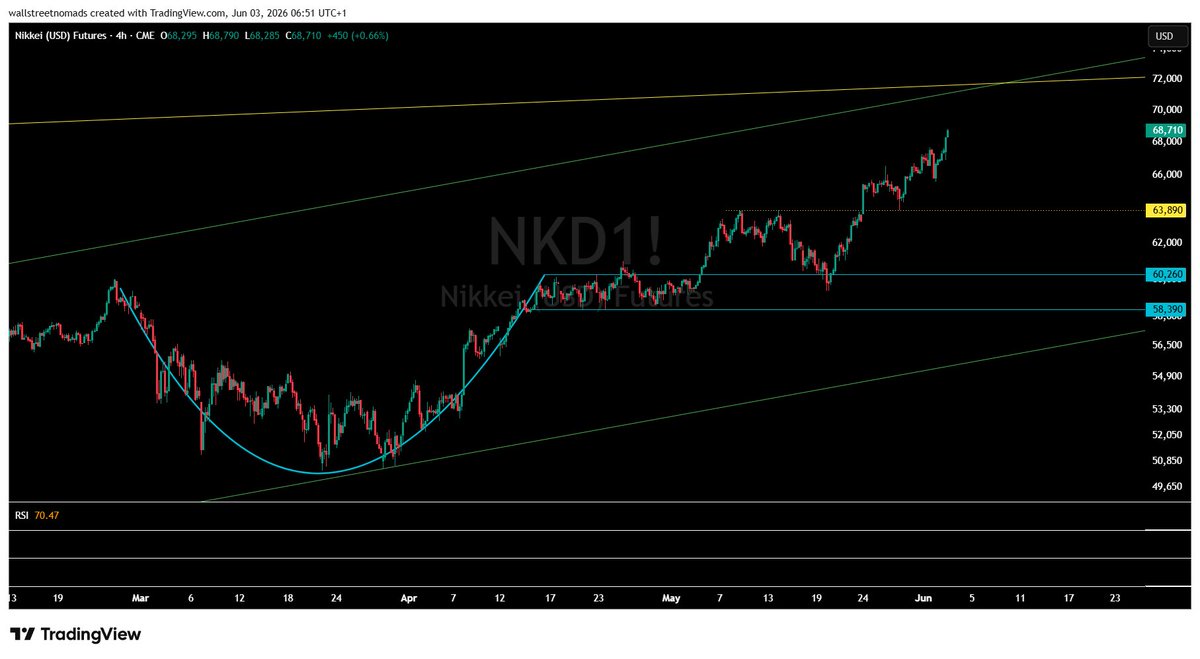
🇯🇵 Japan $NKD Nikkei Futures 1.7% @ 68,710
- we noted last week that the single touch of the 63,890 support and finding immediate buyers demonstrated that bulls were soaking up any distribution
- the futures have since continued higher to play out the cup handle formation that has been the driving force in the move higher towards its ultimate measured move of 71,000
- weekly divergence remains vs Feb highs and 4 hour divergence is present this week. Daily has been cleared
🇰🇷 Korea $KOSPI Composite Index 0.15% @ 8,800
- similar picture of Nikkei as last Thursday saw the index test the previous range and get immediately bought up
- we have refined our long term channel work from 10,000 to 10,600 as a major point of confluence
- please note that the index is now back to record levels on many metrics of almost 25% above its 50ema and the weekly is now 73% above its 50, an all time high since the index was launched in 1980.
- previous record was 57% set in July 1999. The daily extension levels have been at or near where we have seen previous pullback
- index is high susceptible to a massive drawdown at any point in time so longs need to be protected with options at all times
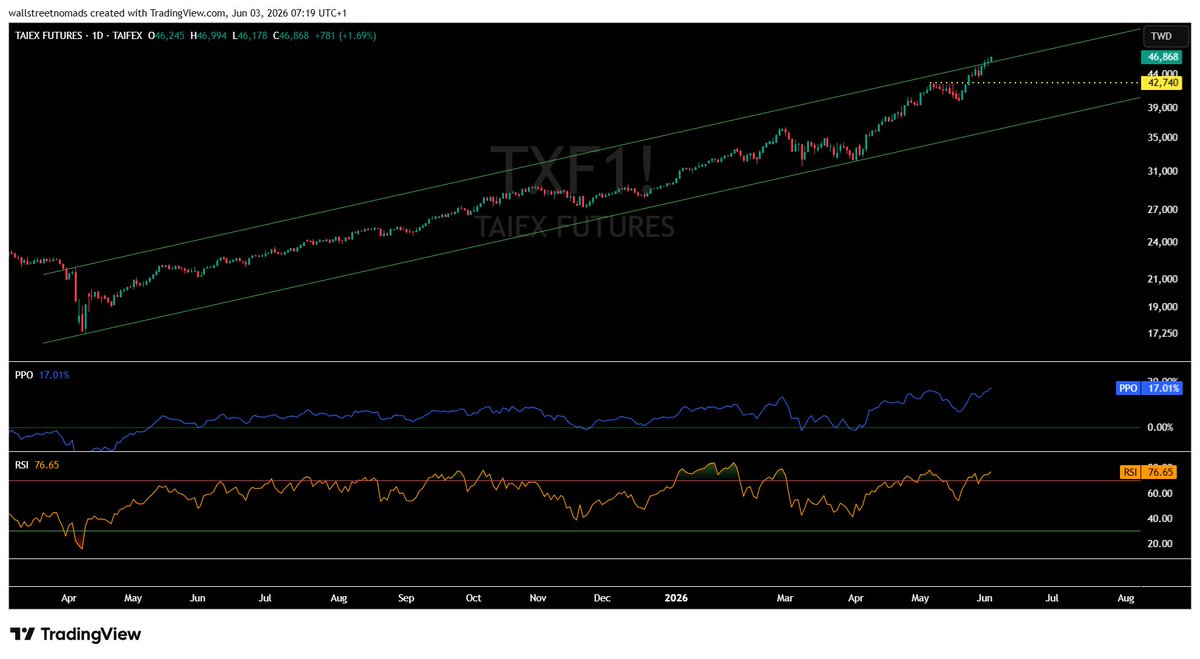
🇹🇼 Taiwan $TXF Taiex Futures 1.7% @ 46,860
- more of the same, relentless buying into extreme metrics
- daily is trading 17% over its 50ema, a new record as far back as our daily data goes on futures
- divergence is present vs highs of early May on the daily and vs Feb highs on the weekly
China and India remain in downtrends but have found minor support where they have both stabilized.
Have a great day trading ladies and gentlemen.

13
21
400
Pattern Day Trader rules are going in the trash on Thursday.
Brokers have an 18 month window to fully transition to real-time intraday margin requirements but some are advertising that they'll be ready on Day 1.
This is the largest change to retail trading since zero comms and will likely throw a few curveballs around at obvious stop levels.
2
9
220
Well done if you went for the $IGV straddle into month end. Or even better a strangle.
$95 straddle has returned 150% in just a few days.
June 90/100 strangle has returned 350%
$MSFT $ADBE
May 15
The biggest debate on our desk right now is if $IGV is in a rising wedge or a lop-sided inverse head and shoulders.
If it's the former then the IHS players are gonna be party to a nasty bull trap on the breakout.
One idea being floated is an end of month June options straddle if we can trade into the box area towards the end of this month.
$MSFT $ADBE $ORCL $PLTR $CRM $CRWD $PANW

3
14
638
Good morning all.
Just a heads up that we've printed repeated indicators on $VIX hourly over the last few sessions.
Sometimes that leads to just a quick pop, at others it can lead to a significant volatility event.
Time to scoop some cheap protection.
10
18
853