
Power BI | SQL | Python
Joined November 2024
- Tweets 268
- Following 1,789
- Followers 1,079
- Likes 1,462
22 Photos and videos


Pinned Tweet

5 Mar 2025
🚀 Join the FREE Power BI Live Training – Elevate Your Skills! 📊
🔑 What You'll Learn:
✅ Visual Design Best Practices – Create impactful visuals that communicate effectively
✅ Interactive Reports– Build dynamic, user-friendly dashboards 🌟
✅ Storytelling with Data – Transform raw data into compelling narratives
📅 08 Mar| 11:30 AM UTC
🖥️ Online – Join from anywhere!
👉 Drop your handle in the comments for the exclusive invite! 🎟️🔥
Don’t miss this chance to level up your Power BI expertise!
#PowerBI #DataVisualization #InteractiveDashboards #FreeTraining #LearnPowerBI #SQL #Premium
15
6
1,132
BI Consultant retweeted

1 Aug 2025
🚀 Episode 2 of my journey building an app to make Power BI easier.
From solo development to launching on Microsoft AppSource, I’m showing the behind-the-scenes — what worked, what didn’t, and why I kept going.
I built this for Power BI devs, analysts, and anyone chasing that idea they can’t shake.
I hope this inspires you today : )
🧵 Let’s keep it rolling.
🔽 Full video below 👇
1 Aug 2025

🎥 Just dropped a video on a poorman’s MCP server I built with Flask browser interface.
It passes Power BI workspace measure metadata through AI to help an LLM answer questions build visuals.
Didn’t always work perfectly 😅 but it’s a solid start...maybe just a start lol : )
1
1
1
973
27 Jul 2025
Finally, @data_ben made it!
This app is a game-changer for the Power BI community — truly helpful and built with real-world use in mind.
Want to know more about the app?
Subscribe using the link below!
youtu.be/TOVwAqOAUp4?si=EJ3P…
3
88
BI Consultant retweeted
7 Apr 2025
🧑💻💬 Vibe coding session this Saturday!
Hop online with the tech crew — bring whatever you're working on:
Power BI, SQL, front end, back end, Python... anything goes.
Ask questions, share wins, chill and build together. Calendar invite has the details. Let’s hang out. 👨💻👩💻✨
calendar.app.google/zpfrJSk7…
2
6
18
2,260
BI Consultant retweeted
1 Apr 2025
🎉 1,000 Members Strong! 🎉
A huge THANK YOU to everyone in The Data Lounge for making this community what it is! 🚀 Your support, insights, and passion for data continue to inspire. This is just the beginning—let’s keep learning, sharing, and growing together!
Check out this video to celebrate our journey so far. 🥂💡
#TheDataLounge #1000Strong #DataCommunity #PowerBI #ThankYou
4
2
14
1,637
BI Consultant retweeted
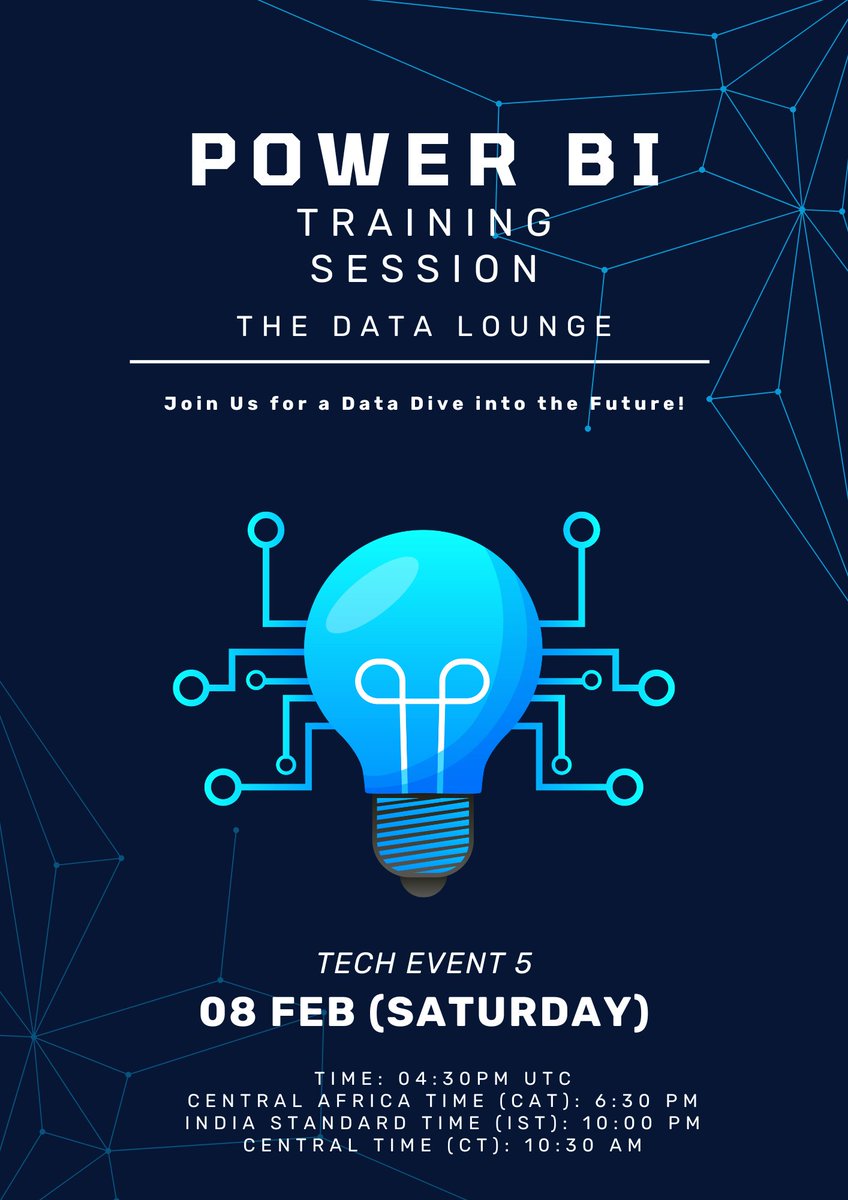
29 Mar 2025
🎯 Just wrapped up an awesome tech meet-up! We walked through the Power BI service and had a great Q&A session with some insightful questions. 💡
Check out the recording here 👇
#PowerBI #DataAnalytics #TechCommunity
5
19
1,754
BI Consultant retweeted
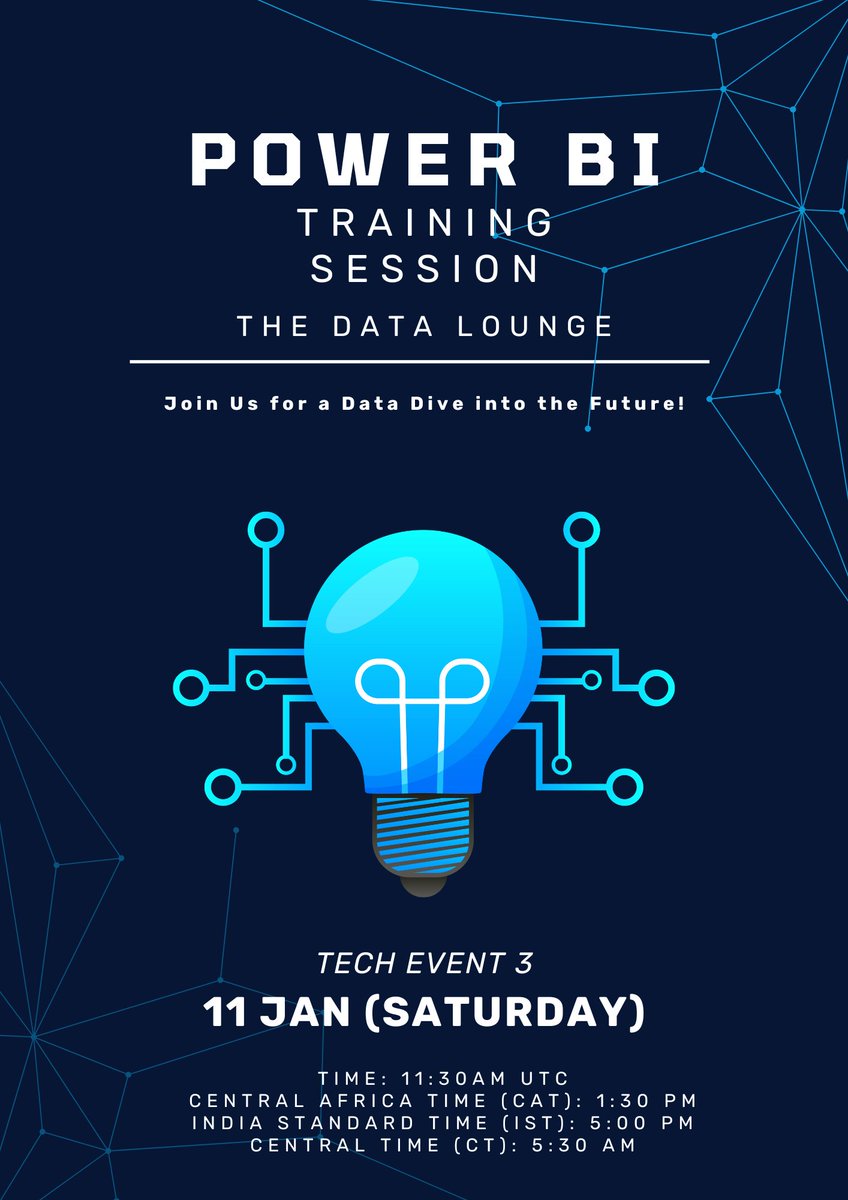
28 Mar 2025
🚀 Join us for an Online Tech Meetup!
📅 This Saturday
🌐 Topic: Deep dive into Power BI Service Open Q&A session
Bring your questions, invite your friends, and let's learn together! 💡
👉 Save your spot: calendar.app.google/4pBy1hc1…
#PowerBI #TechMeetup #DataAnalytics
3
5
1,802
BI Consultant retweeted
9 Mar 2025
🚀 Just posted a new video on the basics of Excel VBA! 🎯
No fancy edits — just me working through the challenges in real time. If you’ve ever wanted to see how Excel VBA works (mistakes and all), check it out! 💻🔥
#VBA #Excel #Coding #LearnByDoing
3
10
291
BI Consultant retweeted
9 Mar 2025
I wanted to say I appreciate all of you trying to skill-up and become data gurus! Keep on keeping on! I also appreciate all of you who are trying to help all those trying to skill up. You keep on keeping on too : ) Good day all you tech enthusiasts out there!
2
1
11
252
BI Consultant retweeted
8 Mar 2025
🚀 Exciting News: Report Visualization and Dynamic Visuals in Power BI – Training Recording Now Available! 🎥
We’re thrilled to announce that the recording of our recent online training session on Report Visualization in Power BI is now available for you to watch! 📊✨
In this session, we covered:
📏 Best Practices for Power BI Report Design – How to create clear, compelling, and easy-to-navigate reports.
🎨 Creating Dynamic Visuals – Tips and techniques to add interactivity to your reports and enhance the user experience.
🔍 Optimizing Data for Visualization – Ensuring that your data is clean, structured, and ready for impactful visuals.
⚙️ Power BI Features to Boost Interactivity – How to use slicers and parameters effectively.
A special 🙏 thank you to Sai for creating the fantastic training content, and to all the participants for their engaging questions and insightful conversations at the end of the session! 💬
If you want to level up your Power BI skills and learn how to take your reports to the next level with dynamic visuals, this training is for you! 🚀
Feel free to reach out with any questions, and we’d love to hear your feedback on the training! 📨
4
7
14
2,869
BI Consultant retweeted
8 Mar 2025
🚀 Introducing the DAX Measure Library! 🌍✨
We're building a global repository of DAX measures that anyone can use in their development! 🎉 Whether you're a Power BI pro or just getting started, you can contribute your own DAX measures, share solutions, and help others grow along the way. 🌱
To kick things off, I’m releasing a walkthrough video to show how it works and how YOU can start contributing. 📹 And to make it even more exciting, we’ll be giving out prizes for:
🏆 Highest contributors (most votes on your measures)
🔧 Most measures created (help build the library with your own creations)
This is your chance to be part of a community-driven resource that will grow and evolve alongside the Power BI and DAX ecosystem. By contributing, you’re not just creating a personal resource for your development — you’re helping build something that will be useful for everyone. 🌎
👥 Join the movement, share your knowledge, and let’s grow together!
Get started today at benmakesdataeasy.com and stay tuned for more details on how to win big! 💥
#PowerBI #DAX #MeasureLibrary #PowerBIDevelopers #DataCommunity #BICommunity #Analytics #MeasureCreation #DAXCommunity
2
7
13
2,257
BI Consultant retweeted
6 Mar 2025
🚀 Join the FREE Power BI Live Training – Elevate Your Skills!
📷 Visual Design Best Practices – Create impactful visuals that communicate effectively
📷 Interactive Reports– Build dynamic, user-friendly dashboards
📷 Storytelling with Data – Transform raw data into compelling narratives
📷 08 Mar| 11:30 AM UTC 📷
Invite Link
calendar.app.google/9PwoTcZj…
1
3
5
1,624
5 Mar 2025
5 Mar 2025

🚀 Join the FREE Power BI Live Training – Elevate Your Skills! 📊
🔑 What You'll Learn:
✅ Visual Design Best Practices – Create impactful visuals that communicate effectively
✅ Interactive Reports– Build dynamic, user-friendly dashboards 🌟
✅ Storytelling with Data – Transform raw data into compelling narratives
📅 08 Mar| 11:30 AM UTC
🖥️ Online – Join from anywhere!
👉 Drop your handle in the comments for the exclusive invite! 🎟️🔥
Don’t miss this chance to level up your Power BI expertise!
#PowerBI #DataVisualization #InteractiveDashboards #FreeTraining #LearnPowerBI #SQL #Premium
2
9
1,200
BI Consultant retweeted
1 Mar 2025
🚀 Preparing for a data interview? Here are 7 FREE training resources to help you ace it!
📊 1. DataLemur – SQL & Data Science Questions (datalemur.com)
📊 2. StrataScratch – Real SQL Interview Questions (stratascratch.com)
📊 3. LeetCode – SQL & Algorithm Problems (leetcode.com)
📊 4. Mode Analytics – SQL Tutorial (mode.com/sql-tutorial)
📊 5. DataCamp – Free SQL & Python Courses (datacamp.com)
📊 6. Kaggle – Datasets & Notebooks for Practice (kaggle.com)
📊 7. Acing Data Science Interviews (Free Guide) (acedatascience.com)
🔥 Save this for later & happy studying! 💪 #DataScience #SQL #TechInterviews
1
3
7
252
BI Consultant retweeted
28 Feb 2025
🚀 Learning SQL in 7 Days! 🚀
If you're ready to dive into SQL, here's a roadmap to help you learn the fundamentals in just 7 days! Let's break it down:
Day 1: Introduction to Databases & SQL Basics
🔹 Understand what a database is and why SQL is essential.
🔹 Learn basic SQL commands: SELECT, FROM, and WHERE.
🔹 Practice querying single tables.
Day 2: Filtering & Sorting Data
🔹 Dive deeper into WHERE clause for filtering data.
🔹 Learn how to sort results using ORDER BY.
🔹 Use comparison operators like =, >, <, IN, BETWEEN, and LIKE.
Day 3: Working with Multiple Tables (Joins)
🔹 Understand the concept of "joins."
🔹 Learn INNER JOIN, LEFT JOIN, RIGHT JOIN, and FULL JOIN.
🔹 Practice combining data from two or more tables.
Day 4: Aggregating Data
🔹 Learn about aggregate functions: COUNT(), SUM(), AVG(), MIN(), MAX().
🔹 Use GROUP BY to summarize data.
🔹 Understand HAVING to filter aggregate results.
Day 5: Subqueries & Nested Queries
🔹 Learn how to use subqueries in SELECT, FROM, and WHERE clauses.
🔹 Understand how to nest queries for more complex filtering and aggregation.
Day 6: Modifying Data
🔹 Learn how to insert new rows with INSERT INTO.
🔹 Update existing records with UPDATE.
🔹 Delete data with DELETE.
Day 7: Database Design & Normalization
🔹 Learn about primary keys, foreign keys, and relationships.
🔹 Understand the basics of database normalization (1NF, 2NF, 3NF).
🔹 Practice designing a simple database schema.
💡 Pro Tip: Keep practicing by solving real-world problems and exploring SQL challenges on platforms like LeetCode, HackerRank, and SQLZoo!
Happy SQL learning! ✨ #SQL #Database #TechJourney
2
3
14
917
BI Consultant retweeted
24 Feb 2025
MONDAY CHALLENGE!!!!!!!
You have an SQL query and you start seeing duplicates in the results and you know they shouldn't be there. Where do you start troubleshooting?
5
2
11
843
BI Consultant retweeted
23 Feb 2025
🚀 Hey everyone! Just a quick reminder—our next online tech meetup is happening on March 8th! 🤖💡 It’s a great chance to connect, share ideas, and geek out over tech. Bring a friend & let’s make it awesome! Who’s in? 👇🔥 #TechCommunity #Networking
1
3
104
22 Feb 2025
🚀 Stop Overcomplicating Your Reports! 🎯
Before diving into visuals and fancy charts, ask yourself:
👥 Who is this report for?
🔍 What do they actually need from it?
Getting these answers first changes everything! Instead of stuffing reports with everything possible, focus on what truly matters. A clean, insight-driven report is far more powerful than one overloaded with unnecessary visuals.
✨ Clarity > Complexity ✨
Make your reports work for the users, not just look good!
💬 What do you think? Do you prioritize user needs before designing reports? Drop your thoughts below! ⬇️
2
5
198
BI Consultant retweeted
21 Feb 2025
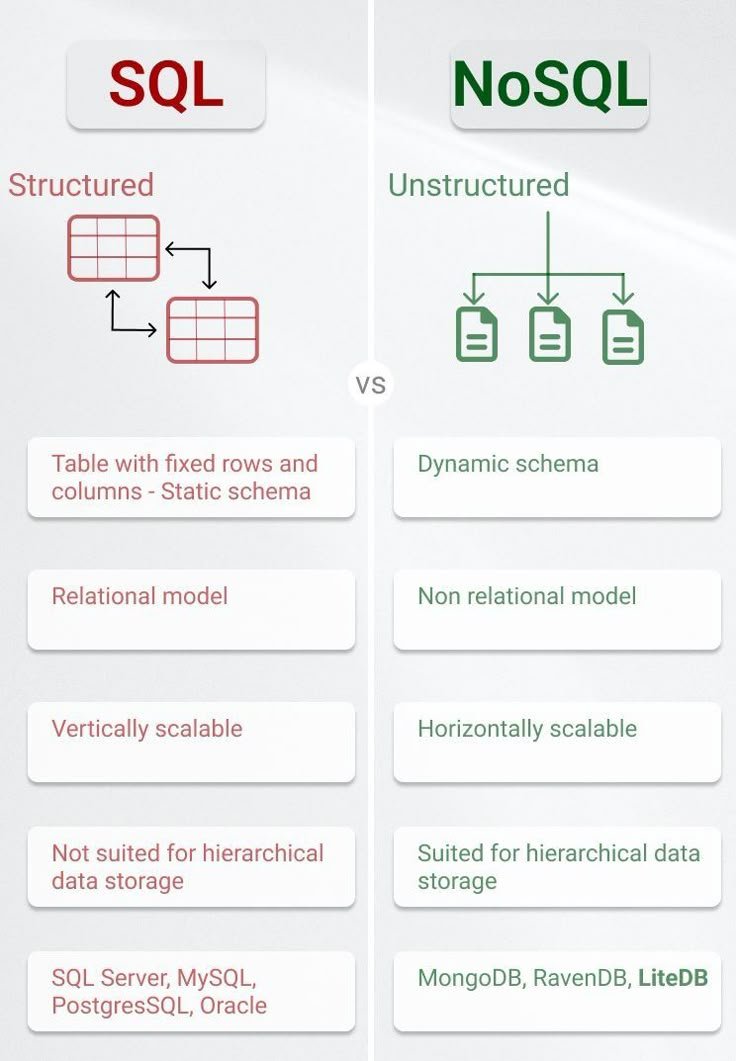
Sql vs noSQL

1
3
107
BI Consultant retweeted
21 Feb 2025
🚀 Who’s up for a Power BI challenge? 🚀
We’re thinking about hosting a free contest where participants build a data model and create a Power BI report—and the best one wins $100 USD! 💰🔥
Would you be interested? Drop a 🔥 in the comments if you’d join, and tag a friend who should compete!
Let’s make this epic! #PowerBI #DataChallenge #Analytics
12
5
23
1,964